
Little speculative manias are bubbling up to the surface in the US markets. But while financial instability is growing in the United States as a result of aggressive monetary expansion, a collapse in the equities market does not appear imminent given tame inflation and ultra-low rates and yields.
What is more likely is an acceleration of speculative mania, continued secular weakening of the US Dollar, and underperformance of the broad market running in tandem with wild swings in selected stocks and assets.
But watch inflation. When it eventually turns up, the stampede out of risk assets will crush investors, and there won’t be much the Fed can do without inflicting severe pain on both the economy and asset markets.
On the other side of the world, the People’s Bank of China has 3.85% in its 1-year Loan Prime Rate and 12.5% in its reserve requirement ratio to cut if developed markets crash. The Fed’s policy rate and its reserve requirement ratio are both zero. There is nowhere to go but up, and by a long way, when inflation picks up. Here is our take on what to watch for.
Bubble, bubble, toil and trouble. Recent strange shenanigans in the US markets had commentators and strategists – including some of the best-known names in asset management – mentioning the “b” word, “bubble”.
In case you missed it, recent outbreaks of mania have included the price of Gamestop (a loss-making video game retailer) going through the roof, amidst a battle that saw an army of retail investors defeating hedge fund short sellers. Apparently young users of social media site Reddit banded together to squeeze hedge funds short sellers of GameStop. The retail punters won. The Wall Street professionals scrambled to cover their shorts, squeezing Gamestop prices even higher. Gamestop’s stock price went from around US$14 to over $285. It then went back down to US$46.
Then there was Dogecoin, a parody crypto currency which rose more than 700% in one day. This was a crypto currency created by software engineers as a bit of a joke. “Doge” is an internet meme and a term used by children to refer to the Shiba dog, a cute fox-faced Japanese breed. Yes, Reddit was again the platform for the gathering of the Dogecoin army. Elon Musk had something to do with it, too. He tweeted “doge” in December. Last week, he tweeted a magazine cover featuring a photo of a dog. Never mind it was a Whippet, not a Shiba dog. His followers nevertheless saw that as a signal to buy Dogecoin.
Speaking of Signal, Mr. Musk tweeted “Use Signal” early this month. That sent the stock of Signal Advance up 64.5 times in less than a week! That is, before the “Elonistas” realised their hero was probably advocating the use of the Signal messaging app. Signal fell back from US$38.70 to US$10 in one day. Wrong signal.
“A major bubble event”. This sort of “nuttiness” is worrying some of the world’s most famous investment professionals. For example, a few weeks ago, Jeremy Grantham of GMO warned the market was “waiting for the last dance” – that is, the US was likely in the midst of a “major bubble event”, although he could not say when it would end.
“Overvaluation is a necessary but not sufficient condition” for the bursting of a bubble, he said, and “calling the week, month, or quarter of the top is all but impossible.”
Valuations are high by historical averages. That the US market is generally overvalued by historical standards appears self-evident when using standard multiples such as price to earnings or price to book ratios.
Yes, the S&P 500 forward 12-month forward PE ratio is currently at 21.8. The 5-year average is 17.6 and the 10-year average is 15.8. The Shiller Cyclically Adjusted Price to Earnings Ratio (CAPE Ratio) is now a bit over 33. This is the second highest in the history of the S&P 500, exceeded only in the late 1990s, in the lead up to the Nasdaq Crash.
Valuations flex depends on monetary conditions. Viewing valuations through the lens of history without accounting for the different conditions prevailing at different points in history misses a lot of nuance. The most important of those variable conditions are inflation and monetary policy conditions.
Indeed, when valuation multiples are adjusted for interest rates, a more benign picture emerges.
Another way of viewing this is that while the COVID-19 pandemic has negatively affected corporate earnings, the decline in the discount rate for valuation calculations has more than offset the temporary disruption in profits.
In January 2000, the 10-year US Treasury yield peaked at 6.8%. It is currently only 1.1%. So, the rise in market valuations may simply be reflecting the inverse relationship between the net present value of a stream of expected future cash flows and the discount rate applied to those calculations. The inverse correlation between the S&P 500’s TTM PE ratio and the 10-year US Treasury bond yield is clear (figure 1).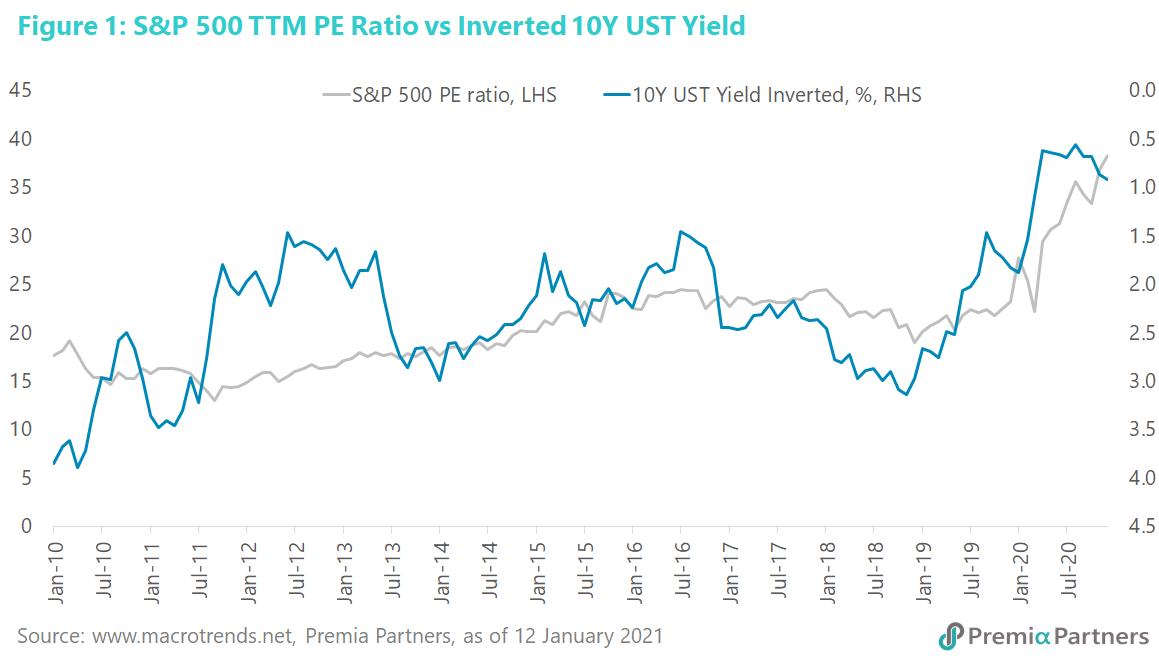
Valuations, overlayed with interest rates, look much more benign. The so-called “Fed Stock Valuation Model” – which compares the market’s forward earnings yield against the 10-year US Treasury yield – showed a still decent spread of around 350 basis points between the two by the end of last year (4.51% for the S&P 500 forward earnings yield minus 0.95% for the 10-year UST yield).
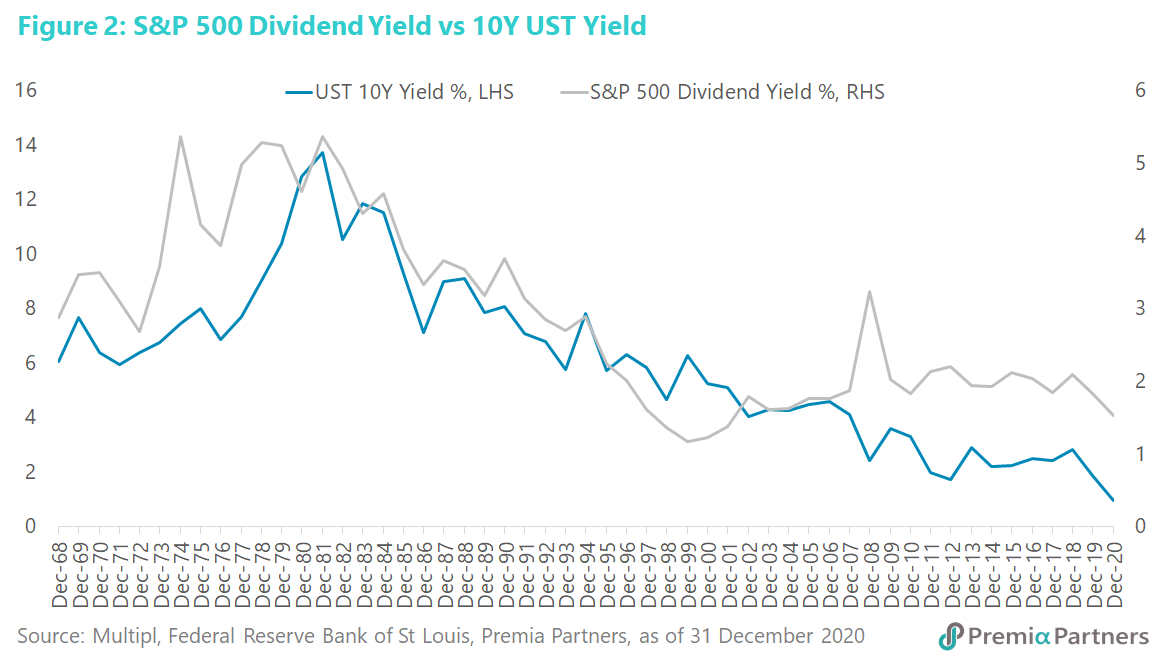
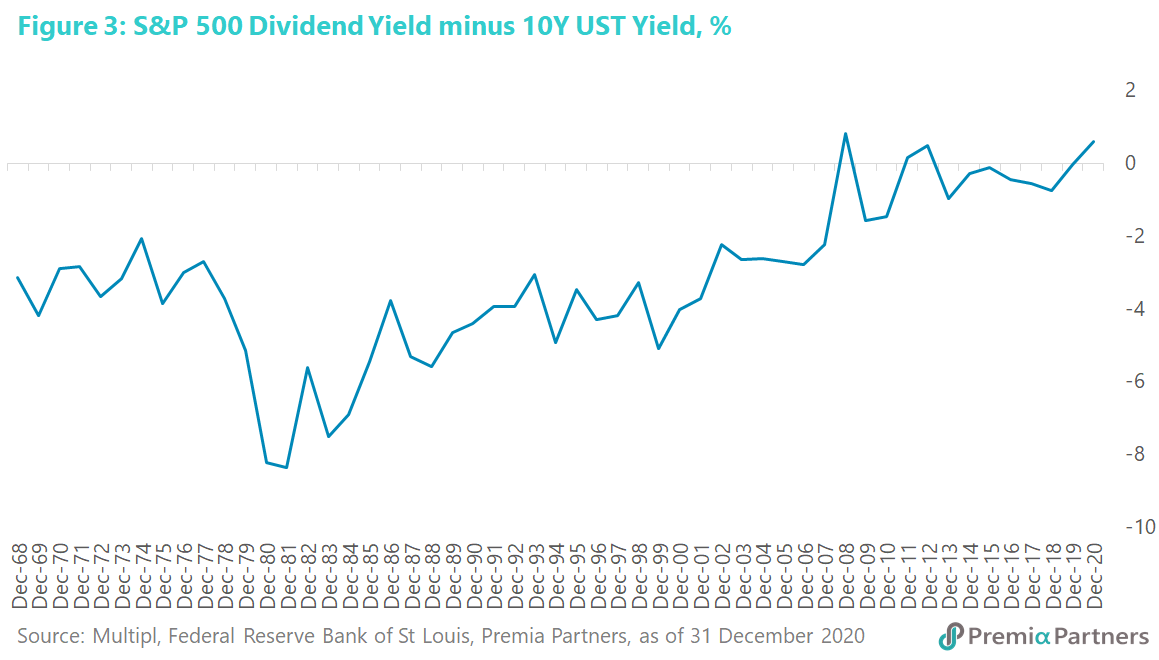
Using dividend yields as an alternative, we have a 59-basis point spread between US stock dividend yields and the 10-year US Treasury yield, which has not been seen in over half a century of data, except for a brief spike during the depth of the Global Financial Crisis, which was likely an anomaly linked to sharp falls in stock prices (figures 2, 3).
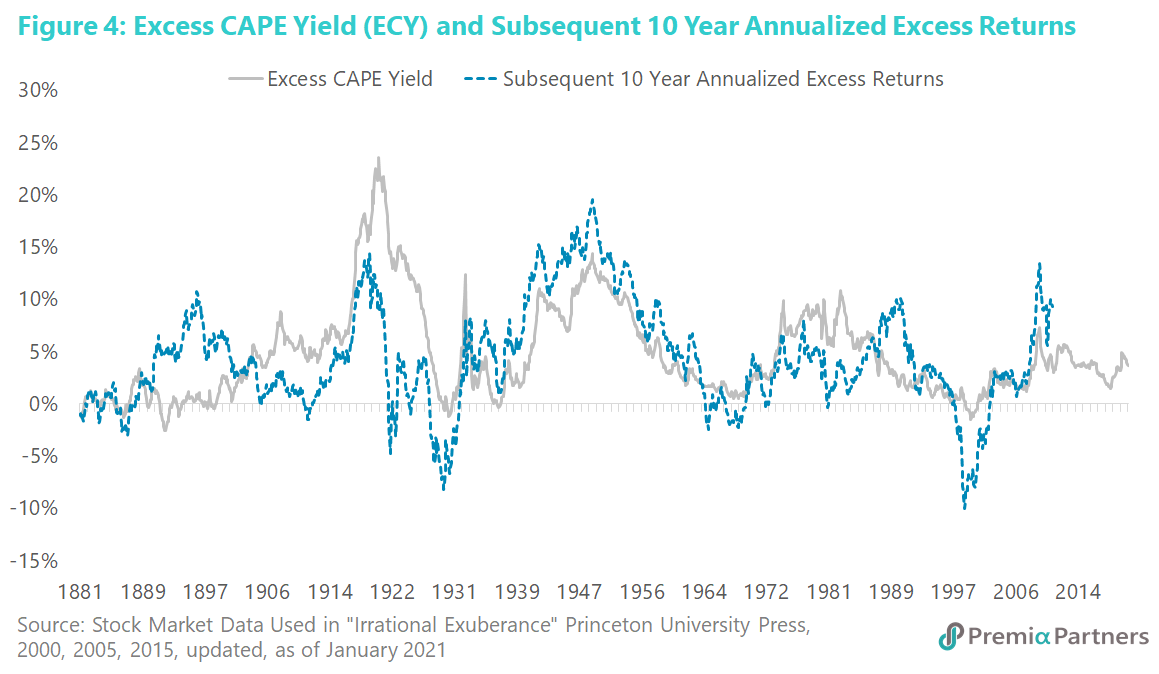
On the same theme, although the Shiller Cyclically-Adjusted Price to Earnings Ratio (CAPE Ratio) for the S&P 500 is historically high at around 33x, the current valuation looks much more reasonable when adjusted for interest rates. The so-called “Excess CAPE Yield” – which inverts the CAPE ratio to derive an earnings yield, and then adjusts that by subtracting the 10-year real interest rate – is currently at 3.7%, a level which historically favours positive to strong subsequent 10-year annualised returns (figure 4).
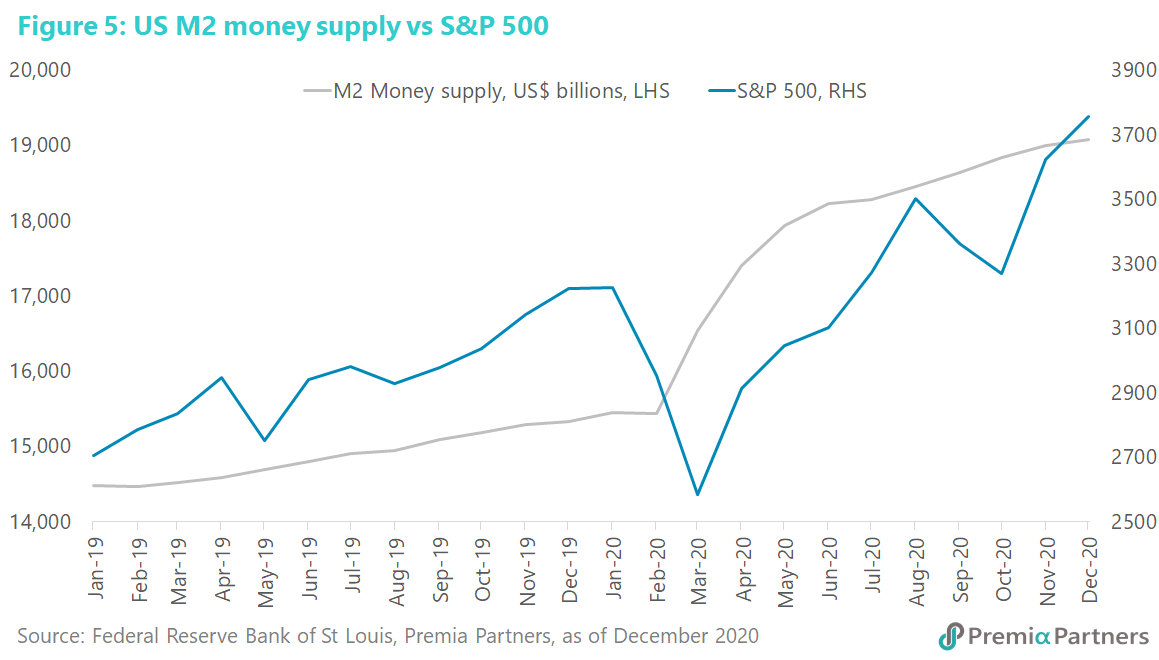
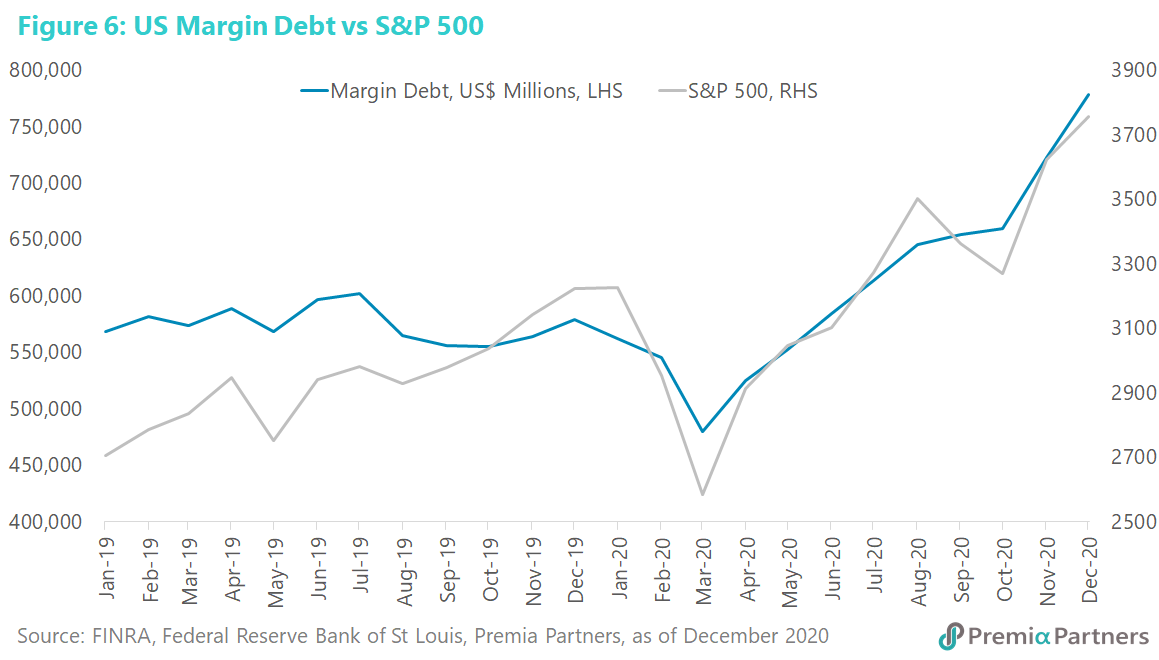
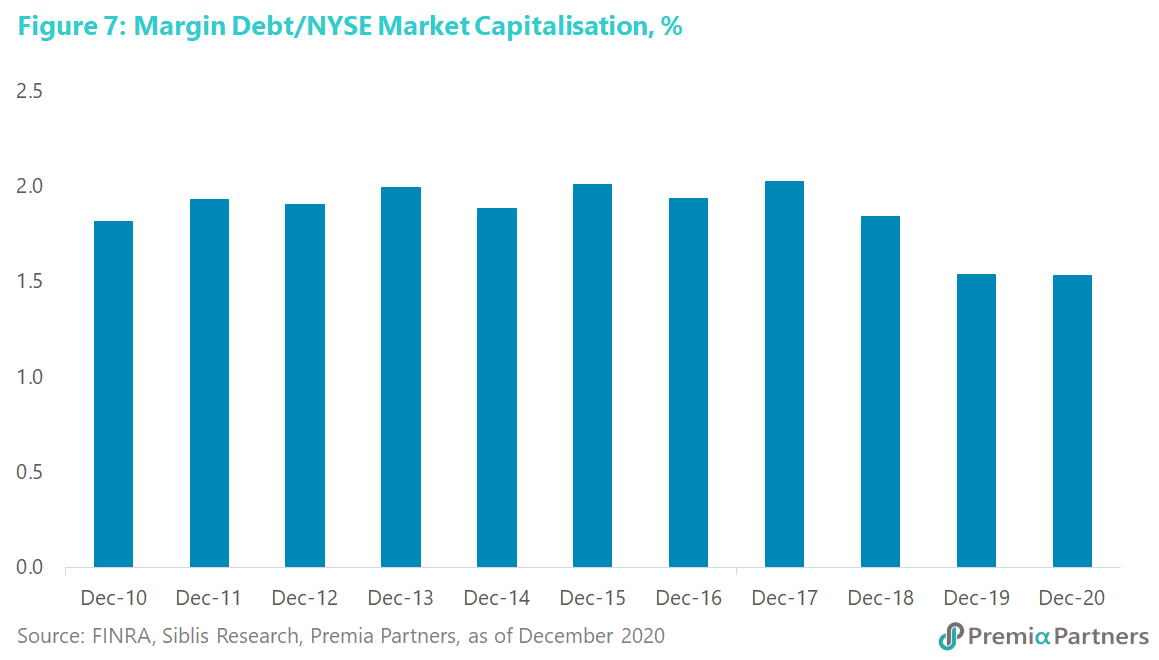
The risks of financial instability are rising but they may accelerate rather than end the emerging bubbles. There has been some concern over the rising level of margin debt, seen as yet another manifestation of a growing bubble. However, there is nothing particularly illuminating about this. The rising tide in money supply over the past decade has driven up stock prices (figure 5), and with the rising value of the stock market has come higher absolute levels of margin debt (figure 6). So, the rise in the level of margin debt is simply a function of the size of the stock market’s capitalisation. Indeed, the percentage of US margin debt to the market capitalisation of the NYSE has gone down from 1.8% at the end of 2010 to 1.5% by the end of 2020 (figure 7).
Of course, none of this is to deny that a higher absolute level of margin debt caused by inflating asset values can eventually be a source of instability. Yet, it is important to also have some perspective on this in terms of the larger monetary phenomenon.
Monetary expansion could create growing financial instability running in tandem with asset inflation. The flood of liquidity caused by extreme monetary expansion around the world will eventually cause financial instability. But at this stage, this is more likely to be manifested in periodic outbreaks of bubble-like mania in selected stocks and assets. A more substantial part of that instability will likely be continued lack of confidence in the US Dollar. But a global collapse in equities is unlikely until we see sustained inflation, forcing the hands of policy makers to raise rates.
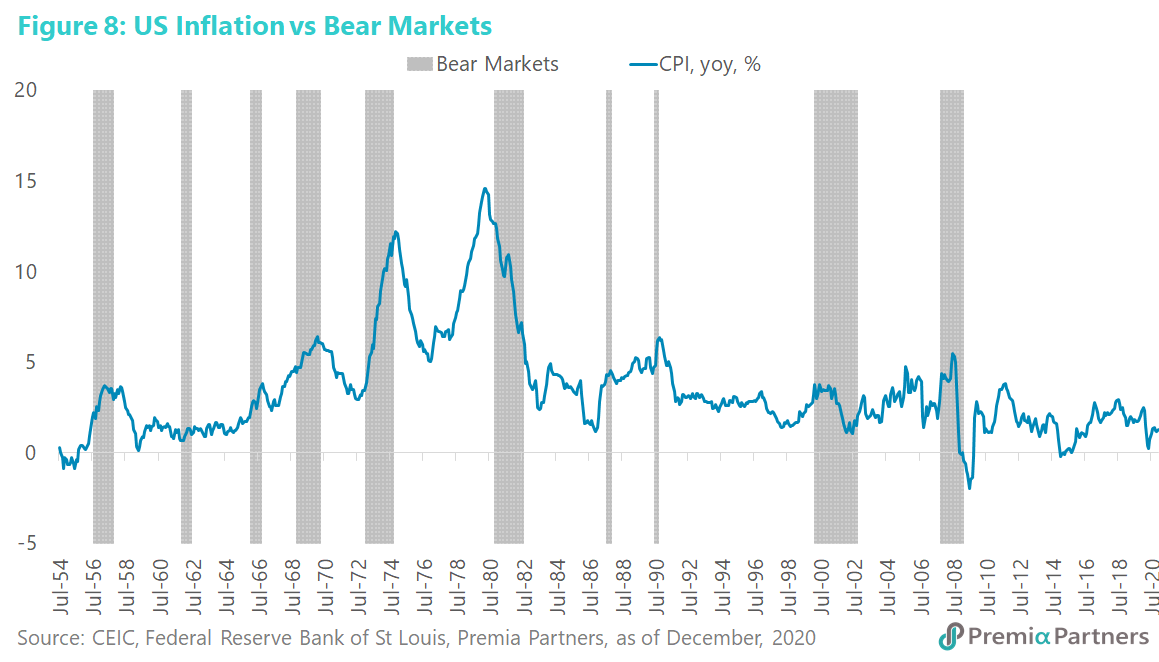
So how does it end? The saying goes that bull markets are born in ice, and bear markets are born in fire.
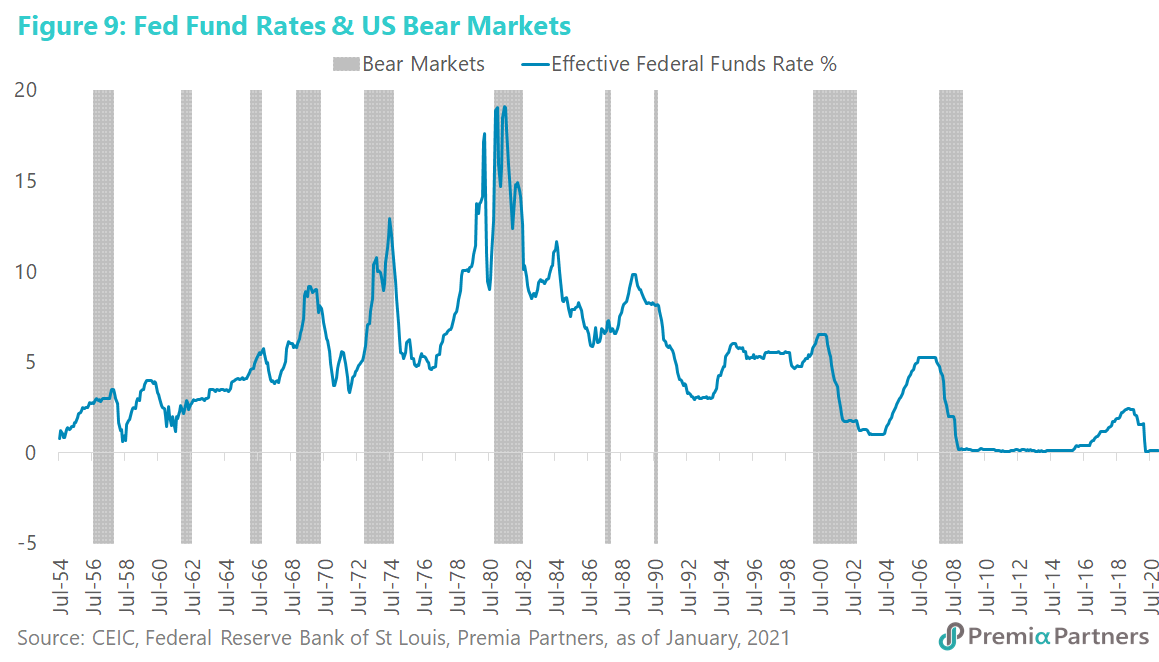
Almost every US bear market over the past 70 years (with the exception of the brief so-called “Kennedy Slide” of 1962) have been preceded by rising inflation and a rising Fed Funds Rate (figures 8, 9).
While US inflationary expectations have been rising, actual inflation is still very tame. An incipient rise in inflation in 3Q20 was crushed in 4Q20. The US Federal Reserve will probably not hike its target rate until around 2023-2024, given its 2% average inflation target.
Back to the topic of US inflationary expectations: They are reflected in the 10-year Breakeven Inflation Rate, which has been rising quite sharply from March of last year.
(The 10-year Breakeven Inflation Rate is derived from the 10-Year US Treasury yield minus the 10-year Treasury Inflation Protected Securities or TIPS yield. If inflation is unchanged over the next 10-years, you should get pretty much the same total returns from holding a 10Y UST as you would from holding a 10Y TIPS. But if the market expects inflation to rise, it should logically be selling USTs and driving up the nominal 10Y yield, while buying TIPS, driving down the equivalent maturity TIPS yield. In the process, it drives up the spread between the 10Y UST yield minus the 10Y TIPS yield, resulting in that spread being used as an approximation of the market’s inflation expectations.)
Note that the 10-year US Breakeven Inflation Rate has diverged sharply from the 10Y US Treasury yield (figure 10). They both started at about the same level this time last year, at around 1.6%. While the 10Y Breakeven Inflation Rate has run way above pre-pandemic levels, the 10Y US Treasury yield is still very much below the levels of a year ago.
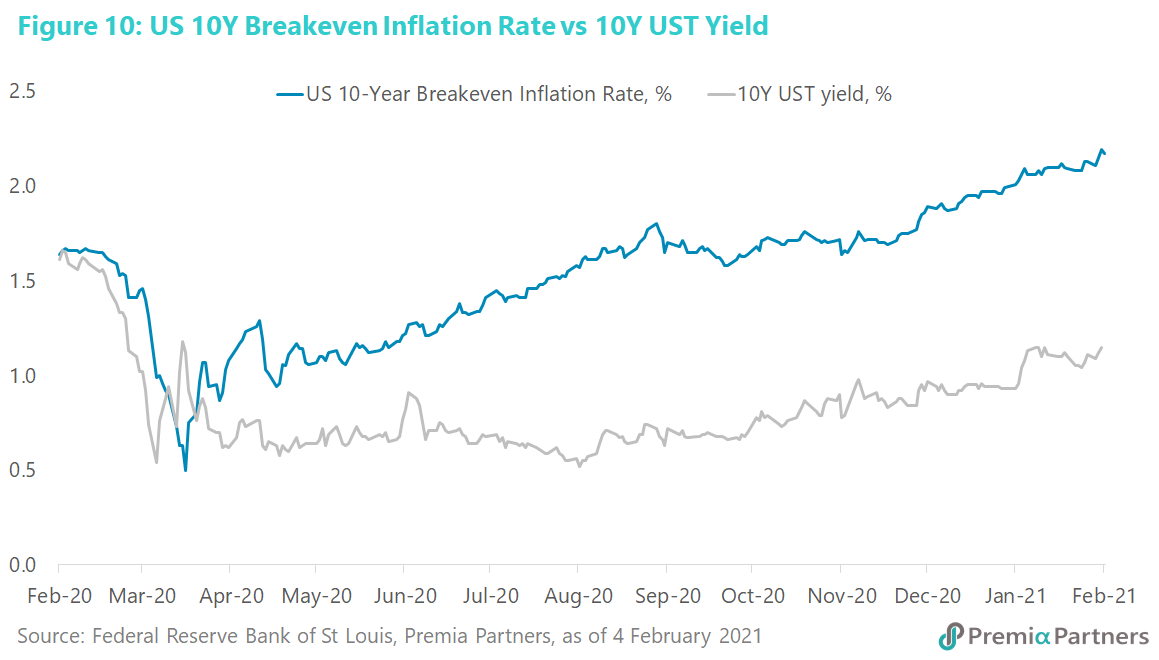
The bond market is hinting to us how it thinks this movie will end.
This divergence in part reflects the Federal Reserve’s suppression of the 10-year US Treasury yield through quantitative easing. It also reflects in part the still depressed nature of the US economy.
The rising 10-year Breakeven Inflation Rate is more about the surging market for US Treasury Inflation Protected Securities (and hence their falling yields) – a reflection of the fear of long-term inflation – than the rise in the 10-year US Treasury yield (which is more reflective of strength in the economy).
The hint here is of fear of stagflation down the line – high inflation caused by aggressive monetary expansion accompanied by sluggish real GDP growth and high unemployment caused by the scarring from the pandemic and the accumulation of debt over the decades. But it is worth emphasising that these are 10-year securities. They reflect expectations many years down the line.
Right now, central bankers are more concerned with breaking the ice than fighting fires.
“Act big,” was the in-concert chorus from US President Joe Biden and Treasury Secretary Janet Yellen. So, developed market governments are acting big all over the world, spending big on borrowings, in greater or lesser part supported by their central banks’ bond buying programmes.
The US is leading in this regard. It is more concerned with breaking the ice around the economy than potential fires down the line. Core US PCE inflation has gone down sharply from an annual rate of 3.4% q/q in 3Q20 to only 1.4% in 4Q20.
Limits of central bank power – watch closely for hints of inflation.
Technically, there is no limit to the extent to which the Federal Reserve can expand its balance sheet to finance the government’s deficits. For example, if a bank with a claim on the Federal Reserve, hypothetically, demands cash from the central bank, all the Fed would have to do is to substitute one liability (bank reserves) with newly created cash in circulation, another type of liability.
Yet, there are practical limits in the form of financial stability, with speculative mania already bubbling to the surface, more recently from the Reddit social media community and at online broker Robinhood. However, the Fed will continue to deny any link between its monetary policy and speculative bubbles because it needs to keep interest rates ultra-low to raise nominal GDP growth above the government’s long-term borrowing costs.
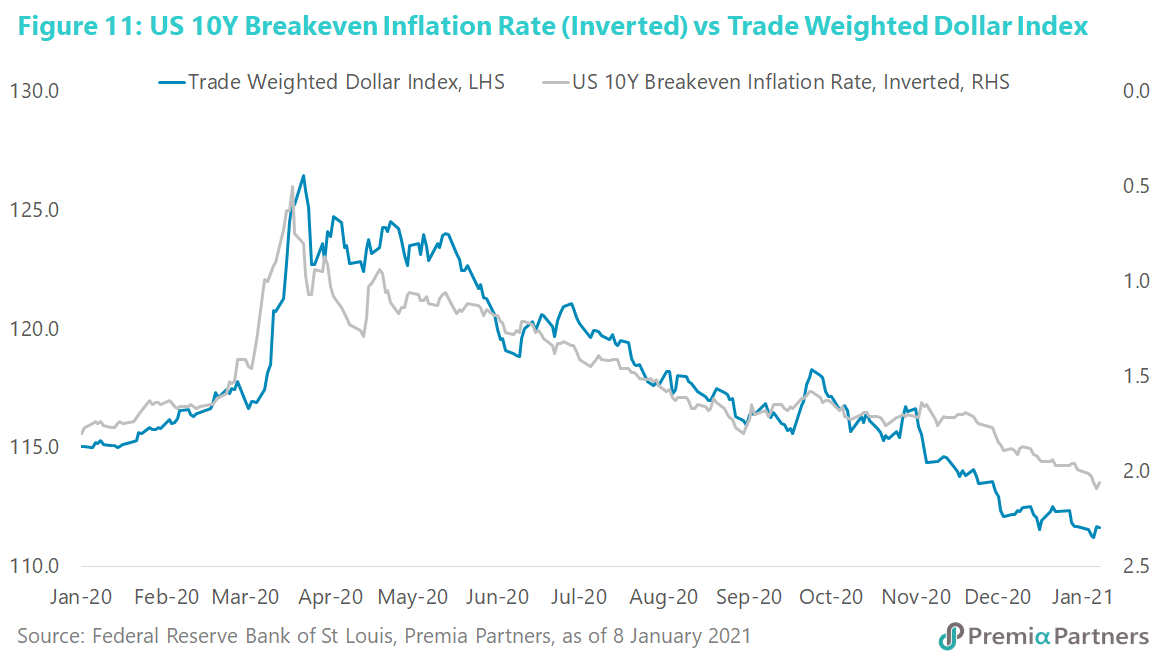
Another limit is the negative impact of monetary expansion on the US Dollar. One transmission mechanism is via inflation expectations, as demonstrated by the inverse correlation between inflation expectations and the value of the US Dollar (figure 11). Again, the Fed will tolerate that, notwithstanding its recent declaration that it does not have a weak Dollar policy.
A weaker Dollar is stimulatory for the economy. Nonetheless, note that secular decline in the US Dollar is likely to dampen US equities performance and result in funds flowing into Emerging Markets, driving a rotation in relative performance.
Ultimately, the most important limiting factor is inflation. The Fed’s new 2% average inflation target means it will allow inflation to run above 2% for “a period of time” to entrench that average 2% inflation before it raises its policy rates. That suggests it could be 2023-2024 before the Fed raises its target rate.
Also, beware complacency. Watch inflation closely – not just the PCE inflation rate, but also the Core CPI rate and the Cyclical Core Inflation Rate compiled by the Federal Reserve Bank of San Francisco. None of them are threatening at the moment.
The velocity of M2 money has plummeted from 1.4 just before the pandemic to 1.1 at end-2020. All that tells us is that, the US GDP has fallen off a cliff and M2 money has gone through the roof.
So, for now, the money is stashed away in banks, as demonstrated by the 23% surge in US commercial bank deposits over the past 12 months. That much cash sitting at near zero rates in banks is dry tinder for inflationary fires.
Even the big spenders of Modern Monetary Theory have limits to coordinated fiscal spending and central bank monetary expansion. The limits kick in when inflation starts running up strongly. Then either rates go up, or taxation goes up, or indeed both. The bull market will end before that – on even the whiff of the fires of inflation and ahead of the reality of higher rates and/or taxes.
For further reading
• China: Set to overtake the US economy sooner than expected
• Green economy
• US inflation expections: Implications for global markets
• Where to find growth: Tailwinds from Asia Megatrends, and Playbook to participate in Asia Innovations and Technology-enabled Productivity Growth
