The dragon and the bear: Chinese equities rise as US stocks slide.
Chinese equities have been putting on breakouts above technical resistances just as US stocks have been collapsing into bear territory, and this does not seem coincidental.
At opposite ends of the policy cycle. At the heart of this may be the policy tightening in the US, the looming consequent recession, and the search for alternatives to US assets – stocks, Treasuries and corporate credits. China’s recent commitments to fiscal and monetary stimulus are a welcome counterpoint to the falling monetary aggregates, surging rates and yields, and fiscal consolidation in the US.
The US has long exhausted its policy options. M2 money supply growth peaked more than a year ago at 27% y/y, which was even higher than the peak of around 24% y/y during World War 2. The fiscal deficit peaked at 15% of GDP in 2020 – the highest since World War 2. Meanwhile, zero Fed rate continued through the pandemic, even as inflation surged – indeed, it was held around zero until headline inflation hit 8.5%.
US pays back for spending borrowed from the future. The party is over. In many senses of the word, debt-driven expansion is growth borrowed from the future. While financial engineering can borrow demand from the future, the supply of goods and services is tied to the present, and that imbalance stoked inflation in the US. So now, the Fed rate is rising rapidly; the market is spooked by how much it may have to go up by to control such a red-hot inflation rate; money supply is turning down; the fiscal deficit is being reined in; and the US economy is staring down the abyss of a likely recession in 6 to 12 months.
US recession looms. We have been saying for some time that a US recession is a high probability risk. A “soft-landing” is a low probability event – likely the product of external supply factors and very good luck rather than anything within the control of US policy makers. Put simply, there is no precedent in post-war history of the US avoiding a recession when bringing down significant inflation, let alone a rate which is the highest since 1980.
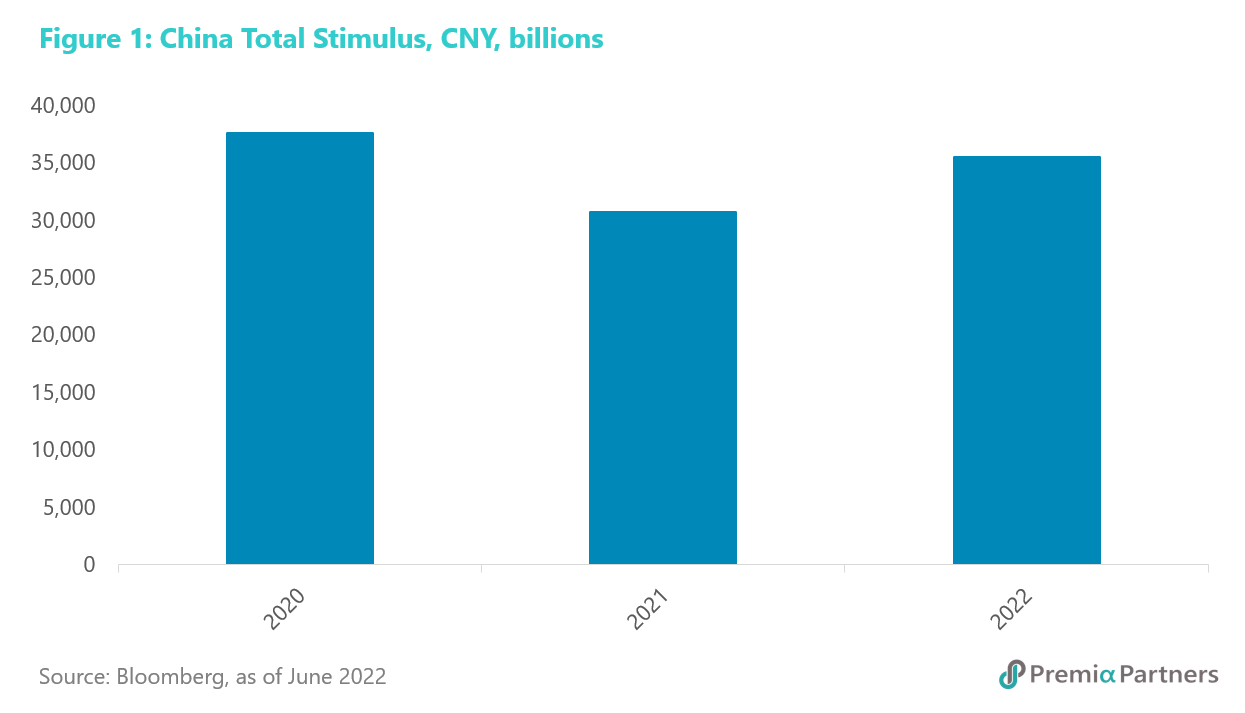
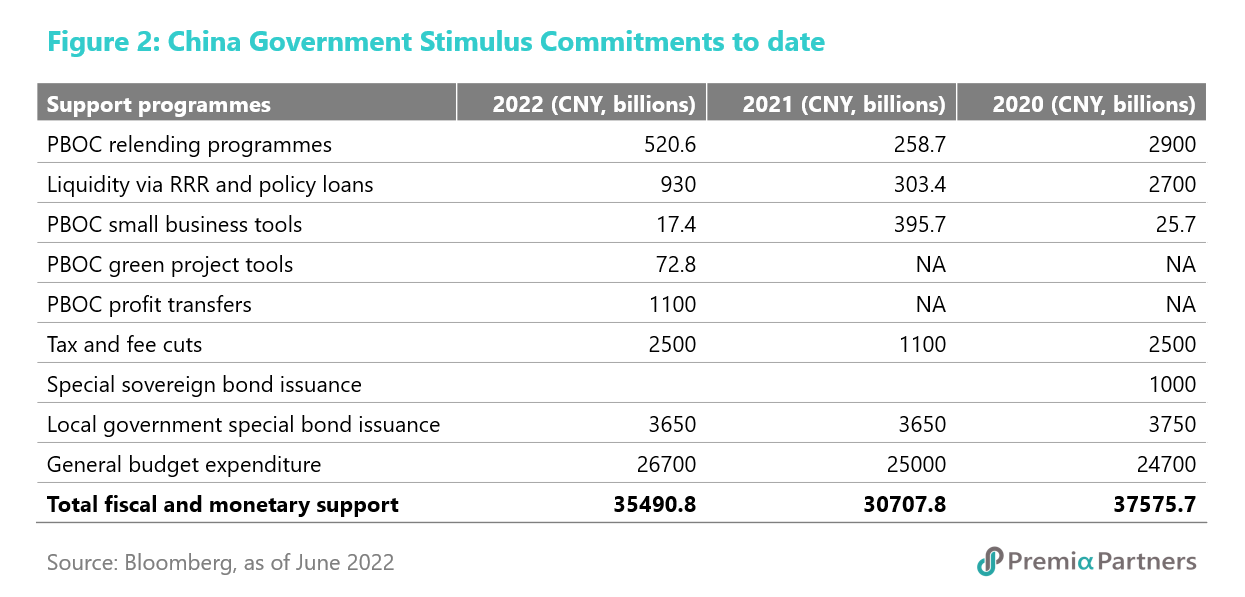
China is now easing as the US is tightening. There had been a raft of stimulus announcements from Chinese policy makers over recent months. Owing to their piecemeal nature – released progressively over time rather than as a “big bang” statement – the market seems to have paid relatively little attention to them. Yet, it’s mounting up and the market is starting to sit up. Bloomberg recently estimated the value of Chinese policy makers’ fiscal and monetary policy commitments for the year-to-date at CNY 35.5 trillion, compared to CNY 30.7 trillion for 2021. For a year-to-date total, it is already closing in on the CNY 37.5 trillion in 2020.
Similarly, China’s modest path of rate cuts – 15 basis points off the 1-year Loan Prime rate (LPR) over the last six months, and 130 basis points off the Reserve Requirement Ratio over the past 12 months – have been ignored by a market that had become used to big policy moves in the US. But as we are seeing now in the US, big policy moves cut both ways, with markets now rattled by big Fed policy rate hikes.
As a result of its cautious approach, the People’s Bank of China still has 8.1% in its RRR (the US is at zero, even as the Treasury 10Y minus 2Y spread warns of recession ahead). Also, the PBOC still has 3.7% in the 1-year LPR.
What appears to have finally sunk in with investors now is the big picture – China still has considerable policy ammunition and is at the start of an easing cycle while the US is at the start of a tightening cycle.
So, these are the big three things going for Chinese equities now. 1) Policy stimulus has arrived, to avoid further slowing of economic growth; 2) the regulatory blitz against online platform companies appears to have passed its peak, with policy makers speaking of “normalisation” of the regulatory environment; 3) valuations have been beaten down, suggesting a lot of the negatives may have already been priced in.
Chinese equities valuations are at cyclical lows. The Shanghai Composite Index is currently trading at a forward PE ratio of around 11x, bouncing off the recent low of around 10x about a month ago. Its cyclical lows were around 10x in March 2020; 9x in January 2019; 11x in February 2016; 8x in May 2014; and 12x in October 2008.
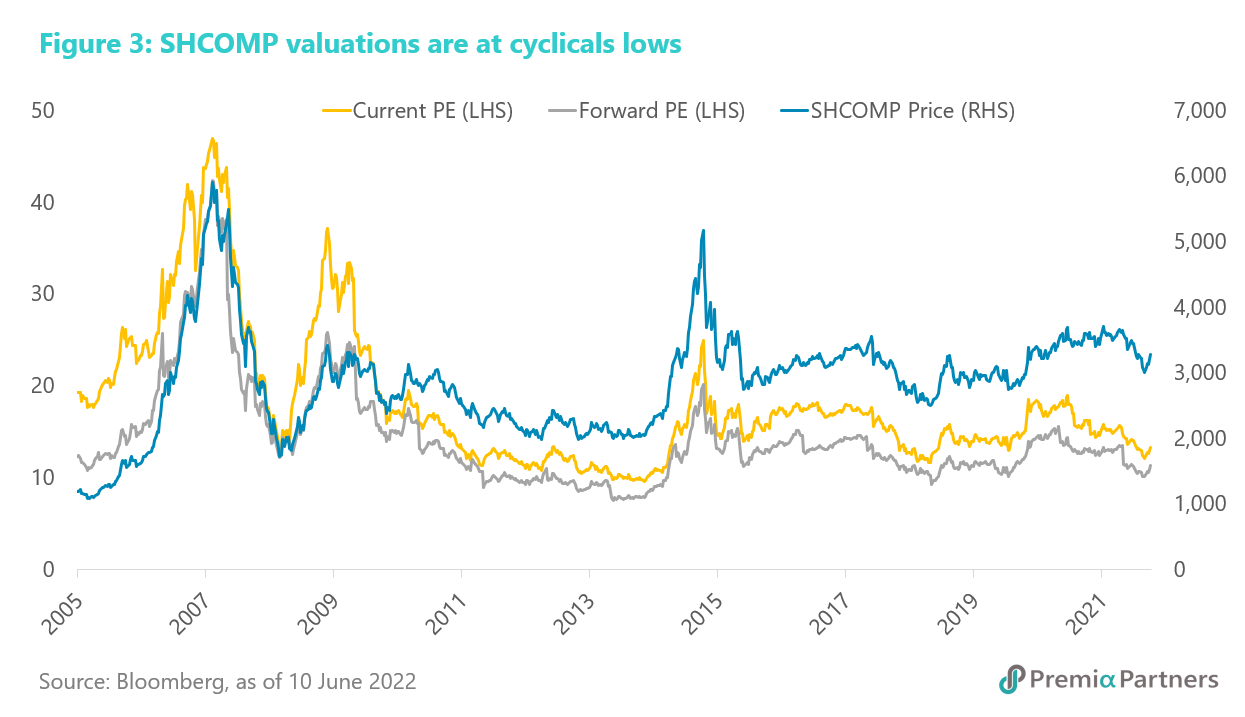
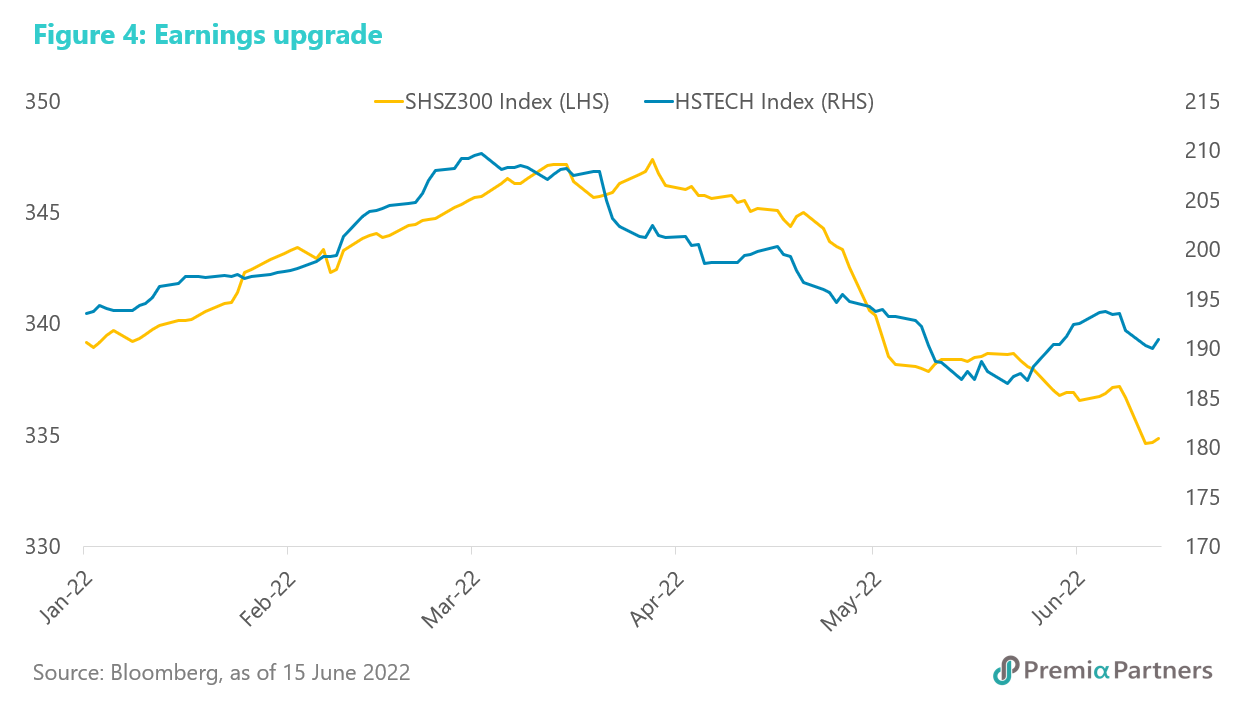
Note also that analysts have started upgrading earnings estimates for the Hang Seng Tech Index. With a more supportive macroeconomic backdrop likely to follow from the stimulus measures already announced, earnings upgrades for CSI 300 companies are also a reasonable expectation.
The relative valuation argument for Chinese stocks vis-a-vis US equities is even more compelling. The S&P 500’s forward PE was around 18x at the time of writing, and that is based on a slim 9% full-year index-earnings growth estimate that could be at risk of downgrades as the economy slows on interest rate hikes. Indeed, that forward PE ratio is deflating rapidly – with the likelihood of further valuation de-rating ahead. Its PE ratios at cyclical lows were 14x in March 2020; 11x in November 2008-March 2009; 15x in March 2003; and 13x in January 1995.
There is hardly anywhere in the Developed Markets for funds seeking refuge. US corporate credits’ mark-to-market values are also getting smashed along with equities. For example, the iShares iBoxx $ Investment Grade Corporate Bond ETF is now down almost 18% year-to-date. European stocks are also in bear market, as the European Central Bank prepares for its first rate hike (in more than a decade) next month. While the Nikkei 225 has outperformed the US and European markets (albeit still down 15% from its November 2021 high), that outperformance has been driven to a large extent by massive Yen devaluation, taking the USDJPY from 115 at the start of the year to 135 now. However, beyond currency losses, the Bank of Japan is struggling in a desperate battle to hold down the yield on the 10Y JGB. If it loses this battle, it could plunge the country into a financial crisis, taking down almost all asset values.
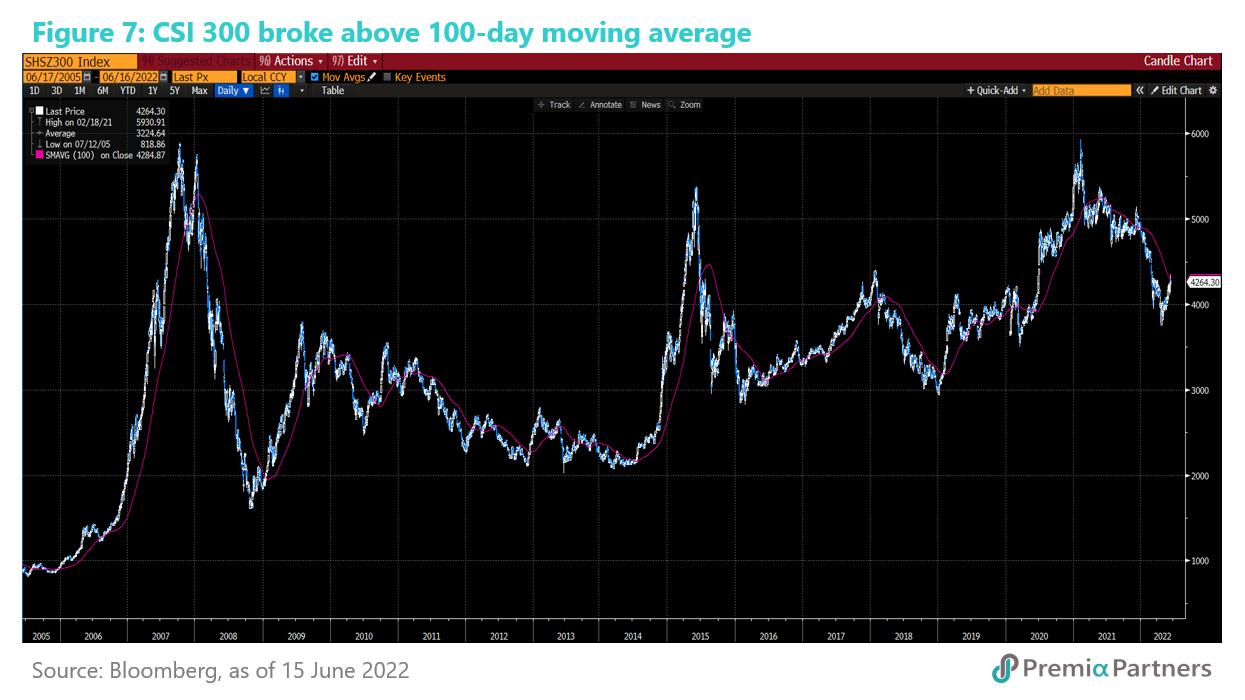
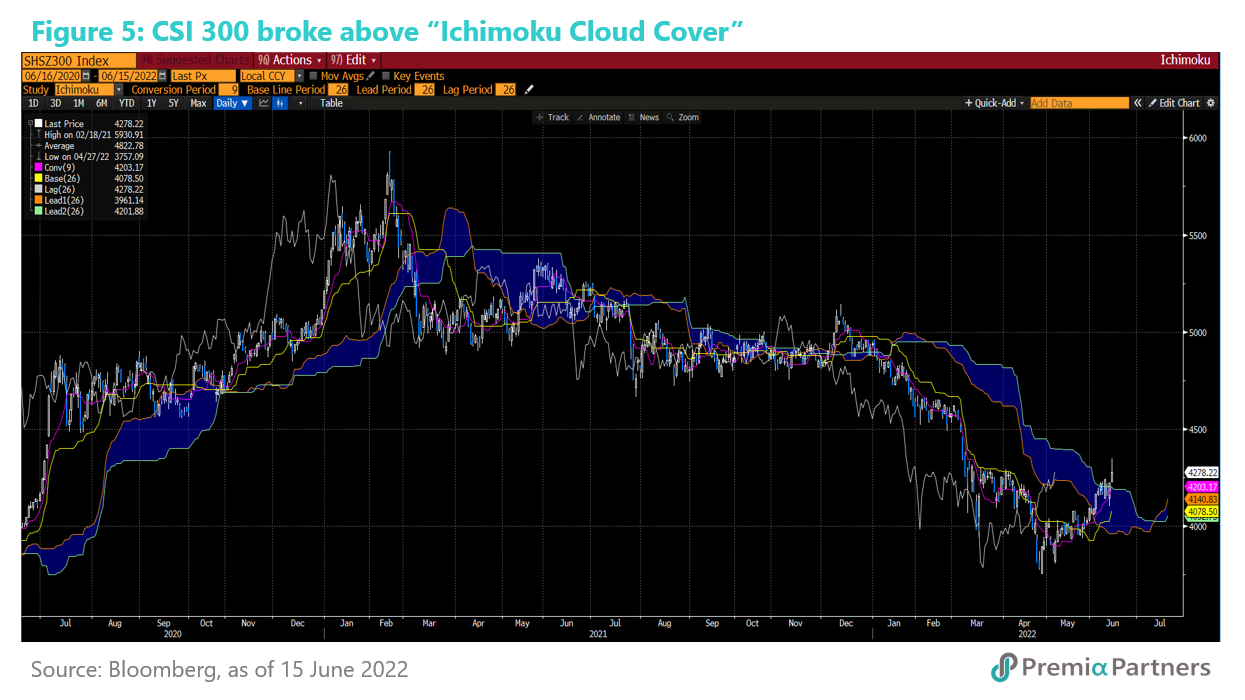
All of these helps explain Chinese equities breaking out above technical resistances while Developed Market equities are breaking down. In the week of 13 June, when the S&P 500 collapsed below technical supports into bear market, the CSI 300 popped above its “Ichimoku Cloud” technical resistance.
About two weeks before that, the index broke above its downtrend from December.
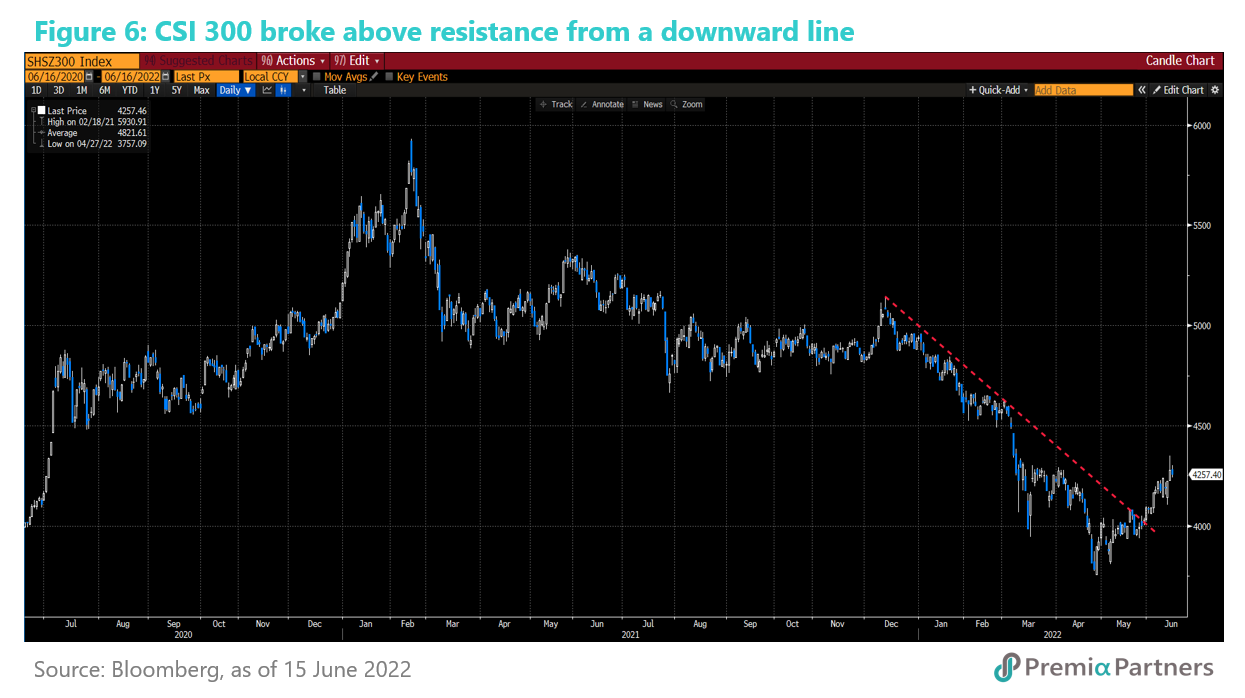
It is now testing its 100-day moving average. Watch this: It often takes a few attempts before even a bullish index breaks above this resistance. But for CSI 300, breaks above the 100-day moving average has a tendency to be followed by quite substantial periods of gains.