
A new equities downtrend is likely to have started and the coming months will be treacherous to navigate. They will be marked by violent swings, driven in turn by fear of recession and renewed monetary easing. Yet ultimately, markets are likely to see lower lows, driven by the likely failure of policy makers to nullify economic and market cycles.
If the above conclusions are right, investors might want to: 1) maintain an overall short bias. But this will require highly tactical and technically driven trading, given likely two-way volatility. 2) otherwise, be in alternative assets such as hedge funds with low or even negative correlations with global equities. 3) related to that, consider market neutral, long-short strategies – short the beta and long specific alpha opportunities. 4) park cash in low risk asset such as US Treasuries while awaiting better valuations. 5) pick up low valuation Chinese equities, on the dips, for long-term core holdings, with the expectation that the Shanghai Composite’s underperformance against the S&P 500 might have bottomed and could mean revert up over coming months. 6) buy gold on renewed monetary easing.
Why equities are likely to be lower over 12 months. As written earlier this month, the global economy is slowing. Lagging economic data may point to continued growth but forward-looking indicators speak of an exhausting of a cycle that had been extended by force feeding cheap money.
For example, instead of celebrating low initial jobless claims, the market should have been worried about the cyclical lows in unemployment from which recessions emerge. Over the past 60 years, US unemployment has not been able to break significantly and sustainably below 4%. This has historically been the level at which US unemployment troughs and that bottoming of unemployment is typically followed by recession.
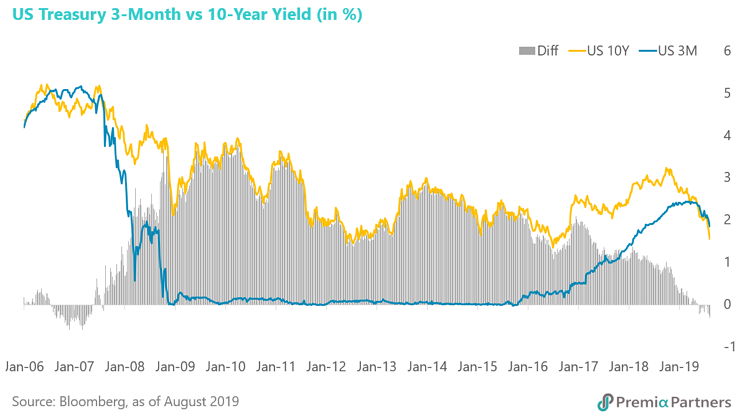
Meanwhile, the spread between the 10-year US Treasury yield and the 3-month yield is now negative. That is, the yield curve has inverted. The New York Federal Reserve in June assigned a 32.88% probability of a recession by June next year. And that was where we were around August of 2007, just before the start of the Great Recession. While equities were sold off furiously on 14 August when the 2-year/10-year inverted, this should not have been all that surprising. It’s just another part of the US Treasury yield curve to invert.
Likewise, although lagging GDP data showed Japan is still growing, investors have bought the 10-year JGB yield below the Bank of Japan’s preferred range of 0.2% to -0.2%. It is now doing -0.24%. As a result, there has been over recent weeks a flattening of the 2-year/10-year part of the JGB yield curve. The market would have noted that private consumption – which is around 60% of the GDP – was boosted by the extended Golden Week holiday to mark the “Reiwa” Imperial succession. Private consumption could also be supported in coming months ahead of the October consumption tax increase.
Yet exports have been falling. In Japan, where exports go, so (eventually) goes the GDP – hence the relationship between the USD/JPY and the Nikkei 225.
Germany’s GDP has started contracting, declining 0.1% q/q in 2Q19. Euro area GDP growth – already weak at 0.2% q/q – cannot be far from negative territory either.
By the way, the focus on whether these economies experience a technical definition of a recession or “only” suffer from a flattening of growth may be missing an important point. Valuations in developed markets are so high --- they are priced for perfection. A flattening of economic growth and declining corporate earnings are likely to be enough to take the wind out of risk assets.
Expect counter-trend bounces. Two-way volatility will emerge when central banks eventually bring out the so-called monetary “bazookas”. Central bankers will likely capitulate sooner rather than later when the market correction starts turning into a rout. They have banked so much on the wealth effect of asset markets keeping consumer spending up and therefore are unlikely to have any qualms about taking sides in the market. They will continue to favour longs over shorts; borrowers over savers. That is likely to have some positive impact on asset prices, particularly if done in tandem with substantial fiscal stimulus.
Why the bounces are unlikely to last. The problem with the idea that governments can just print money to finance their spending is that, it has been tried many times in the past, with disastrous consequences. Think Zimbabwe, the Weimar Republic, Venezuela, or the Japanese “banana money” used in what is now Malaysia and Singapore during the second world war.
Related to the twin “bazookas” of monetary and fiscal expansion, there is an old argument that governments should spend more – run deficits – to make up for private sector over-saving and inadequate investment. That is based on the equation “government deficits equal private sector net savings”, or G-T = S-I, where government spending minus taxation equals savings minus investment.
By definition, over time, if governments boost spending and cut taxation, that is lift their deficits, that is likely to be offset by either an increase in savings or a decline in investment. That’s the so-called “crowding out effect”. That would occur through higher interest rates, encouraging more private sector savings, or less investment, or both. Of course, that’s the theoretical dynamic in a closed economy. Yet, in an open economy, net inflows of foreign capital also increase. Some of the income created by those net inflows of foreign capital is returned to those foreign investors in either dividends or coupon payments. So, over the long run, the net impact will still be lower national savings and domestic investments. And this in turn results in higher interest rates, a smaller capital stock and lower output.
The idea that governments can spend more, depress interest rates, depress savings, and then lift investment is fanciful. This is the “magic pudding” of that children’s book of the same name, which speaks of a magic pudding which, no matter how much is eaten, always makes itself whole again.
The biggest risk is not that it won’t work. It may work, for short periods of time – but long enough to distort allocation of resources, building bubbles that eventually explode with devastating consequences.
Holding gold amidst negative rates and yields. Logically, negative deposit rates at banks and negative yielding bonds are unsustainable. If I have to pay money to lend money to a bank, I will be tempted to hide my money in a safe. Or put it into gold, which used to be thought unattractive because it was not an income earning asset like, say, bonds.
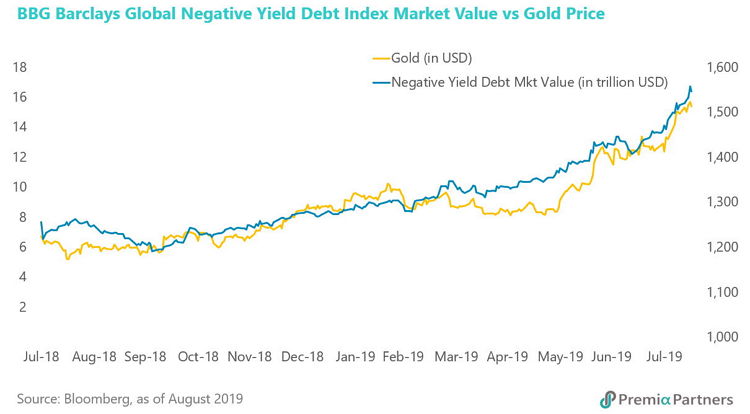
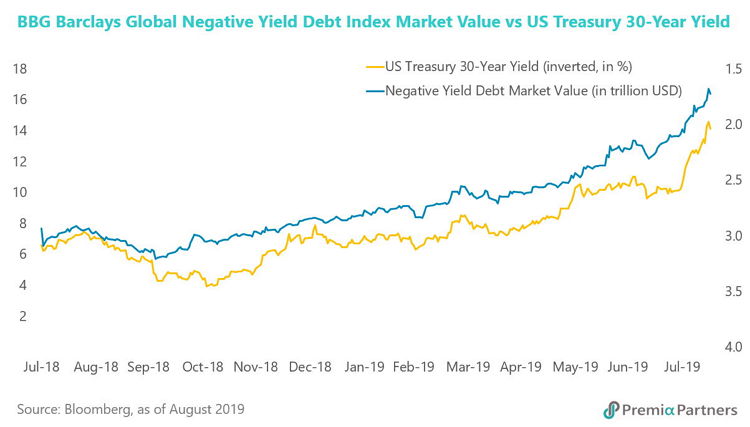
But now, the amount of negative yielding bonds is mounting by the day – US$16 trillion at last count, from $13.6 trillion late July, and $5.9 trillion October last year. Nearly one-third of tradeable bonds in the world now guarantee a loss in the coupon. Indeed, there are strong correlations between gold and the market value of negative yielding bonds tracked by the Bloomberg Barclays Global Negative Yielding Debt Index and the inverse of the 30-year US Treasury yield.
This suggests gold will continue to track upwards if fear of recession and more central bank intervention grows.
Keep your powder dry – there will be better buying days ahead. After the sugar-hit of more policy interventions wears off, risk assets are likely to resume their downtrend, likely opening better buying opportunities. The problem now of course is that cash in key financial centres is a zero or near zero interest rate proposition. US Treasuries are a useful temporary parking spot, given it is one of the very few developed market government securities still paying a positive yield, and at very low risk. Indeed, demand for US Treasuries is likely increased as equities volatility and risk aversion resume.
Seek low correlations. The problem with hedge funds is that most have high correlations to global equities. January 1990-July 2017 data suggests only global macro, equity market neutral and short bias strategies offer low to negative correlations with global equities.
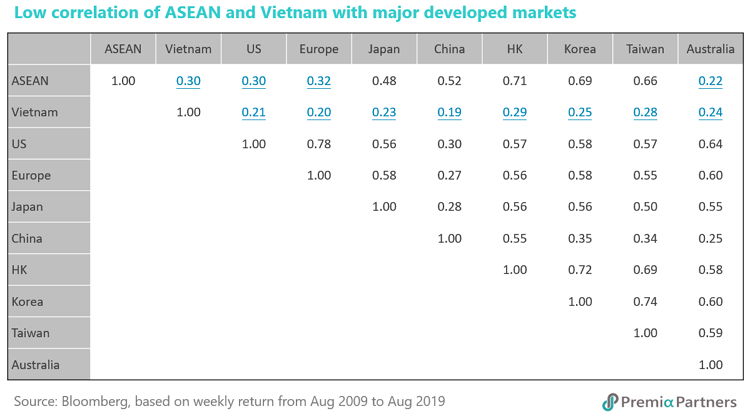
Within equities, the Dow Jones Emerging ASEAN Titans 100 Index offers low correlations to major developed markets such as 0.3 with the S&P 500 and 0.32 with Europe Stoxx 50 based on the weekly return in the past 10 years. The MSCI Vietnam Index offers even lower correlations to major developed markets and regional markets at values ranging from 0.2 to 0.3. Vietnam is also a potential beneficiary of the realignment of supply chains in the wake of the US-China trade conflict. https://www.premia-partners.com/insight/trading-blocs
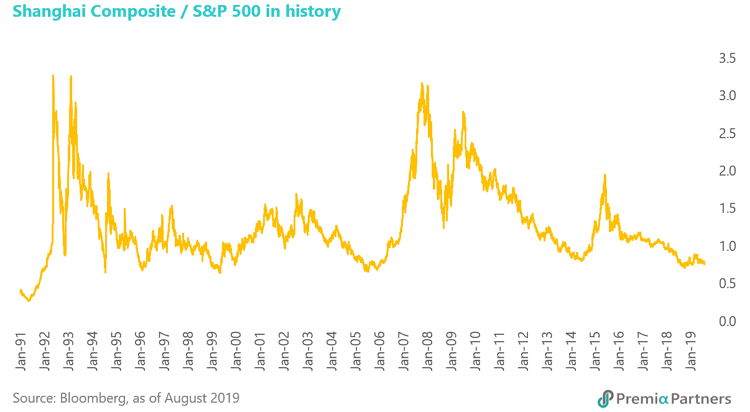
China as a long-term value play. There has been a cyclicality in the Shanghai Composite’s relative performance against the S&P 500 over recent years. That relative performance appears to have troughed against the S&P 500 recently, with the possibility of it reverting upwards. On fundamentals, it could benefit from lower valuations vis-à-vis the developed markets and more fiscal and monetary policy ammunition than developed markets. https://www.premia-partners.com/insight/the-chinese-economy-s-5-biggest-myths
China’s total market capitalisation is around 40 per cent of GDP (versus around 130% for the US). The Shiller CAPE ratio for the Shanghai Composite is around 17x (versus around 30x for the S&P 500).
And even with 25 per cent tariffs on all its exports to the US – assuming a resultant loss of 160-170 basis points of nominal GDP growth – China will still exceed the US economically, in US dollar terms, by the early 2030s. Those tariffs will slow that inevitability, but by only a few years, and that growth will likely be overwhelmingly driven by consumption, rather than by investments and net exports, as in the past.
Assuming a moderate shift in the household consumption expenditure share of GDP from 40 per cent to 45 per cent by 2030, China’s consumer market would have grown from US$5.3 trillion to more than US$12 trillion.
These are still early days in China’s adjustment to the United States’ curbs on China’s access to American technology. But there is likely to be much greater focus in China on technology to drive GDP growth. China is exhausting credit intensive-driven growth. More investment in old economy industrials will only worsen excess capacity and productivity growth. And it can also no longer depend on demographics, given its declining fertility rate.
S&P Global was speaking the obvious when it recently wrote that China would have to focus on technology to drive productivity and GDP growth in the future. It says China has already started doing so.
“Some estimates suggest that China's tech-driven "new economy" has expanded about twice as fast as the overall economy over the past decade, and created 20 times the number of jobs than traditional sectors,” says a recent S&P Global report.
Over the past 10 years, technology industries (including electric machinery, computer, communication and other electronic equipment) “have grown about 2 percentage points (ppts) faster than overall output. That gap has risen to 5ppts more recently. Also, the new GDP measure of information technology services increased by an average of over 20% per year between 2015 and 2017,” it says.
But to be clear, investing in Chinese equities at a time of trade conflict with the United States carries significant risk and is – as described by the common expression for China’s economic and geopolitical strategies – a “long game”.
