
Most investors assume that the more liquid the ETF, the easier and cheaper it is to trade. This is true in markets like the US, where on-screen liquidity is prevalent, and investors can easily get trades done via VWAP/LIMIT orders. In many cases, the ETFs trade more than any single stock inside them. When it comes to Asian underlying, particularly China A, the story is quite different. This is because the underlying China A stocks are very liquid and few Asian exposure ETFs are more liquid than the stocks inside them. Some A-shares tickers listed in HK are easier to trade because they have a turnover of 50-100m USD. But easier does not mean cheaper. The pricing is only marginally better and when considering market impact risk (the actual expected cost, rather than ease of leaving the order), the numbers are similar to the less liquid ETFs that take advantage of underlying liquidity. This is because HKEx doesn’t require printing of institutional trades on screen (just like most of Europe).
The Premia Partners ETFs benefit from a strong network of market makers and participating dealers, who utilize underlying stock liquidity to offer aggressive pricing on our ETFs and typically do not print the trade on-screen. Examples of such brokers are GS, BAML, Flow Traders, KGI, Guotai Junan, China Merchants, Haitong, etc.
How much does it actually cost to trade 50m USD?
Below is some data highlighting the efficiency of the market for 2803/3173. Both ETFs are priced at a total expense ratio of 50 bps. That immediately provides savings over the course of the holding period as most HK-listed A-shares ETFs range from 0.8% to 1.1%. On the trading side, most of our clients take one of two approaches:
Trade using end of day NAV: quotes are typically NAV + 20-25 bps to BUY, NAV - 30-35 bps to SELL; roundtrip total is 50-60 bps. Best quote for 50m transaction so far: NAV + 16 bps to BUY, NAV - 24 bps to SELL; roundtrip of only 40 bps. Please note that these are inclusive of commissions, but of course ultimate pricing would depend on the specifics of any future trade.
Trade intra-day: most quotes have been +10-20 bps vs iNAV or current best offer to BUY; -20-30 bps to SELL, roundtrip total is 30-50 bps.
We often get asked if investors can really access this pricing. Just this week we had a 4m sale of 3173.HK done by a client that priced with no issue, despite being materially bigger than the size of the previous quotes. The broker ultimately did a redemption from the ETF via end of day NAV.
Where does this pricing come from?
Remember – an ETF is both a stock and an open-end fund. It can issue and redeem shares on an almost daily basis (except for holidays) and as such market makers can always obtain new shares or collapse them when clients are buying or selling. Importantly, the HKEx doesn’t require printing of trades so most of our clients trade directly with brokers using one of the two pricing methods above and as a result the volume on-screen doesn’t reflect the true trading of ETFs.
Below are 2 charts that show how liquidity works for Premia CSI Caixin China New Economy ETF (3173.HK):
On-screen volume on top and ETF inflow/outflow trades on bottom – there is no relationship between the two portions of the chart – on-screen liquidity and inflows/outflows don’t have much of a relationship so looking at on-screen turnover only tells you part of the story.
Underlying liquidity and ETF capacity – though the ETF itself is only ~550m HKD in assets, the stocks inside it are liquid enough to handle 930M HKD in daily trading. The screenshot is a Bloomberg calculation that identifies the least liquid stocks and calculates the ETFs capacity to handle inflows/outflows.
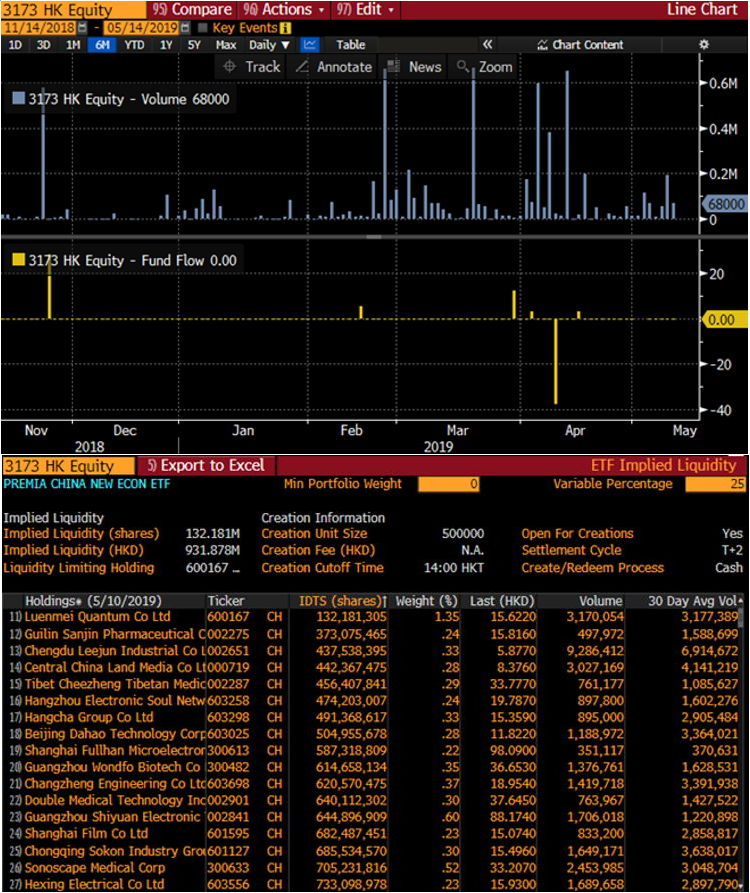
Source : Bloomberg 14/5/2019
Below are the same two charts for Premia CSI Caixin China Bedrock Economy ETF (2803.HK), which has even greater underlying liquidity at 2B HKD.
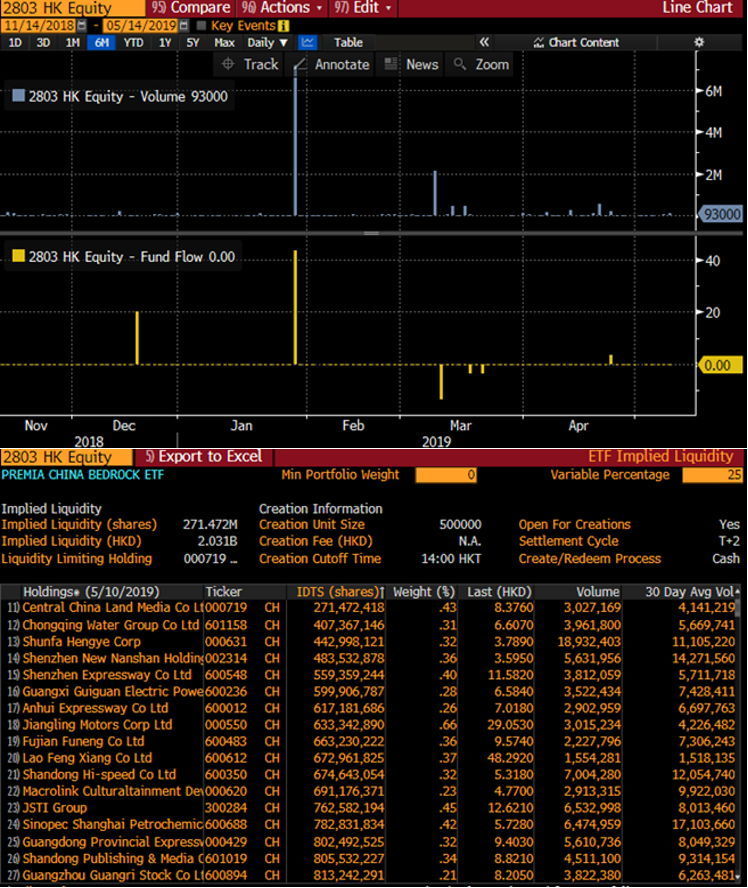
Source : Bloomberg 14/5/2019
How do these stats compare to “more liquid” ETFs?
The NAV and iNAV quotes we mention above are for 50m, which is 10% or less of underlying China A-shares turnover. No wonder the pricing is reasonably tight by EM standards. But surely it’s easier and cheaper to trade the most liquid China A ETF? Leaving aside the difference in exposures, let’s look at Bloomberg estimates for trading ASHR.US and 3188.HK – the two most liquid A-shares ETFs in the US and in HK, respectively.
ASHR.US
A 50m USD trade is 19% of 30D turnover (260m USD) and we can estimate the transaction cost using the Bloomberg Transaction Cost Analysis tool (screenshot below). 50m USD is 1.95m shares and the Bloomberg cost estimates are 90 bps to 160 bps! The range of course depends on how the trade is done – VWAP over 1 day, 5 days, block order right away, etc. The ETF has a much tighter bid/ask, but it’s important to remember that this is for a small retail trade. Larger block trades would require either a longer time to work, incurring market risk, or must lift all quotes immediately, moving the price of ASHR. This is because a trade in ASHR is being done when China A is closed and as such the limit for trading is only 260m USD. The immediate limit to liquidity is the 260m USD in ASHR turnover, not the entirety of the China A-shares market. In reality, of course, market makers would simply do a creation (issuance of new ETF shares) in the underlying China A market the next day, which is exactly what happens with Premia ETFs for the same size trades. The only difference is that our ETFs are listed in the same time zone as China A, potentially making execution same day. In addition, ASHR.US has a total expense ratio of 0.65% and results in US withholding and inheritance taxes, making the ETF much more expensive than 2803 or 3173 for non-US investors.
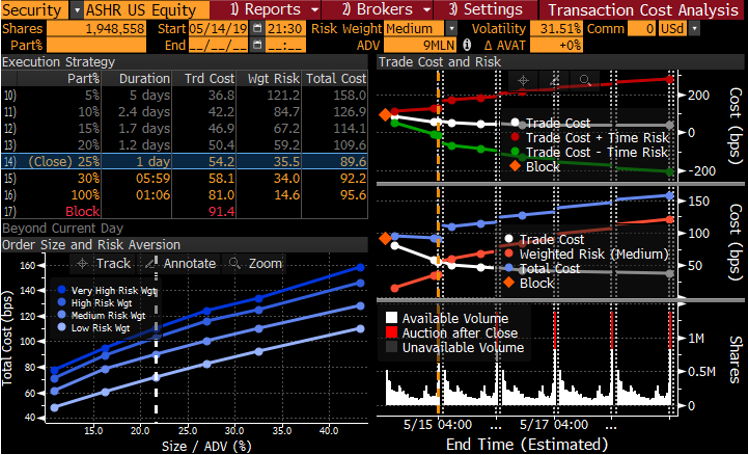
Source : Bloomberg 14/5/2019
3188.HK
A 50m USD trade is 27% of 30D turnover (183m USD) and the same Bloomberg estimate shows that 50m USD will cost 140-208 bps! The story here is similar – though the total turnover is ~180m USD, limiting a trade to on-screen liquidity only results in poorer execution than utilizing the underlying liquidity. Like ASHR and our ETFs, market makers would of course recommend that underlying liquidity is used and therefore the trade will be cheaper. But it is unlikely to be cheaper than our ETFs given the source of underlying liquidity is the same – A-shares. Unlike ASHR.US, 3188.HK does not result in US taxes. However, it still has a total expense ratio of 83 bps, which is more expensive than our 50 bps.
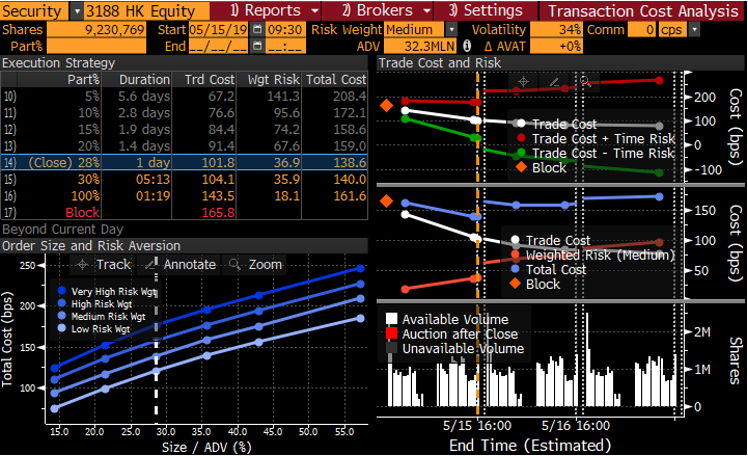
Source : Bloomberg 1/5/2019
That’s our detailed look at China A ETF liquidity – the underlying is hyper liquid, similar to US equities, but the ETFs are not. As a result, the ETFs are more expensive and not as straightforward to trade – they are more expensive than the underlying stocks. Premia ETFs offer access to key parts of the A-shares universe and have enough capacity via underlying liquidity for 50-100m trades to be done easily at low cost. ETFs that are more liquid on-screen are perhaps easier to trade, but they are not necessarily cheaper to trade. And they definitely cost more in terms of total expense ratio!
Related Tickers:
Premia CSI Caixin China Bedrock Economy ETF: 2803.HK
Premia CSI Caixin China New Economy ETF: 3173.HK
