
“Gimme Shelter” Part 1: What’s driving the demand for Chinese Government Bonds?
Index provider FTSE Russell will add Chinese Government Bonds (CGBs) to the FTSE World Government Bond Index (WGBI) over three years from the end of October – a move that is expected to draw billions of Dollars of new portfolio inflows. Already, there has been a sharp increase in foreign inflows into RMB bonds over the past 12 months, accelerating soon after the start of the pandemic. In this 2-part series, our Senior Advisor Say Boon Lim highlights the drivers for new demand for CGBs and the reasons to own them.
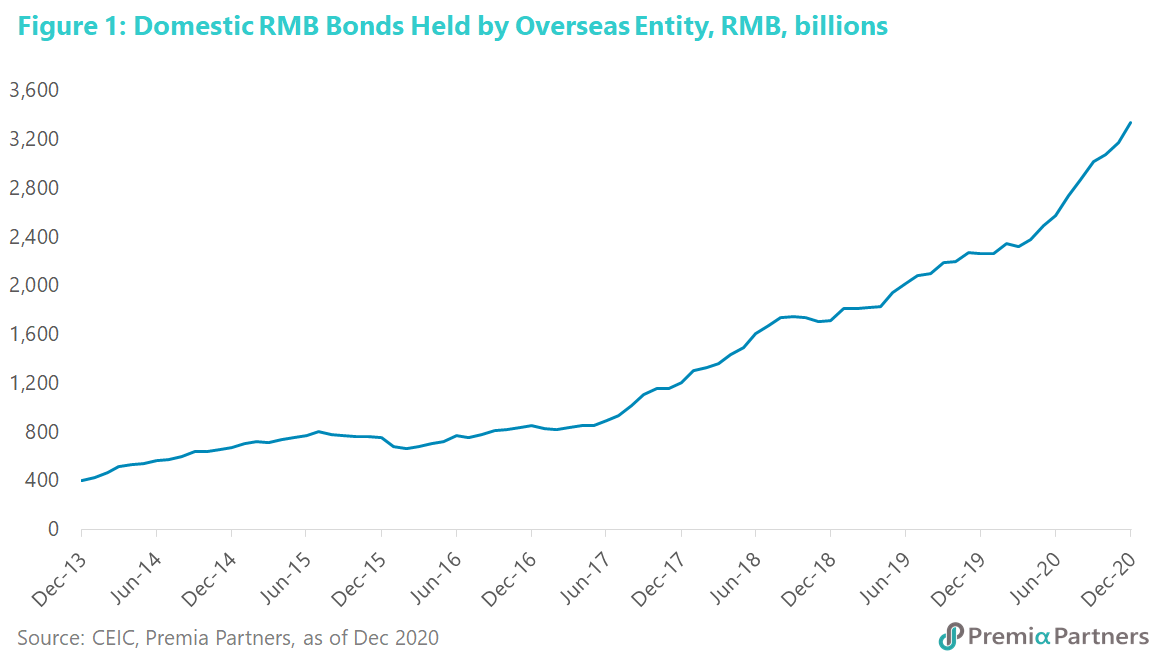
There has been a massive surge of buying interest in Chinese bonds since March of last year – coinciding with the rapid spread of COVID-19 around the world. A lot of that interest has been in Chinese Government Bonds (CGBs).
In the 12 months to end-2020, foreign holdings of RMB bonds surged 47%, with the pace picking up from April. This is an acceleration of the accumulation of Chinese bonds from the previous year, which recorded 32% growth in the 12 months to end-2019 (figure 1).
The pandemic and the “funny money” storm. The acceleration of the accumulation of RMB bonds from 2Q20 looks like a reaction to two related global developments: Developed Markets failed to suppress the virus and therefore sought to mitigate its economic impact with aggressive monetary expansion and financial repression. China suppressed the virus effectively and did not need to engage in either aggressive monetary expansion nor financial repression.
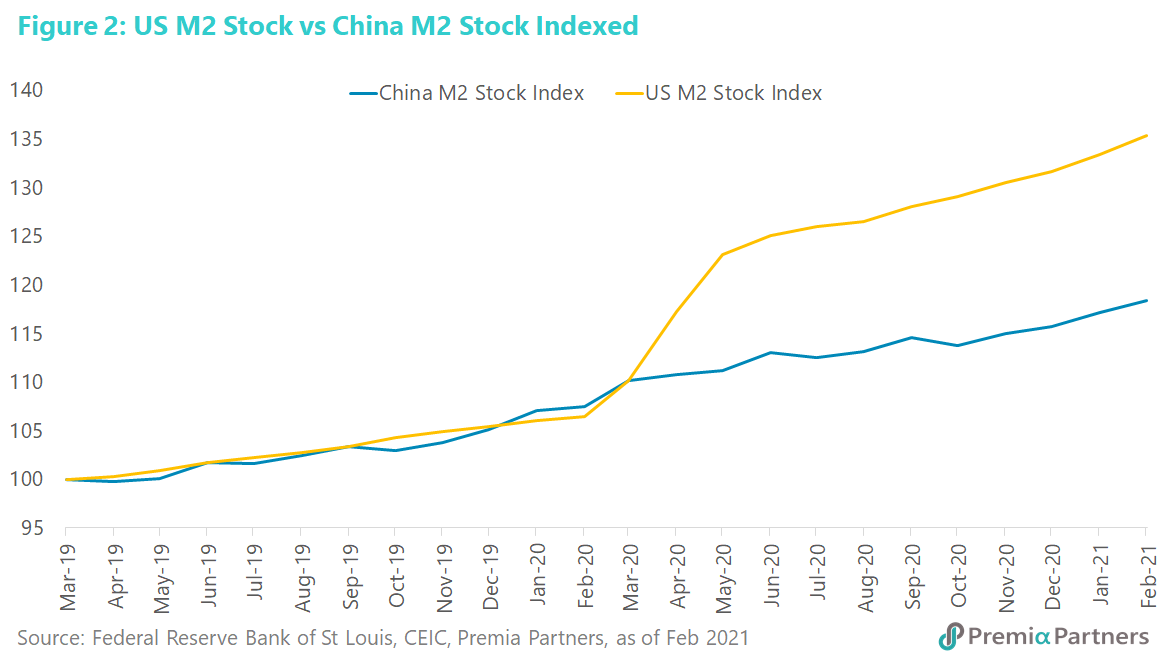
China’s M2 money stock growth pretty much tracked US M2 growth in the 12 months to March 2020. Nevertheless, as the pandemic ran out of control in the United States, US M2 money stock also ran amuck, greatly outpacing China’s M2 growth (figure 2).
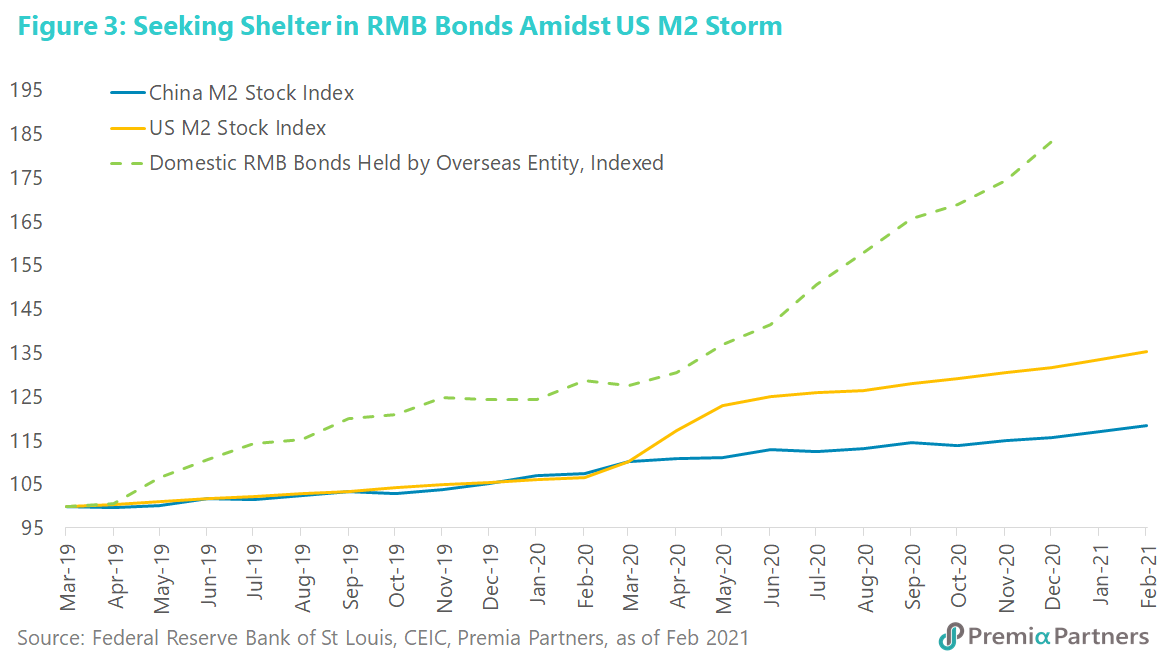
Equities loved it but bond investors hated it. The market’s reaction to the Federal Reserve’s actions was swift, driving a surge in demand for RMB bonds (figure 3). This gives a new twist to the lyrics of that 1969 Rolling Stones’ rock classic: “Gimme shelter……mad bull lost its way.”
12-months later – from monetary debasement and Dollar decline to fear of inflation. The past 12 months has seen unprecedented US M2 money supply growth – “unprecedented” as in unseen in recorded history. US M2 money supply stock grew 27% y/y in February 2021 over February 2020. This surpassed the previous peak of M2 growth of 24% y/y in 1943, in the midst of the Second World War.
In rapid response to this monetary debasement, the US Dollar declined 13% from its March 2020 high to its January 2021 low.
First came the glut. The Federal Reserve “printed” money freely and splashed the newly minted Dollars around the world through purchases of US Treasuries and US Dollar swap lines with other central banks. Next came the fear. Investors anticipating more US Dollar printing – and they were right – fled the Greenback, driving up the Euro, the Aussie and the Renminbi, among others.
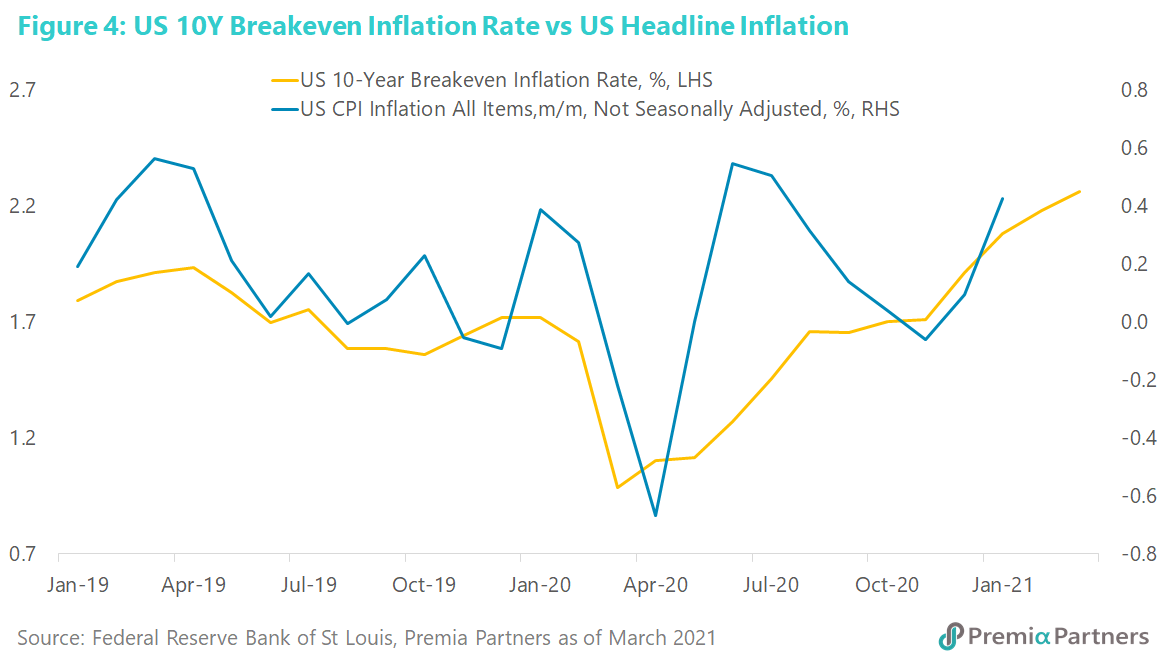
We have entered a new phase of fear – that is, fear of rising inflation and rates. The US 10-year breakeven inflation rate (a measure of the market’s inflation expectation) has been running up relentlessly from March 2020 – yes, in tandem with the decline in the US Dollar Index DXY and the surge into RMB bonds (figure 4). Actual inflation is on the rise again, after turning down in 3Q2020 as the pandemic locked up much of US consumer demand. With the vaccine rolling out in the US, and the 21% build up in US bank deposits in the 12 months to mid-March 2021, the velocity of M2 money should pick up off historical lows of 1.1. With that, headline inflation should rise, likely followed by core inflation.
Historically, surges in US M2 money supply have been followed by spikes in US inflation. The relationship is a lagged one –inflation tends to follow anywhere between 12-36 months after the rise in M2 money supply. That relationship broke down from the 1980s. Since then, cycles in M2 growth came and went, with inflation staying relatively tame. Yet, the market would have noted that we have never seen money supply expansion of this scale – ever. Investors are asking themselves: “How lucky do we feel?”
At the start of World War 2, the US had zero inflation. By 1943 – when M2 growth peaked at around 24% - US inflation hit 3%. By the end of the war, in 1946, US inflation hit 18%. US M2 money supply growth has already exceeded the peak of World War 2, and it doesn’t look like backing off any time soon.
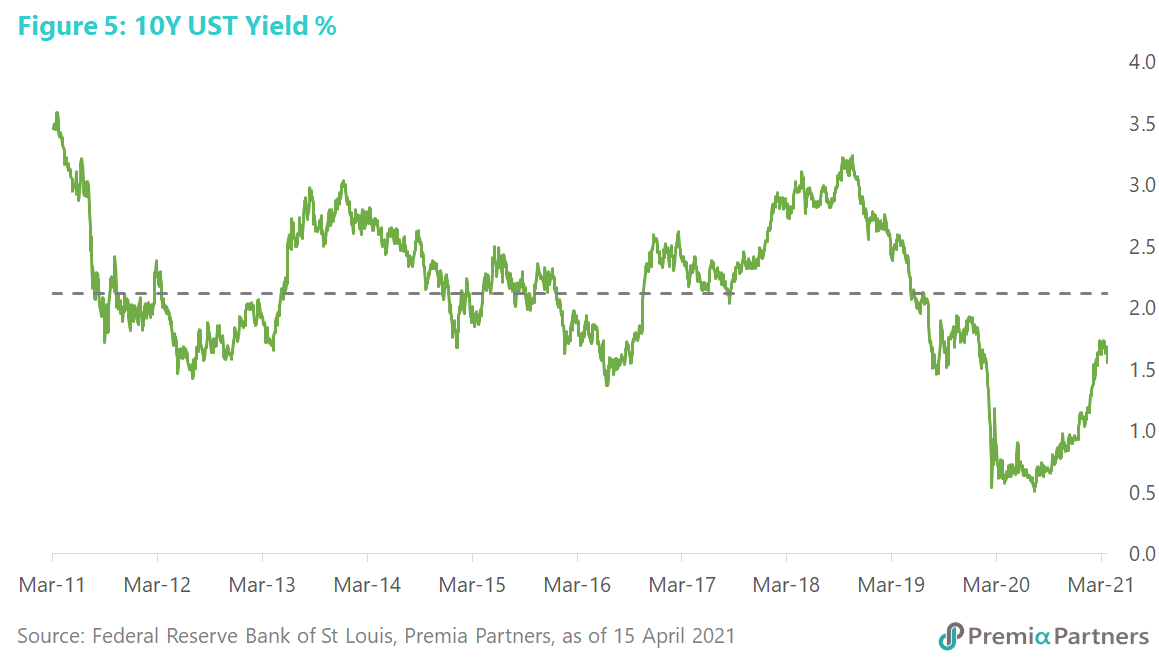
In search of sanity in face of rotten deals. Here’s the deal for US Treasury holders: They are getting paid ~1.6% (as in April 16) per year to lend money to the US Government for 10 years when US inflation is currently running at 2.6% per year. Meanwhile, the US Dollar had declined 8.5% over the one year to April 16. The 10-year US Treasury yield had risen from 0.6% at its low April last year to over 1.6%, and looks likely to head higher to overshoot its 10-year mean of 2.10%. If history repeats, it could overshoot to 3% as part of a mean reversion process (figure 5). Meanwhile, the 10-Year US Breakeven Inflation Rate is running at 2.34%.
For the US Government, it’s a case of “heads I win, tails you lose”. If the US economy remains mired in deflation, it borrows more and more money from US Treasury investors, paying them “peanuts”. If the US economy heads into higher inflation, Treasury bond holders get the proverbial (and almost literal) “hiding for nothing.” How does that seem like a good deal?
US Treasury Bonds’ illusion of safety. For starters, with rates at zero and yields so low, the risk of them moving higher vastly outweighs the risk of them moving lower. Indeed, where else can US rates go but up, since the Fed has already expressed reluctance on negative rates? So, the illusion of safety belies the mark-to-market risk.
Now, note there is currently over US$21 trillion in outstanding US Treasury securities in public hands. This is the entire GDP of the United States. About a third of that is in foreign hands. Debt that big was never meant to be repaid. It’s rolled over or new buyers have to be found. As Ray Dalio, Co-Chairman of Bridgewater Associates recently said: “Holders of these debt assets will either hold them until maturity and endure the….terrible returns or sell them.
“The problem is that, at current valuations, there is way too much money in these financial assets for it to be a realistic expectation that any significant percentage of that bond money can be turned into cash and exchanged for goods and services. If any significant amount tried to make that shift a “run on the bank”-type dynamic would ensue.”
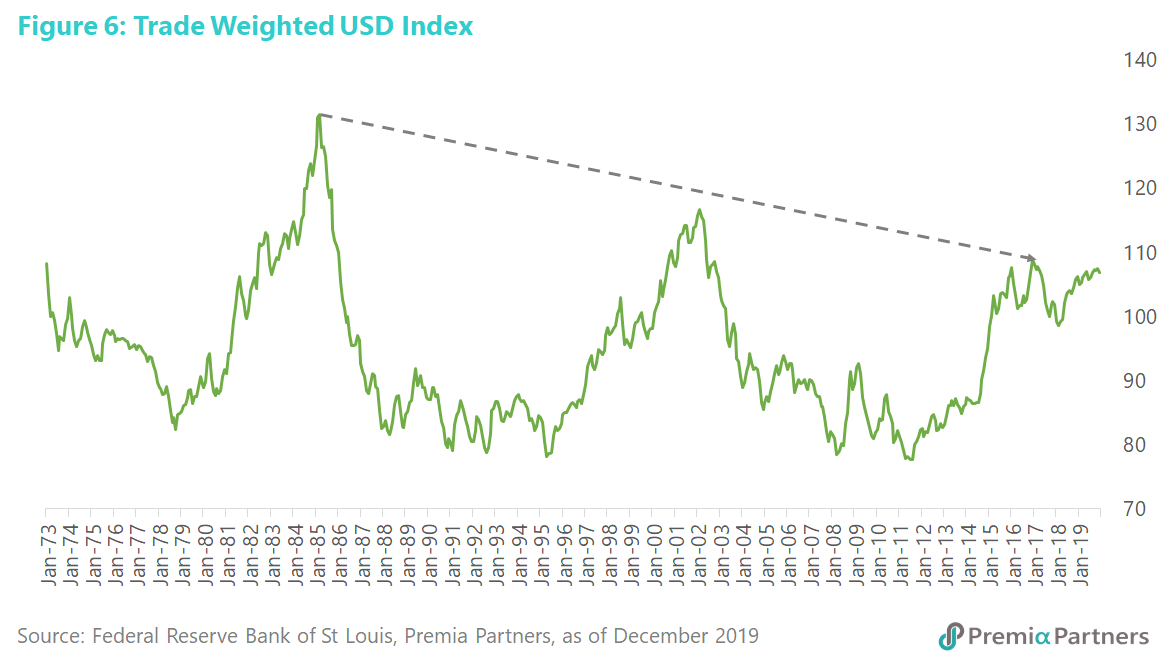
Then there is the value of the US Dollar, which has – over the past half a century – seen a series of lower highs, as at the peaks of March 1985, February 2002 and January 2007 (figure 6).
“Gimme Shelter” Part 2: Why Chinese Government Bonds?
Reason #1 – it’s about income, remember? Once upon a time, before QE, QQE, QE Infinity and YCC, there was “fixed income”, which was for (to state what should be obvious) income. But what sort of income are investors getting now at 1.6% yield and 1.7% inflation? Negative real income.
Amidst the surge in US monetary expansion last year, bond investors started looking for alternatives to this US Fed-enforced yield starvation. As China was getting back to business, after suppressing the virus, the yield spread between the 10-year China Government Bond and the 10-year US Treasury hit an all time high of over 250 basis points (figure 7). This was a consequence of financial repression by the Fed, while the People’s Bank of China allowed the 10Y CGB yield to find its own level.
However, since December last year, that spread has been narrowing, driven mostly by a surging 10-year UST yield, which was up around 90 basis points from end of November last year to end March this year. That’s terrible for existing holders of USTs.
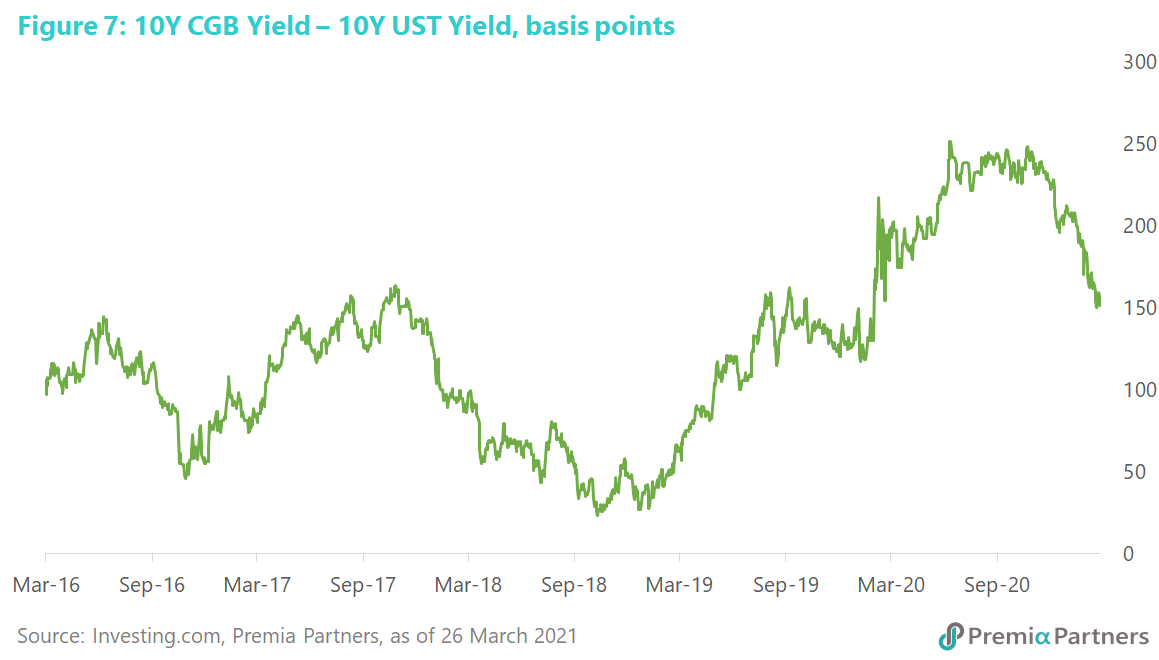
Reason #2 – relative stability. While the 10Y CGB yield has been trading sideways in a 20 basis points range over the past five months, the 10Y UST yield has risen 120 basis points from its August 2020 low to end-March. That stability for CGBs has been underpinned by a calm monetary policy stance.
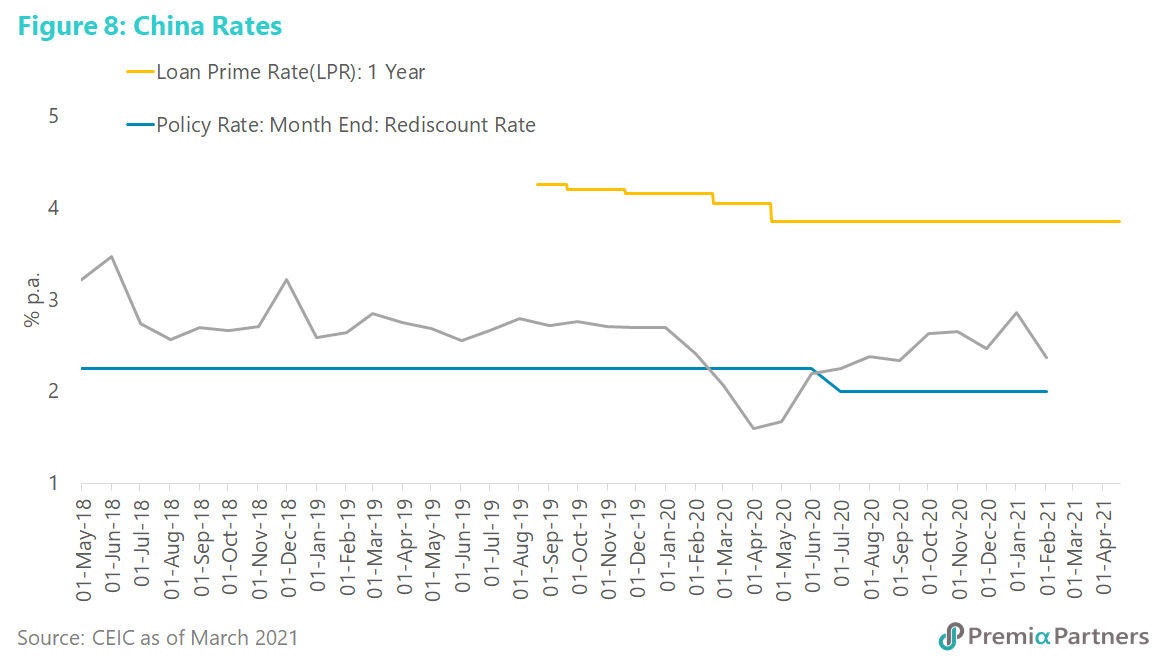
While the Fed cut its target rate 150 basis points to zero in response to the pandemic, the People’s Bank of China cut the 1-year Loan Prime Rate only 30 basis points, and let the 7-day repo rate fall briefly by 110 basis points, but rising back to pre-pandemic levels in recent months (figure 8).
Over the past year, the CNY had gained considerably against the USD, with the CNY now around 9% higher against the US Dollar than at the peak of USDCNY strength in May last year. But of course, there is always two-way currency volatility.
However, even then, we note that the 1-year volatility for the USDCNY has been considerably lower than for other currencies. Last year, the USDCNY 1-year volatility rose to 5% from a very low 2% or less in previous years. We also note MSCI research which pointed out that 1-year volatilities for the major currencies were much higher, ranging from 7% to 11%.
Looking further out, the strength of China’s economy, its recurrent current account surpluses, its conservative monetary and fiscal policies, large foreign exchange reserves, and China’s goal of greater international usage of the Renminbi all augur well for long-term currency appreciation.
Reason #3 – diversification benefits. In a recent report, MSCI suggested that adding Chinese Government Bonds to Developed Market bond portfolios increased yields and reduced risk.
MSCI constructed five hypothetical bond portfolios, where each portfolio maintained an overweight to one specific country or region. Based on its modelling, the projected annualized total risk (as measured by return volatility) of a portfolio tracking the benchmark is 5.4%. Adding a 10% overweight to China in the portfolio reduced the portfolio risk to 5.0%. The portfolio’s total risk would have been 5.3% for an overweight to the U.S. and 5.5% for an overweight to the eurozone.
It said: “Institutional investors may wish to consider the potential diversification provided by adding Chinese government bonds to an existing portfolio.”
We give the last word to Bridgewater Associates Co-Chairman Ray Dalio who recently wrote: “There is now a shifting from US bonds to Chinese bonds going on. Chinese bond holdings held by international investors are rising fast, though they are now only about 6% of allocations in global portfolios.
“This shift is going on because a) global investors are overweighted in US bonds and underweighted in Chinese bonds relative to sensible criteria of what weights should be based on sensible portfolio-weighting processes, such as the relative sizes of their economies, their relative shares of world trade, and the relative sizes of their capital markets, b) Chinese bond and other capital markets investments are growing fast and are increasingly open to foreign investment, c) Chinese bonds offer relatively attractive yields with relatively attractive currency returns because of China’s favorable balance of payments conditions, and d) China’s currency is increasingly being internationalized.
