The Chinese economy continues to normalize across the board at an impressive rate, leading to the strong likelihood of it beating the current Bloomberg consensus GDP estimate growth rate of around 2% for 2020.
This highlights the economic fundamentals underpinning the Chinese equities market’s outperformance this year and supports the case for it continuing to do so.
Purchasing Managers Indices, industrial production, retail sales, fixed asset investment, exports, traffic congestion, rail cargo and consumer spending on services all suggest an economy – indeed society – that has returned to normal in a way not evident in any of the other major economies, all of which point to the likelihood of upward revisions to economic forecasts in coming weeks.
China should beat the consensus, to turn in a full year GDP growth rate of around 2.4% for 2020. Just as China surprised the consensus forecast for 2Q20 – in June, the consensus was for 1.5% y/y GDP growth for 2Q but the figure came out at 3.2% growth y/y – the 3Q figure will likely surprise again on the upside.
In June, the International Monetary Fund forecast full year GDP growth for China at 1%. Then private sector economists dialed up their forecasts for the full year from 1.7% to 1.8% to 2.0%.
On our estimates, barring another major wave of COVID-19, China should comfortably turn in full year GDP growth of around 2.4% for 2020. That’s pretty astounding given the economic impact of the pandemic everywhere else in the world. China would have escaped the technical definition of a recession – that is, it only suffered one quarter of negative q/q growth instead of the standard definition of two quarters of sequential contraction.
August data confirms normalization of China’s economy. Industrial production growth has been firming from the initial big drops recorded in February. In August, it recorded 5.6% y/y growth, rising from the July growth rate of 4.8% y/y, and ahead of the Bloomberg consensus of 5.1%. With that, the y/y YTD industrial production “delta” has turned the corner into positive (figure 1).
Retail sales have also bounced back, from deep negative earlier in the year to a small positive growth figure of 0.5% for August, again ahead of the Bloomberg consensus, which was for zero growth for the month (figure 1).
Fixed asset investment is now about “breaking even”. The FAI year-to-date figure is now running at -0.3% on a year-on-year basis, which is slightly better than the -0.4% Bloomberg consensus estimate. This is the culmination of months of progressive improvements in the data, from the deep negative y/y contraction (-24.5%) recorded in February (figure 1).
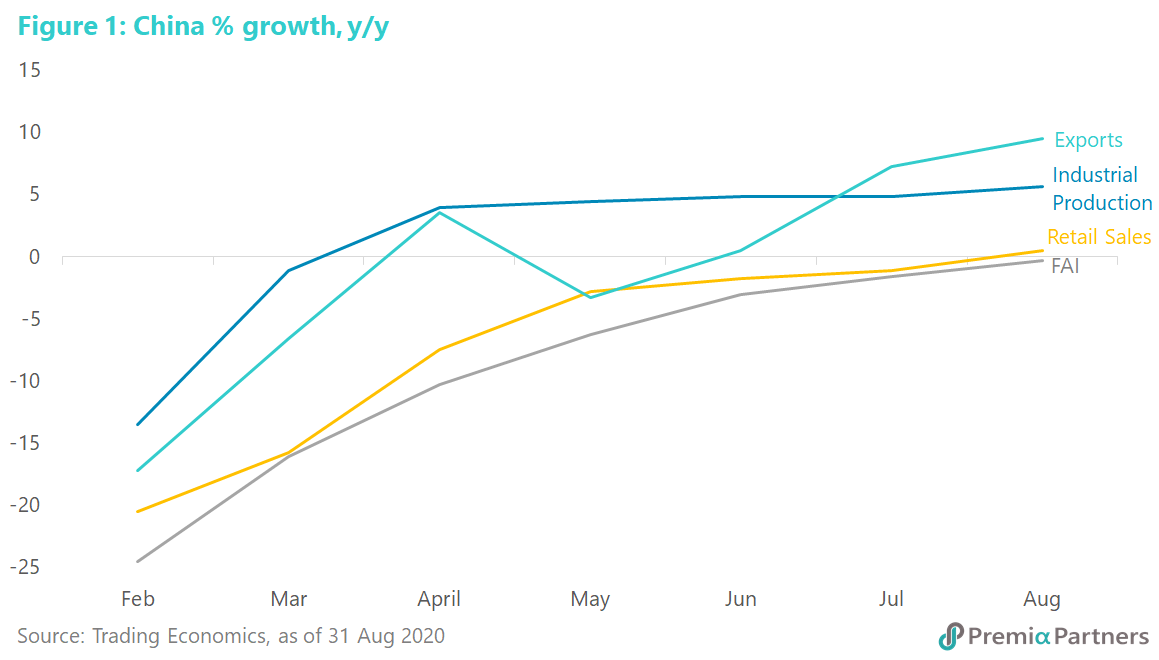
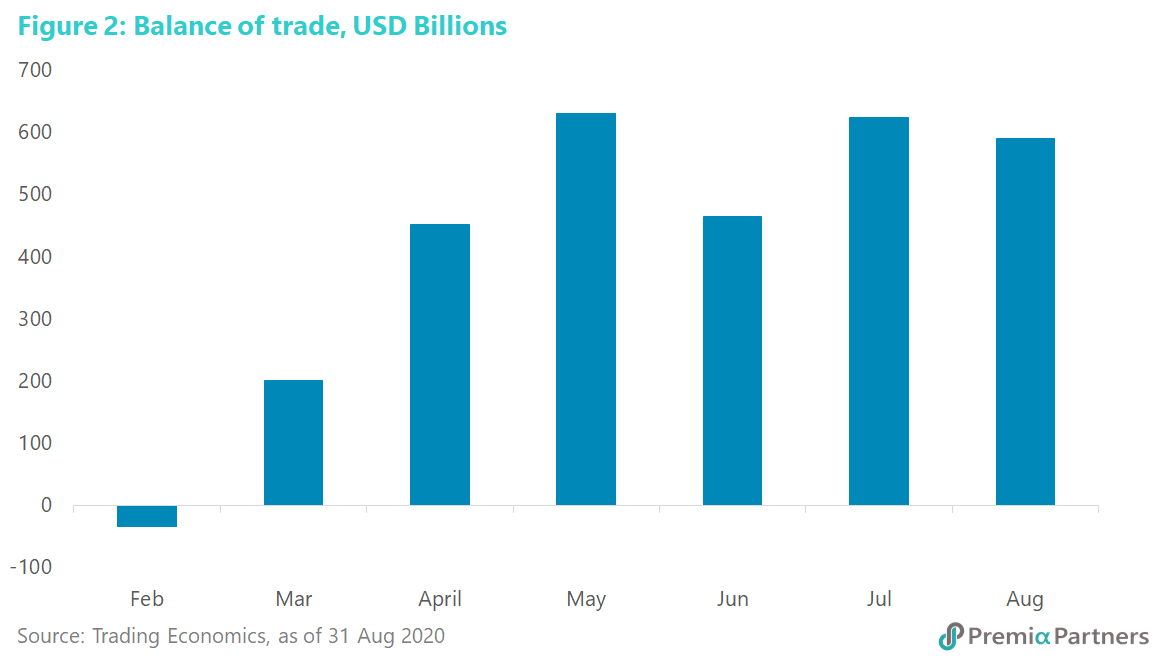
Export recovery was stunning with y/y growth of 9.5% for August, comfortably beating the expected 7.5% growth figure from the Reuters consensus estimate, and way up from -17% contraction in February (figure 1). Associated with that, China’s balance of trade had gone from a deficit of about USD 35 billion in February to a surplus of USD 623 billion in July and USD 589 billion in August, helping to lift GDP growth for 3Q20 (figure 2).
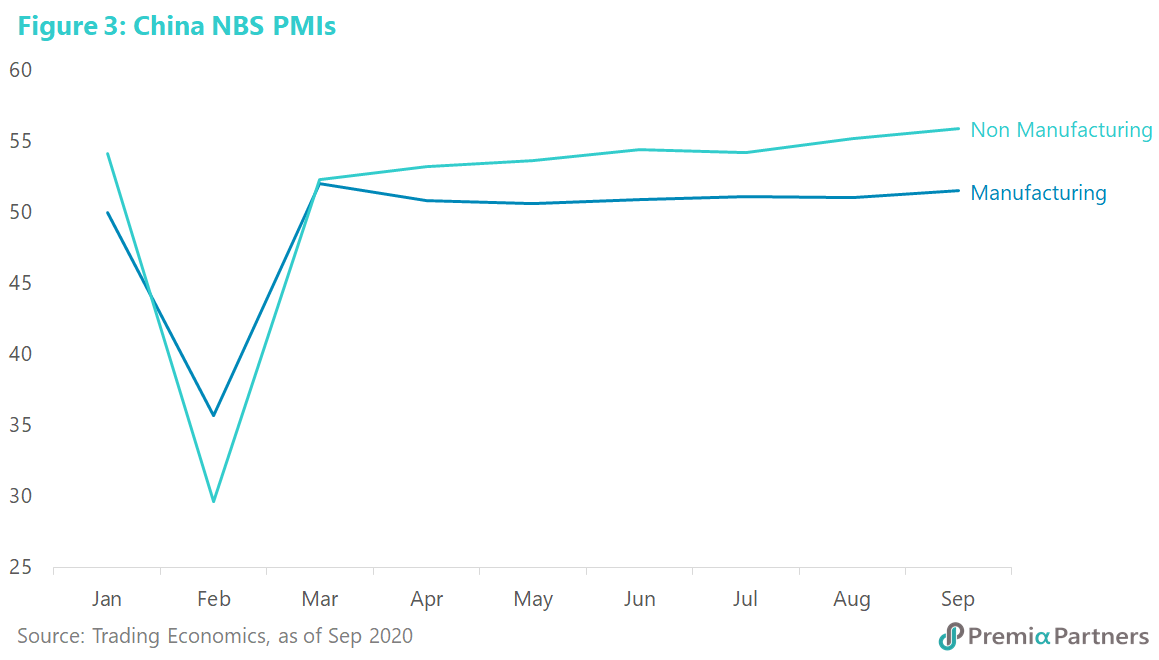
Economy may have picked up even more momentum in September. The September data for the official (National Bureau of Statistics) Purchasing Managers Indices confirms not just continuation of the recovery, but acceleration.
The National Bureau of Statistics Manufacturing PMI gained a bit more to 51.5 for September, compared to 51.0 for August. This exceeded the Bloomberg consensus of 51.3 and confirms an acceleration of the growth momentum - any reading above 50 indicates expansion of activity (figure 3).
The Non-Manufacturing PMI, which measures activity in the service sector, also picked up growth momentum. It came out at a healthy 55.9, rising from 55.2 for August, and comfortably beating the Bloomberg consensus which expected a decline from August to 54.7 for September (figure 3).
Economic activity indicators tracked by Goldman Sachs validated the normalization of the monthly data points. For example, citing Wind data, traffic congestion has been trekking higher than 2019 since around July. On Hualala data, the daily total for dining and takeout bills has been fluctuating around pre-pandemic levels. On Maoyan data, daily box office takings have returned to around 2019 levels in September. While the daily subway ridership (source: Wind) was still 9% below 2019 levels by September, the recovery has also been stunning, with a 7-day moving average of around 25 million persons in September, compared to around 3 million in February.
Sweet spot – growth going up, consumer inflation coming down, producer price deflation is easing. China at the moment appears to be in a sweet spot between rising growth, declining consumer inflation but stabilizing producer deflation.
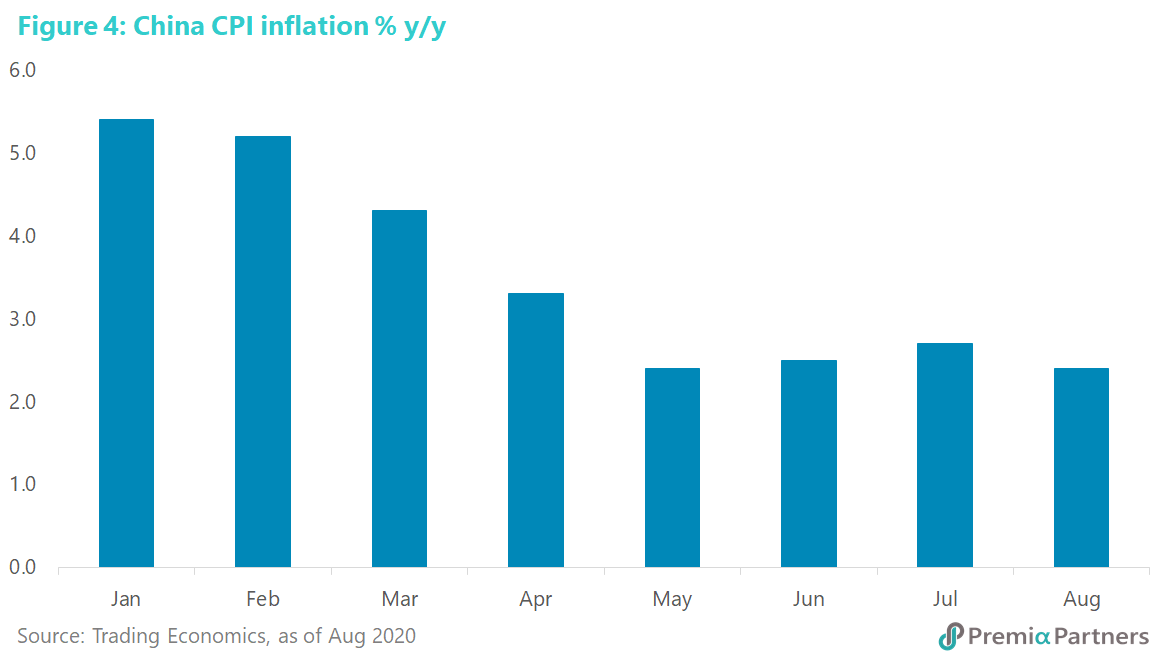
Consumer inflation has declined sharply as a result of lower inflation rates for services and rents from the start of the year. Although there has been an easing of COVID-19-related controls, consumer price inflation has remained flat since May. Indeed, August CPI inflation came in at 2.4% y/y, compared to 2.7% y/y for July (figure 4). Easing of food inflation, on the back of a sharp fall in the m/m inflation rate for pork prices, was an important factor.
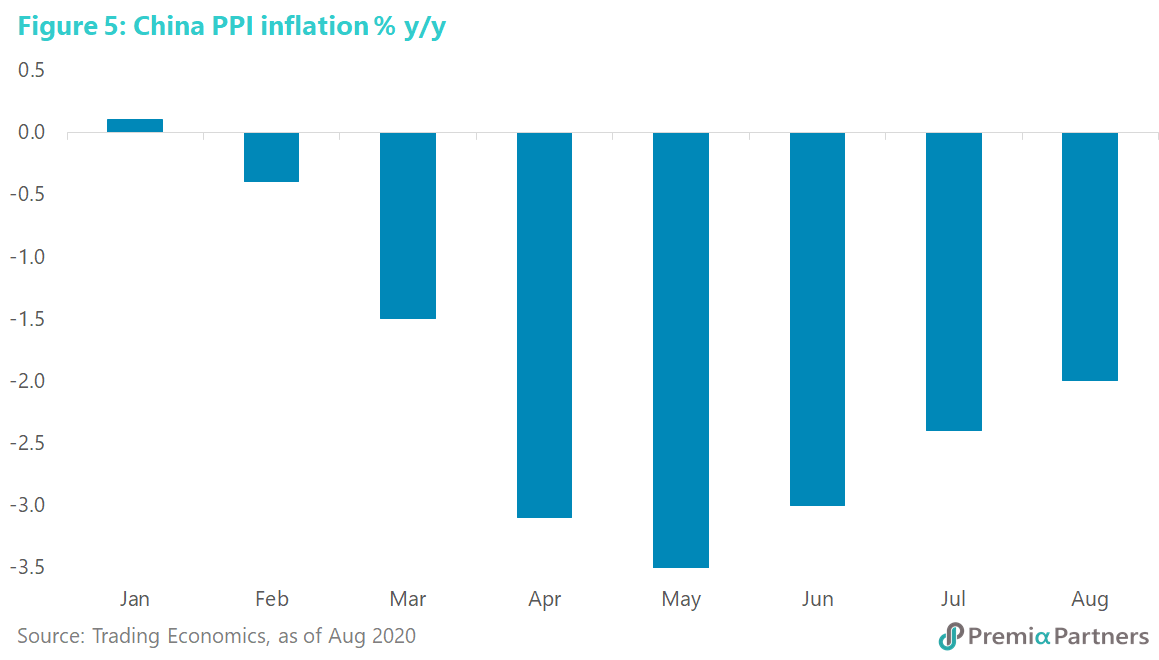
Producer price deflation however has been easing. China’s PPI deflation has been easing, from -3.7% y/y in May to -2.0% in August (figure 5). This will take some pressure off company profits even as economic growth returns.
Normalized and normal? So, the data tells a very consistent story of an economy that has almost normalized from the deep contractions in 1Q20. Yet, China is a “normal” economy in another sense.
It hasn’t engaged in the extreme stimulus of many other economies, particularly the United States. For example, M2 money supply expanded by only around 6% from January levels, comparing that with US M2 supply growth of 22% over the same period of time.
The People’s Bank of China has held its Reserve Requirement Ratio steady at 12.5%, while the Federal Reserve has cut its reserve requirements on all transaction accounts to zero, as part of its pandemic response. (Prior to March 26, net transaction account balances above the so-called “low reserve tranche” were subject to a reserve requirement ratio of 10%.)
The PBOC’s benchmark, 1-Year Loan Prime Rate, is now at 3.85%. It had been cut by only 30 basis points this year. The Fed on other hand cut the Fed Funds Target Rate 100 basis points since the pandemic, down to zero.
Chinese assets continue to look attractive for higher yields, strong currency and return of growth. The result of this is USD/CNY has fallen over 5% from the recent peak of 7.18 in May to 6.82 on September 25.
While Chinese policy makers would not want an uncontrolled surge in the CNY against a trade-weighted basket of currencies, continued moderate strengthening of the CNY is consistent with China’s need to grow domestic consumption to cushion the impact of US tariffs against Chinese products.
We had previously noted the high yield spread between the 10Y China Government Bond over the 10Y US Treasury. The attractive yield differential coupled with a strengthening CNY could draw more funds into Chinese fixed income and other assets in coming months. Note that FTSE Russell has just announced it will include Chinese Government bonds in its World Government Bond Index starting in October next year. Analysts have estimated this could result in an inflow of over USD 100 billion into the Chinese market, all of which continues to support the case for Chinese assets, including the CNY and Chinese equities – especially strategically.
With the upcoming US Presidential Election in November, the question being asked is also: Will a Biden victory be better for Chinese markets? The bottom-line answer is it probably won’t matter much. The trade and tech tensions between the US and China – indeed the entire strategic rivalry – will not go away just because the Democrats take over the White House. Trade and strategic rivalry with China are implicitly bipartisan in the United States. Joe Biden might be more predictable and polite in his dealings with China but not necessarily more agreeable.
The Chinese markets will be more dependent on its own internal drivers, which include (among others): 1) GDP growth 2) the growth of domestic consumption 3) moderation of its dependence on exports as a driver of economic growth 4) China’s drive for technological self-sufficiency 5) corporate profitability.
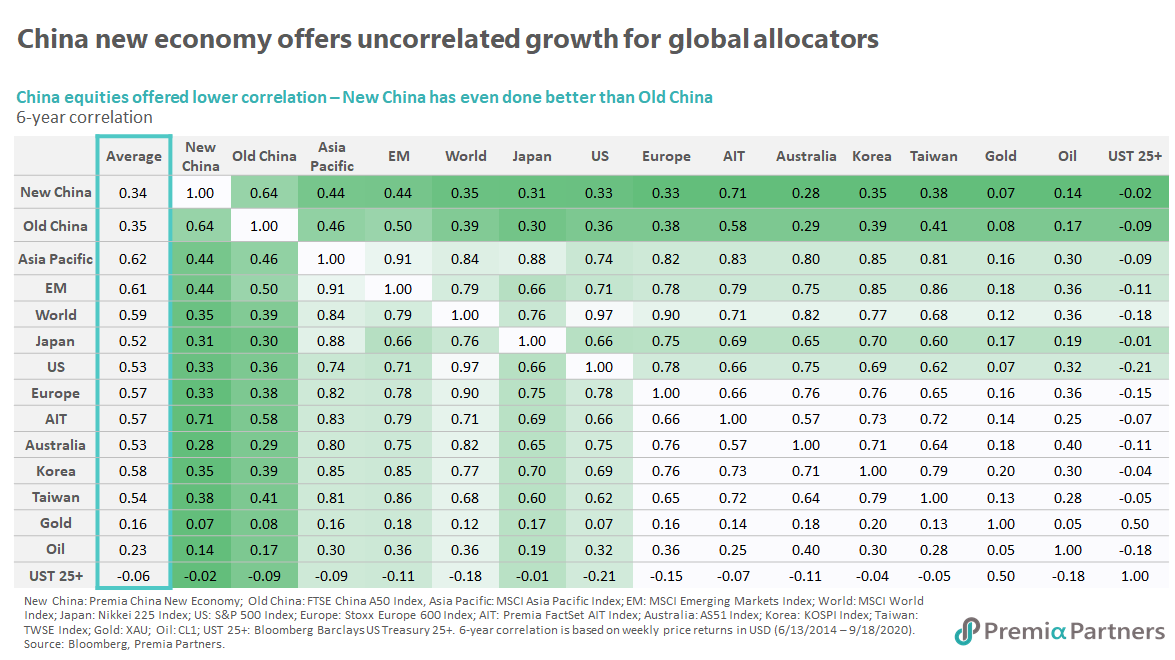
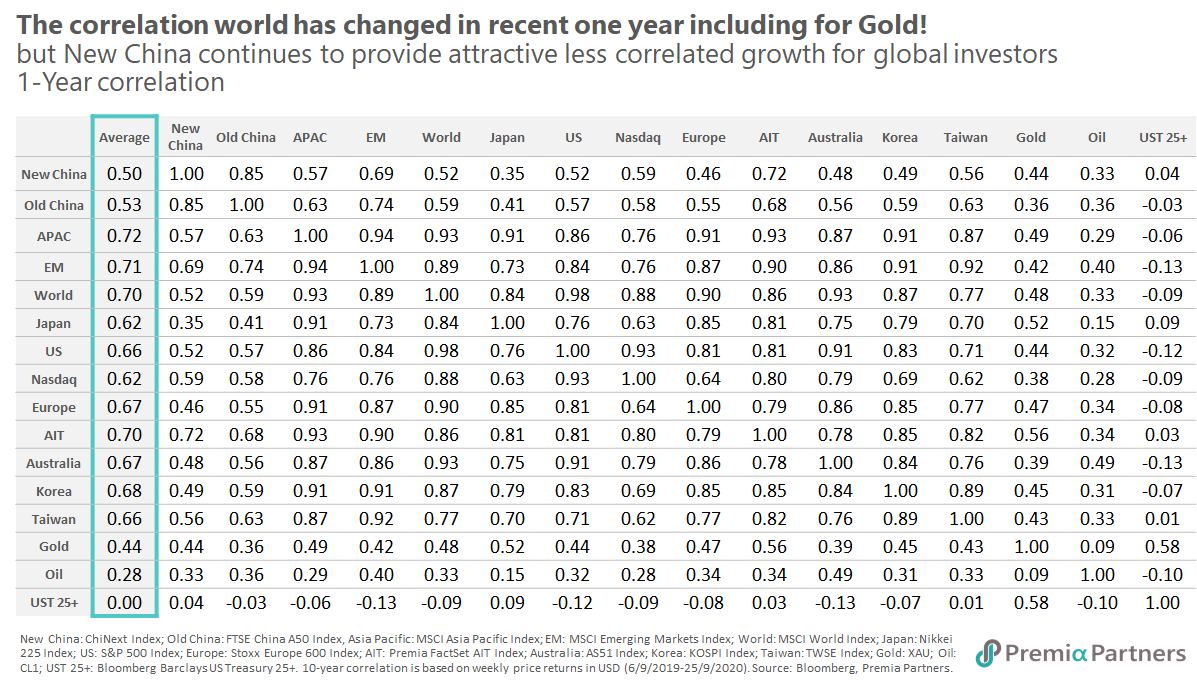
We have noted before Chinese equities’ low-correlation to other global markets.
At this time, a low correlation to US equities will be a good thing to have.