The markets may not love “Goldilocks Gridlock” quite as much when the fog clears. A witty writer for an investment bank coined the phrase “Goldilocks Gridlock” to describe the equities market’s immediate knee jerk rally, despite the divisions between a Biden White House, a Republican Senate and a Democrat House of Representatives.
The narrative was that markets were happy with the legislative gridlock because that would prevent a Democratic White House rolling back President Trump’s tax cuts.
That same gridlock may also hold back new pandemic relief measures that will prevent the US economy falling off the proverbial fiscal “cliff” come end of this year. It will also make Joe Biden’s proposed USD 5.3 trillion net fiscal boost to the economy less likely in its current form. A Biden White House may have to settle for something substantially smaller – whatever it can get the Republican Senate to agree to.
Remember the 2011 debt ceiling debacle? Before cheering “Goldilocks Gridlock”, market participants might want to remind themselves of events in 2011, during the first Obama Administration, when Democrats held the Senate (under Senator Joe Biden as Senate majority leader, by the way) and the Republicans controlled the House of Representatives. As legislators haggled, the US Treasury went to the brink of sovereign debt default. Peak to trough, the S&P 500 lost almost 22% through that 2011 debt ceiling saga.
The first test for a Biden White House is a new “CARES Act”. A whole raft of reliefs, benefits and protections under the CARES Act expires by the end of the year. So, this goes to the “lame duck” period – the transitional period between Administrations. Failure to reach a renewed package will see the US economy suffer a sharp drop in personal consumption expenditure, which accounts for 68% of the US GDP.
Bidenomics will be diluted but the Dollar will likely continue its long-term weakening. What then becomes of “Bidenomics”? There will be more stimulus but it will be less robust than what Joe Biden had proposed during the campaign.
So, the US Federal Reserve will have to do more heavy lifting for the US economy via monetary policy. Regardless of its questionable efficacy, it will print more money and buy more assets. One way or the other – “Bidenomics” or QE on steroids – the result will still likely be a weaker US Dollar.
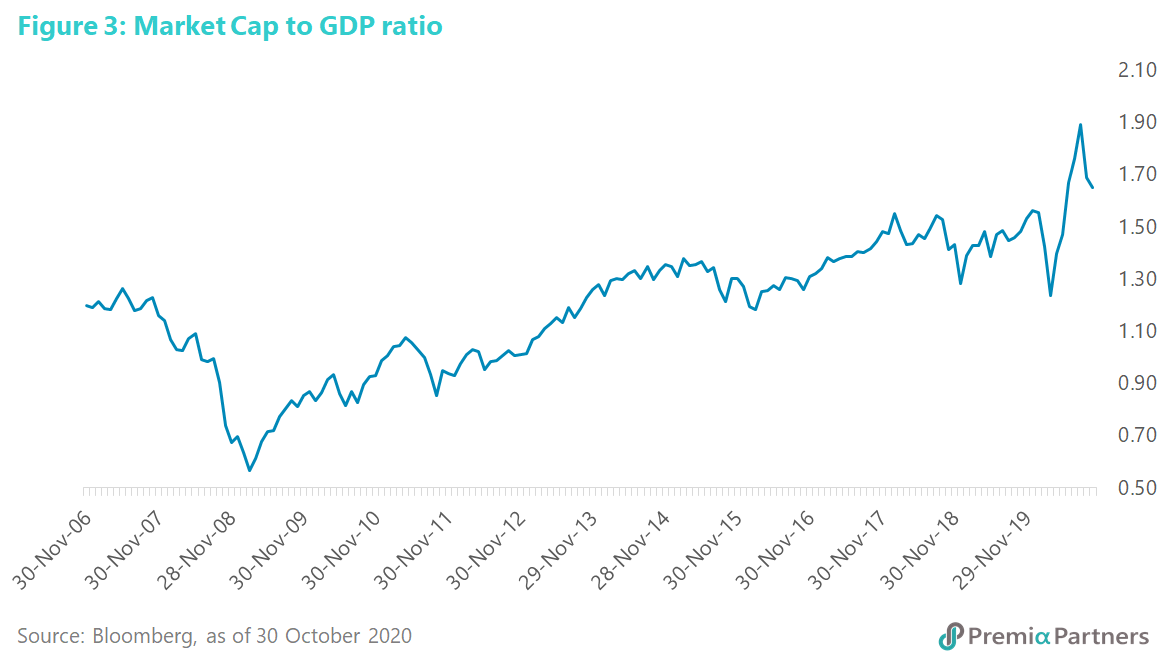
What does the fall in the 10-year US Treasury yield mean? The popular narrative is that the likely moderation of a Biden White House’s fiscal plans will curb the rise in US Treasury yields at the long end of the curve. Possible, and that may have been a driver for the Treasury trades last week.
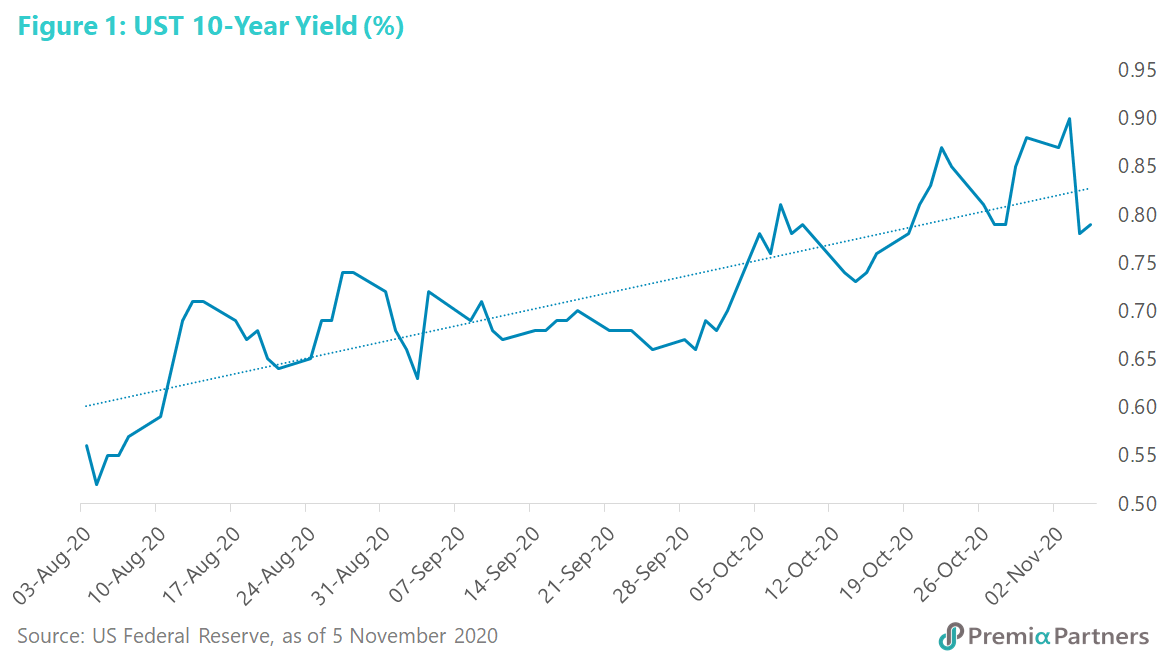
Yet, it is premature to conclude anything on the basis of a one-day, 12 basis point move. The uptrend from August is still to be contended with. Ironically, a deeper COVID-19 crisis in the United States in coming months could drive higher US Treasury yields, rather than the more intuitive expectation of lower yields. That is, Senate Republicans will be under greater political pressure to pass more misery alleviation (fiscal) measures. In the greater scheme of things, the uptrend in the 10-year US Treasury yield is still intact (figure 1), and the uptrend in the 10Y-2Y spread is similarly intact (figure 2).
What does this all mean for equities? Technically, there is still some momentum to carry US equities higher through to the end of the year. Nonetheless, the outlook becomes a lot murkier beyond that. Technically, the S&P 500 faces the task of breaking above and then sustaining above the September high of 3588, which is, by the way, also the all-time high. It will by then start looking technically overbought again.
On fundamentals, the US economy is likely to struggle as the pandemic starts curbing social and economic activity. New cases are now running above 122,000 a day in the United States, compared to around 78,000 cases a day at the peak of the second wave of infections.
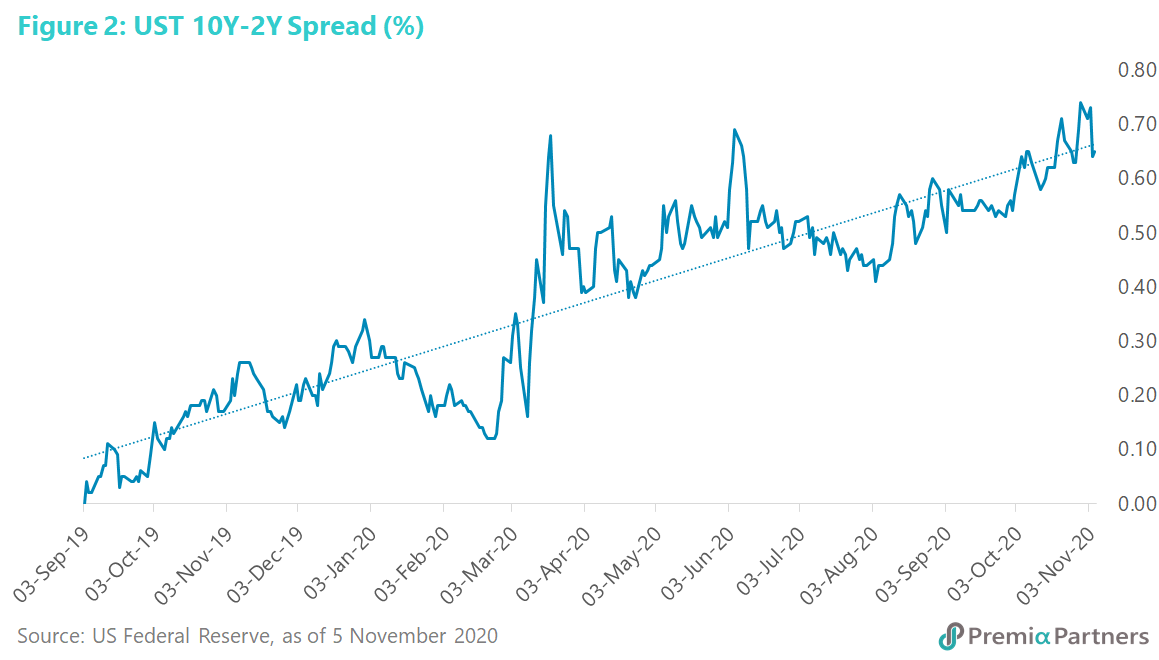
Against all that, valuation – from a modified version of the Buffett Indicator – will be looking very expensive by US historical standards. As it currently stands, total US stock market capitalization as a percentage of the US GDP is around 165%, having backed off from over 180% (figure 3). Even at 165%, it is way over 150% at the peak at the time of the Nasdaq Crash, and just below 120% before the Global Financial Crisis. (Note: The Buffett Indicator uses Gross National Product. We have used Gross Domestic Product as a proxy.)
We had been recommending diversification out of US equities into Emerging Markets, particularly China, for a while now. We reiterate that call.