
In early February, the S&P 500 hit an intra-day high of 4195, but it failed to sustain above the 50.0% Fibonacci retracement of the decline from January 2022 to October 2022. That was the first time the “postman” rang this year. And just when it looked like it was about to break below the 23.6% retracement support – located around 3805 – the S&P 500 rebounded on hopes that banking sector wobbles could force the Fed to pivot on rates.
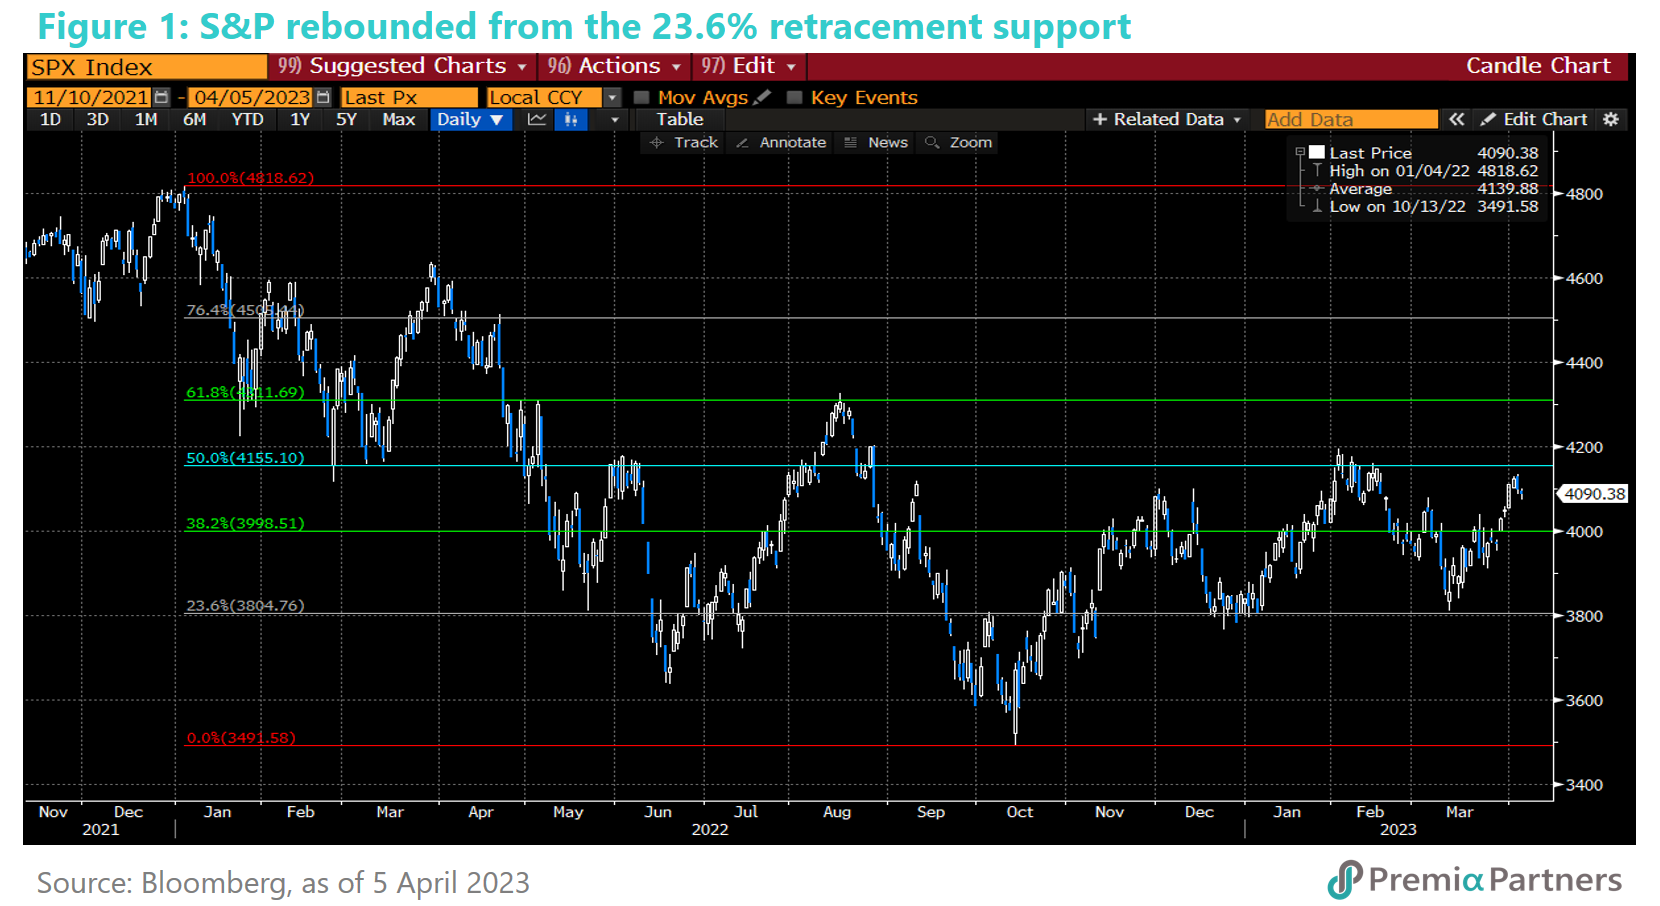
The S&P 500 is once again testing its 50% Fibonacci retracement resistance. The index is now approaching again the 50% retracement resistance. Our sense is that, for a second time, it won’t sustain a move above that resistance. The risk then is that it returns to a downtrend channel. The postman may just have rung a second time.
What would the rates-adjusted valuation look like if the S&P 500 was back to its January 2022 high? It would be wonderful if those caught long on US equities could be made whole, but consider what it would mean in terms of valuation to be back at the January 2022 high of 4819.
A return to a forward PE ratio of 22x is actually an overshoot of the prior high valuation, after taking into consideration the much higher risk-free rate. In January 2022, the forward PE ratio for the S&P 500 was around 22x. At the current analysts’ consensus estimate for FY23 earnings of 220 (based on IBES data as published in early April by Yardeni Research), a return by the S&P 500 to 4819 would bring the market back again to a forward PE of 22x. However, in January 2022, that same peak forward PE was against a 10-year UST yield of only 1.8%. That translated to an excess yield (earnings yield minus the 10-year UST yield) of 2.7%. Yet today, a 22x forward PE valuation is set against a much higher 10-year UST yield of 3.4%. That means a miniscule excess yield of 1.1%. Investors should ask themselves whether it is worth taking the inflation, interest rate and banking stability risks for 1.1% excess yield.
Further, the current earnings forecasts for FY23 are fraught with risks. Then you have to also consider that the current analysts’ consensus estimate of 220 is based on an expectation of a pick-up in quarterly earnings from 2Q23. That seems a bit optimistic, given that for 1Q23, analysts are estimating a 6.6% decline in earnings.
The expectation of a sudden reversal in earnings from 2Q23 is at odds with the scenario of a slowing economy. Analysts are therefore apparently not expecting an economic slowdown, let alone a recession. Yet, investors are expecting rates to be cut. So, the optimists are expecting a strong economy with rising earnings momentum but falling rates – that is quite a Goldilocks combination. Continuing with movie metaphors, and to borrow from Clint Eastwood from his “Dirty Harry” movie: “Well, how lucky do you feel?”
Never mind a return to a 22x forward PE – even the current forward multiple of 18x is expensive. Let’s look again at that full recovery forward PE ratio of 22x. To repeat, that implies an earnings yield of 4.5%, set against a 10-year UST yield of 3.4% currently. That gives you an earnings yield of only 1.1%, whereas the average 10-year forward PE of 17x was set against an average 10-year UST yield of 2.2%, translating to an average earnings yield gap of 3.7%. To get that 10-year average “excess yield” today – given the higher 10-year UST yield – investors would need a forward PE of around 14x. To reiterate, that’s based on only the average forward PE of the last 10 years, not the cyclical low PE ratios, which would give you an even lower valuation. Bottomline: the market at its current 18x forward PE is still expensive by historical standards, considering earnings and the risk-free rate.
On a valuation basis, the only justification for investors to chase this market is the expectation of lower rates and yields. So, the only way to make sense of a yet higher index is if the market assumes lower rates and yields. That is a big, risky bet, given what the Fed is telling the market – that it is committed to bringing down inflation to 2%.
Meanwhile, OPEC+ has thrown a curve ball at the US. We had been warning for months about the link between US headline inflation and gasoline prices. The decline in the US headline CPI inflation rate from June of last year coincided quite neatly with a decline in US gasoline prices. Our concern had been that the disinflation optimism underlying the equities bull case was driven by volatile energy prices. Meanwhile, we have still not seen meaningful disinflation in core inflation – particularly in services. The OPEC+ decision last week to cut output by another one million barrels per day could send gasoline prices back up again, taking headline inflation up with it. We are expecting Brent crude to head back above US$90/barrel over the course of the year, as China’s consumption picks up.
Probabilities don’t look good for US equities. Investment is never about certainties. It is at best about probabilities. Right now, the probabilities of a full recovery in US equities don’t look good for fundamental and economic reasons outlined above.
To repeat, the bull case is based on rate cuts, earnings growth and a valuation re-rating upwards – “how lucky do you feel?” That’s quite a trifecta of good fortune to hope for. The bulls are expecting all this as the US struggles with the highest inflation in 40 years, the lowest real 10-year UST yields since the early 1980s, banking instability and the highest CAPE ratio since the period just before the Nasdaq crash.
