
There is no simple investment world view. Investors have to position themselves in assets likely to benefit from a rebalancing of these divergent forces. We choose to position at the bottom of the cycles, or at least at the lower end rather than at the higher end of these different cycles. We choose to underweight US and Japanese assets, neutral weight European stocks and overweight Asian Emerging Market assets.
The United States
Unfinished business of beating inflation. The bounces in US risk assets around hopes for an early Fed “pivot” likely underestimate the scale of the challenge facing the US economy. They are likely just bear market rallies within a downtrend channel.
The unrestrained use of monetary and fiscal expansion as easy fixes for difficult situations have come back to damage the US economy through the highest inflation in over 40 years.
A soft-landing out of this turbulence is unlikely. The more likely choices are either recession in 2H2023 or an extended period of stagflation. A recession is the less brutal of the two choices facing the Federal Reserve because at least it can then use some interest rate buffer to reflate the economy in 2024.
But for 2023, the outlook is for more losses for the S&P 500 as valuation multiples fall to account for a higher discount rate and as earnings decline. US Treasuries will likely come under renewed selling pressure from rising rates and lower holdings amongst key foreign buyers, US banks and even the Federal Reserve. Corporate bond spreads will likely widen as the economy slows and default rates rise. Mark-to-market damage to corporate credits, already worse than losses from equities, will likely continue, which underweight US stocks and bonds.
As in 1965, this US inflationary episode started with a money printing spree. The United States is today facing some of its greatest economic challenges since World War Two.
In response to the pandemic, the US undertook the greatest monetary expansion since WW2, resulting in the highest M2 money supply to GDP ratio ever recorded. This went into funding the biggest budget deficit to GDP ratio since WW2.
The Fed printed it, the Treasury tossed it around, the US consumer spent it. This was the metaphorical “helicopter money” in action – money dropped from on high into the bank accounts of US consumers. Budget outlays blew out – with the Federal Government spending, cumulatively, an additional US$4,600 billion in 2020 and 2021, compared to the annual outlay in 2019. A lot of that went to US consumers. So, households’ and non-profit organisations’ bank deposits rose around US$3,100 billion over the period 2019-2021. That’s a rise of 2.6 times over the 2019 balance of US$1,201 billion. That’s a lot of extra money in bank accounts for discretionary spending.
Federal debt went up US$6,416 billion over that time and around 55% of that incremental US Federal debt was funded by increased holdings of US Treasuries by the Federal Reserve. This is the closest the US has come to debt monetisation, Bank of Japan-style.
“There ain’t no such thing as a free lunch”. History tells us that periods of great monetary expansion tend to be followed by periods of great inflation and there has been no period of monetary expansion in US history as great as what we have seen in 2020-2022.
Demand stimulus meets supply disruption. So, policy stimulus – a variant of financial engineering – has borrowed demand from the future. Yet, financial engineering cannot borrow supply from the future. The inflationary wave that hit in 2022 was both demand and supply driven. The helicopter money variant of quantitative easing borrowed demand from the future. However, supply was stuck in a dysfunctional and diminished present, as supply chains struggled to reconnect.
Lower commodity prices have brought some relief. The easing in commodity prices and supply chain disruption – and this is measured by the Global Supply Chain Pressure Index, which peaked last November – contributed to the decline in US headline inflation from its prior peak in June.
But there are risks to the peak inflation narrative. Looking forward however, investors may need to be cautious in straight-line projecting the recent declines in food and energy commodity prices. Food prices are unstable due to – and we quote from the latest (November 2022) FAO Food Outlook report – “increased climate variability, conflicts and geopolitical tensions, bleak economic prospects, soaring agricultural input costs and export restrictions.”
At the time of writing, cereal prices were back up again on Russia’s suspension of the Black Sea Grain Initiative. Similarly, energy prices can also be volatile with low inventories, OPEC+ contemplation of more production cuts, the coming European price cap on Russian oil, the onset of the northern winter, and possible revival of demand from China.
Meanwhile, US core inflation has yet to show sustained decline. Inflation has spread from commodities to the core shelter (which is around one third of the CPI basket) and services components. So-called “sticky inflation” – which relates to items that typically don’t change for at least 4 to 5 months – has so far only gone sideways for one month. Historically, sticky inflation needs to turn before core inflation reverses in a sustained manner.
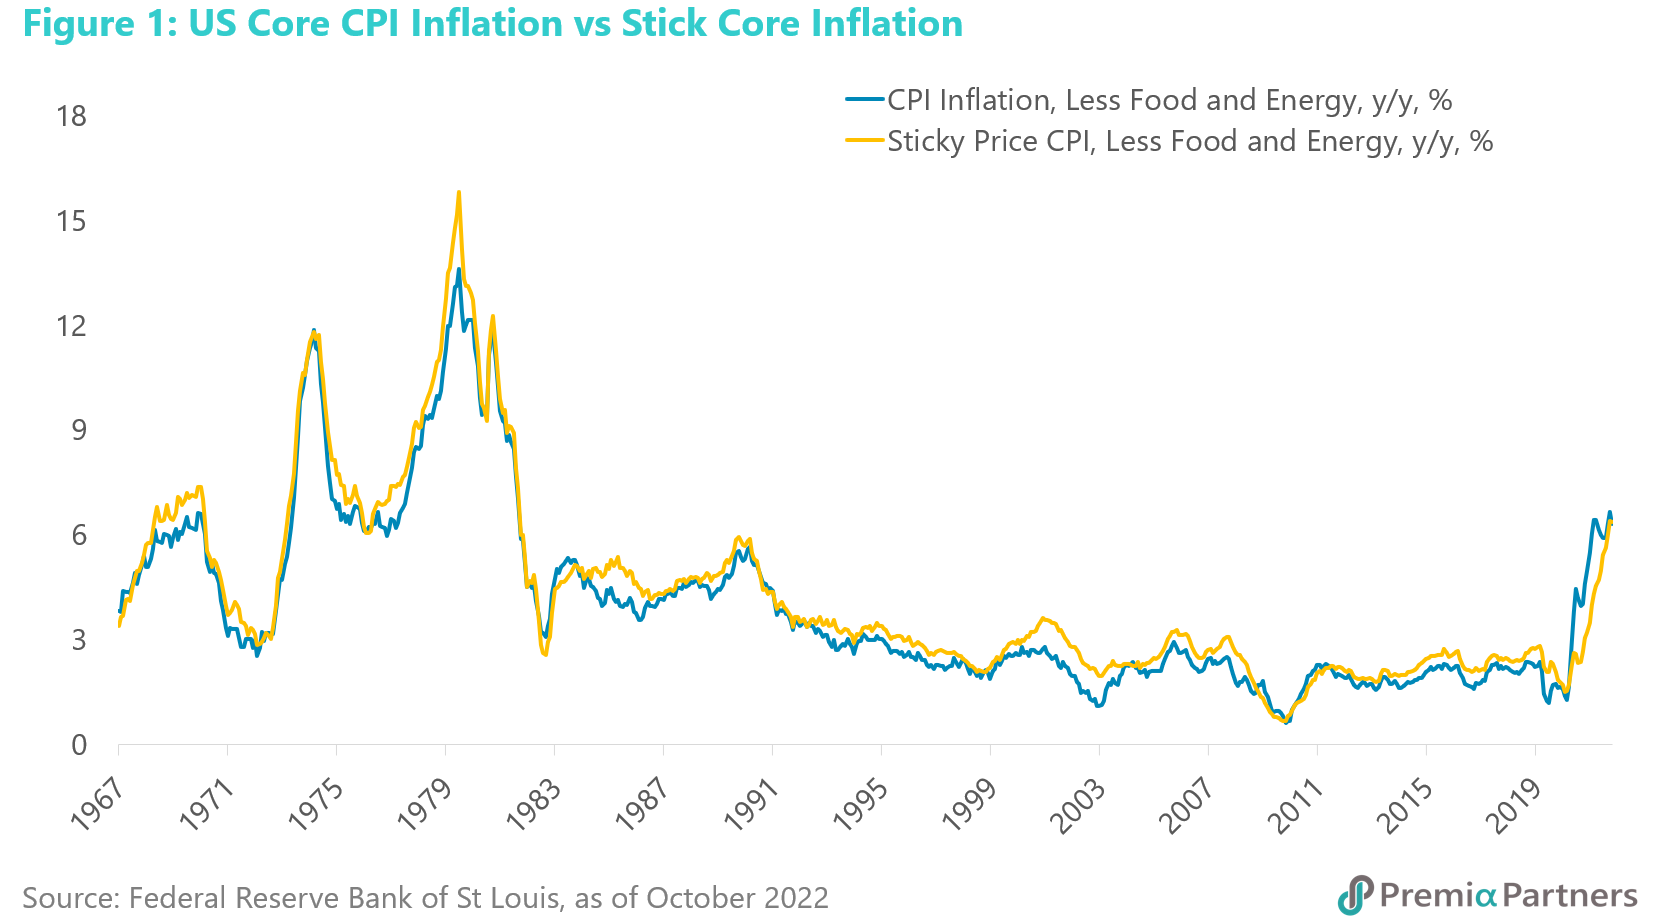
A troubling bit of history about US inflation and rates. Going back to 1960, there has been no instance of an inflationary episode being brought down without the Fed rate matching or exceeding the core CPI inflation rate.
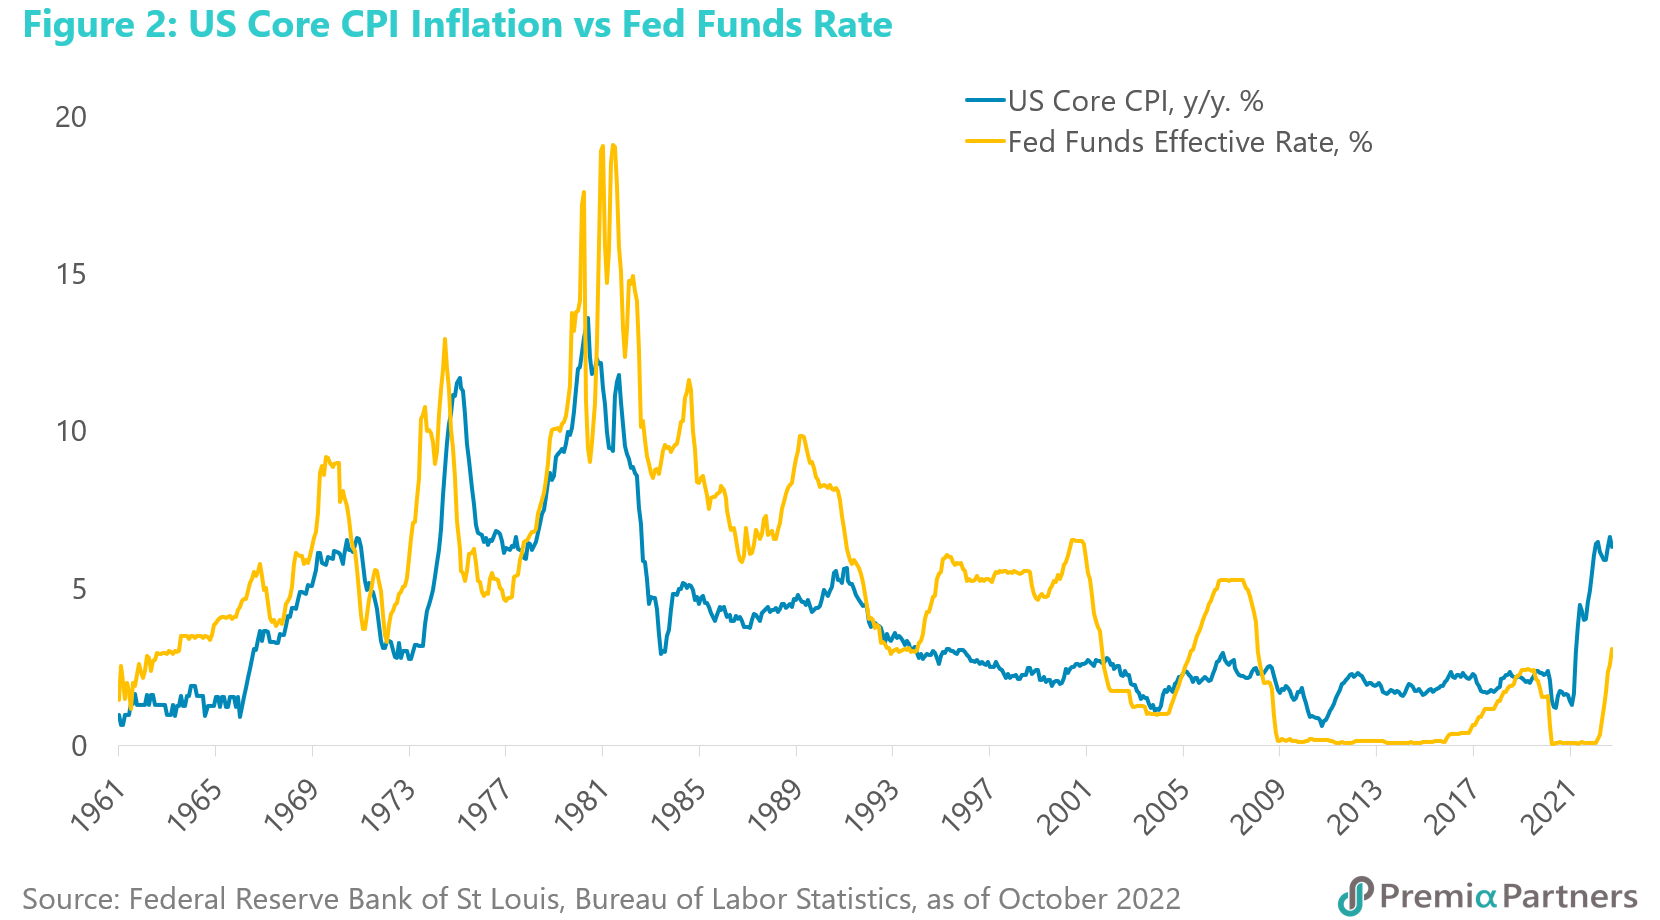
This is not to say this can never happen. Yet, with core inflation running at 6.3% y/y and the Fed effective rate at only 3.8%, we are wary of calling “mission accomplished” in the US battle against inflation at this point. Indeed, the Atlanta Fed’s Taylor Rule utility is suggesting at least 6.5% on the most benign of three methodologies it presented. The current consensus bet on a peak Fed rate of around 5% may be too low.
The danger of over-emphasizing the role of commodity prices. The period 1965-1982 has come to be called the “Great Inflation”. For all the attention given to the role of commodity prices in this latest inflationary episode, the Great Inflation did not start with energy or food prices. The price of crude oil looked comatose on a chart until around 1970, when core inflation had already surged from 1.2% to 6.6%. Crude oil prices started surging with the First Oil Shock in 1973.
Years ago, Michael Bryan, from the Federal Reserve Bank of Atlanta summed up the genesis of the Great Inflation neatly as follows: “While economists debate the relative importance of the factors that motivated and perpetuated inflation for more than a decade, there is little debate about its source. The origins of the Great Inflation were policies that allowed for an excessive growth in the supply of money – Federal Reserve policies.”
In particular, there was a surge in M2 money supply growth between 1960 and 1964, as there was – on a colossal scale – in 2019 and 2020. The Fed has brought the y/y change in M2 money supply down dramatically over the past year. Nevertheless, there are lags. During the Great Inflation, inflation continued to gallop ahead even as the Fed brought the growth in M2 money down. The cycles were lagged but evidently related.
The Fed has a window of opportunity to crush inflation. The Fed has a dual mandate – jobs and price stability. The Fed would seem to have hardly any reason to pivot from a jobs perspective. The current US unemployment rate of 3.7% is way lower than the level below which it puts upwards pressure on inflation. That inflation-neutral level of unemployment– usually referred to as the NAIRU – is estimated at around 4.4%, and there were 10.7 million job openings in September, looking for takers amongst only 6.1 million unemployed. Meanwhile, the Fed recently said the US economy had been running this year even more over its real potential GDP than it had realised. In short, the Fed has a window of opportunity now to crush inflation before a recession becomes imminent. Logic would suggest they should use this opportunity to get the job done.
Prepare for a re-run of 1965-1980 if the Fed backs down on rate hikes prematurely. If the Fed weakens in its resolve to crush inflation, it will likely store bigger problems for 2023, much as it did from 1965 to 1980, when the Fed flip-flopped between rate hikes and cuts and hikes, repeatedly, with inflation pushing higher and higher. Just as during the Great Inflation, the S&P 500 could then be tossed up and down like a yo-yo, in very short bull and bear cycles.
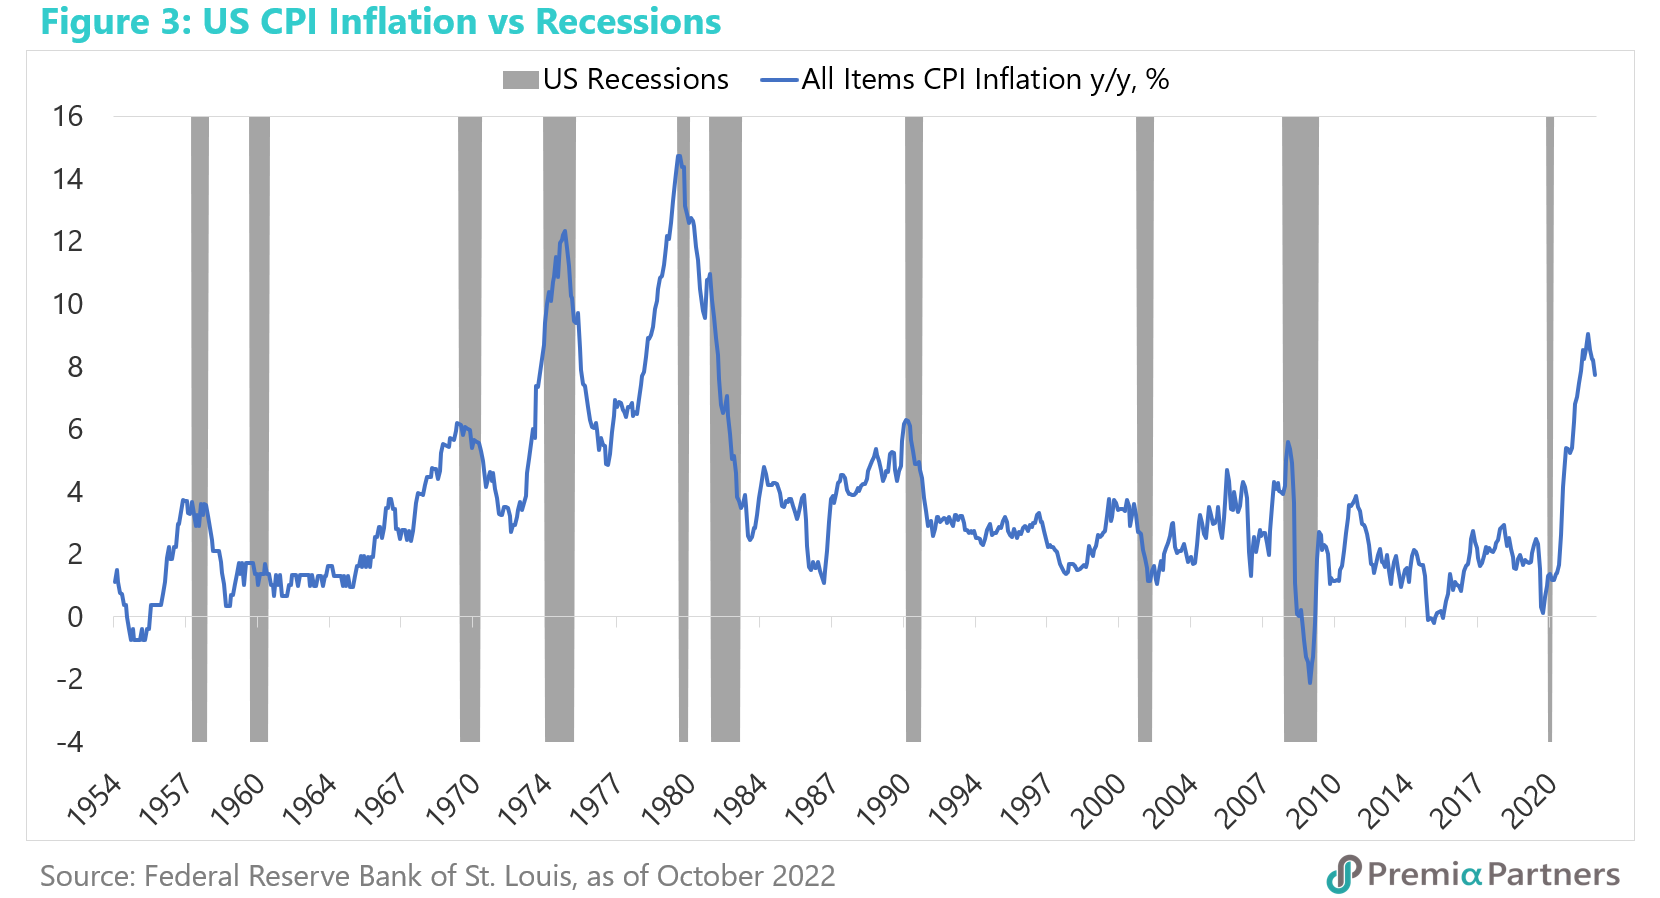
If the Fed remains committed to crushing inflation through 1H2023, a recession is likely in 2H2023 – and that may be the better outcome between recession or stagflation. Another troubling bit of history is that going back to 1955, there is no instance of a major inflationary episode being brought down sustainably without a recession. There is a trade-off between growth and inflation.
The optimists in the market are thinking of a narrow strip of safety – between inflation and recession – for the Fed to soft-land the economy. Never say never, but that is an unlikely outcome. A more realistic take on this is the Fed has a small window of opportunity to build up its policy rate buffer and crush inflation before the economy ends up in stagflation. Then it ends up with high unemployment, high inflation, a bloated central bank balance sheet, deeply negative real rates and yields, a historically high debt to GDP ratio, and no conventional policy levers left to pull.
The Fed appears to be already preparing itself for a recession. Fed staff have warned of 50-50 odds of a recession next year. FOMC members’ unemployment rate guidance for the end of 2023 implies a recession sometime in 2H2023 on the so-called Sahm Rule Indicator. The 10-year-2-year US Treasury yield curve speaks of the same risk of a recession some time in 2H2023.
As recession approaches, S&P 500 earnings estimates will likely fall sharply. The market consensus at the start of the year was for 8.4% earnings growth for the S&P 500 for 2022 and 9.9% for 2023. The latest estimates have marked that down to 5.7% for this year and 5.0% for 2023. But that’s still way too optimistic. If we have a recession next year, the S&P 500 12-months forward earnings estimates will reverse. Going back to 1969, on average, S&P 500 earnings fell 21% in a US recession.
The stimulus support for index earnings could be setting the market up for big disappointments. Typically, index declines are accompanied by earnings estimate declines. Market optimists note that the 2022 sell-off has not been validated by falling earnings estimates. The corollary is the index should rebound to reflect still strong earnings forecasts. That, however, misses a critical point about the leads and lags that come with policy stimulus and subsequent policy tightening. The root of the current problem is an overheated economy, and that overheated economy is sustaining earnings – for now. So, there is a lag. If the Fed is serious about crushing inflation, you will get a recession, and you will have earnings falling with a lag to policy tightening.
US equities likely to remain in the grip of the bear. The average decline in US bear markets from 1929 is 40%. If you applied that average decline to this market, you get roughly 2900 for the S&P 500. The average forward PE ratio at recent cyclical bottoms is 12.6x. Applying the latest 2023 forward earnings estimate of 246 for the S&P 500, the average cyclical bottom forward PE ratio of 12.6x would translate to an index level of roughly 3100.
S&P 500 downside risk is for much lower levels in a recession. Another valuation perspective is the yield gap between earnings yields and the 10-year UST yield. If you applied the 20-year average yield gap to the current 10Y UST yield, you get an implied forward PE valuation of 13.8x, and an index level of around 3400.
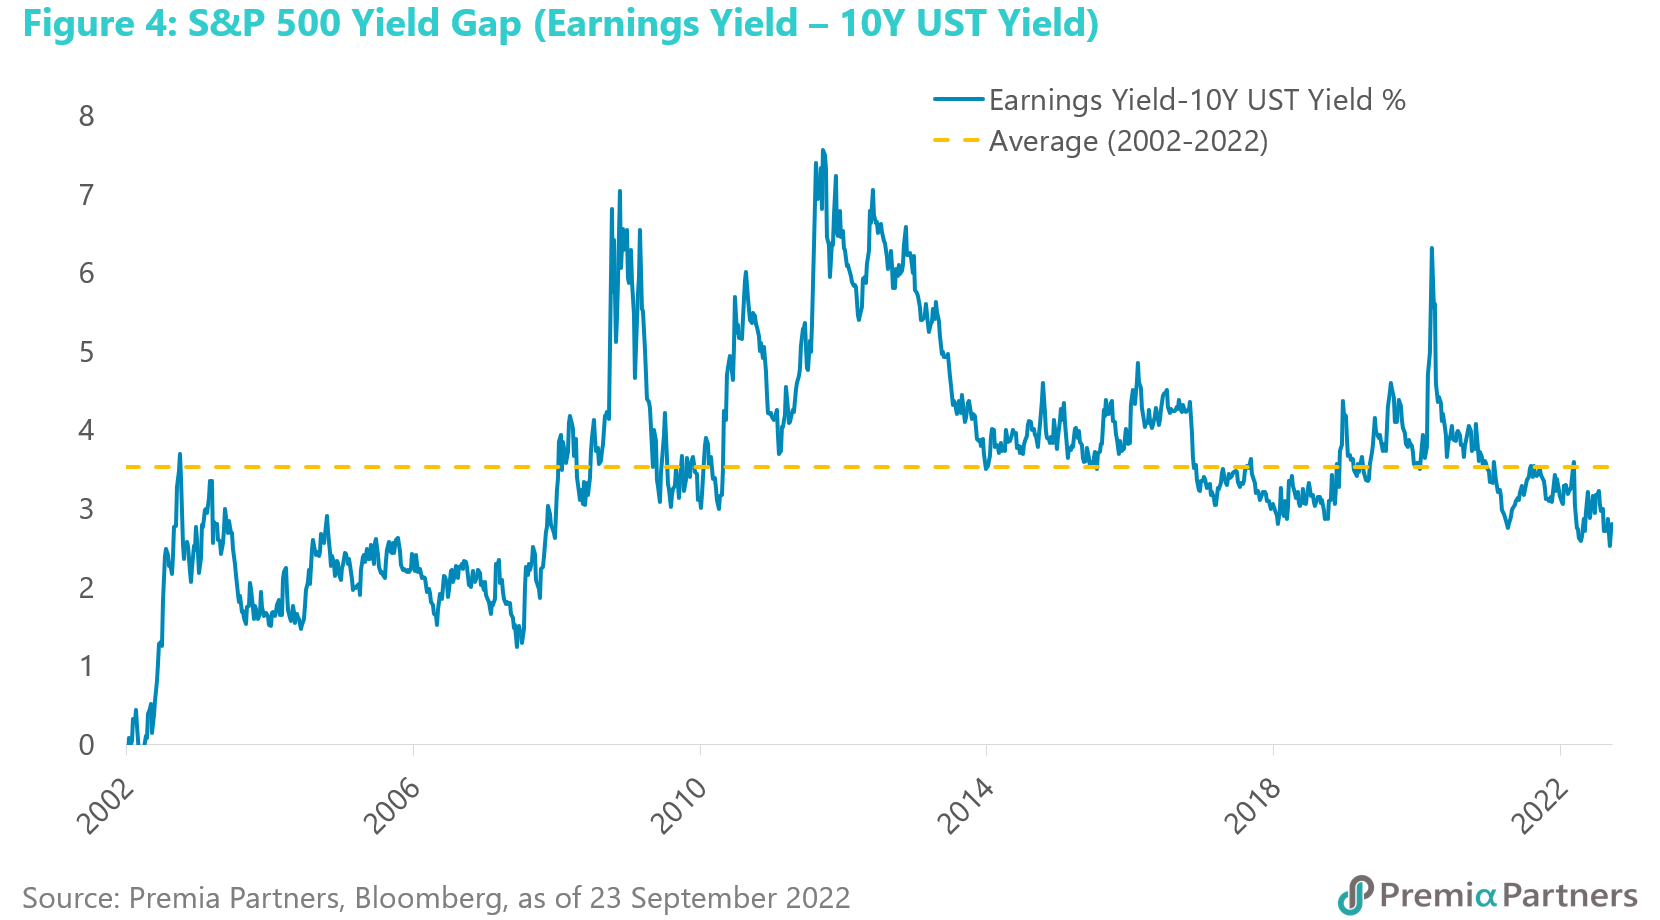
But if you applied the average yield gap from only the cyclical lows, you get an implied forward PE of 11.2x, and an index level of around 2800. Markets don’t have to behave according to historical averages and in any event the 10-year US Treasury yield is a moving target. All this is intended to convey is that with a historical range of between 2800 and 3400, the S&P 500 is overvalued if a recession becomes reality.
US bonds – no refuge in this storm. If this is a secular trend change in inflation and rates, the real 10-year US Treasury yield is so deeply negative the outlook is very worrying. Adjusted for the US all-items CPI inflation rate, the real yield hit a historic low of -6.4% in March of this year, and appears to be mean reverting.
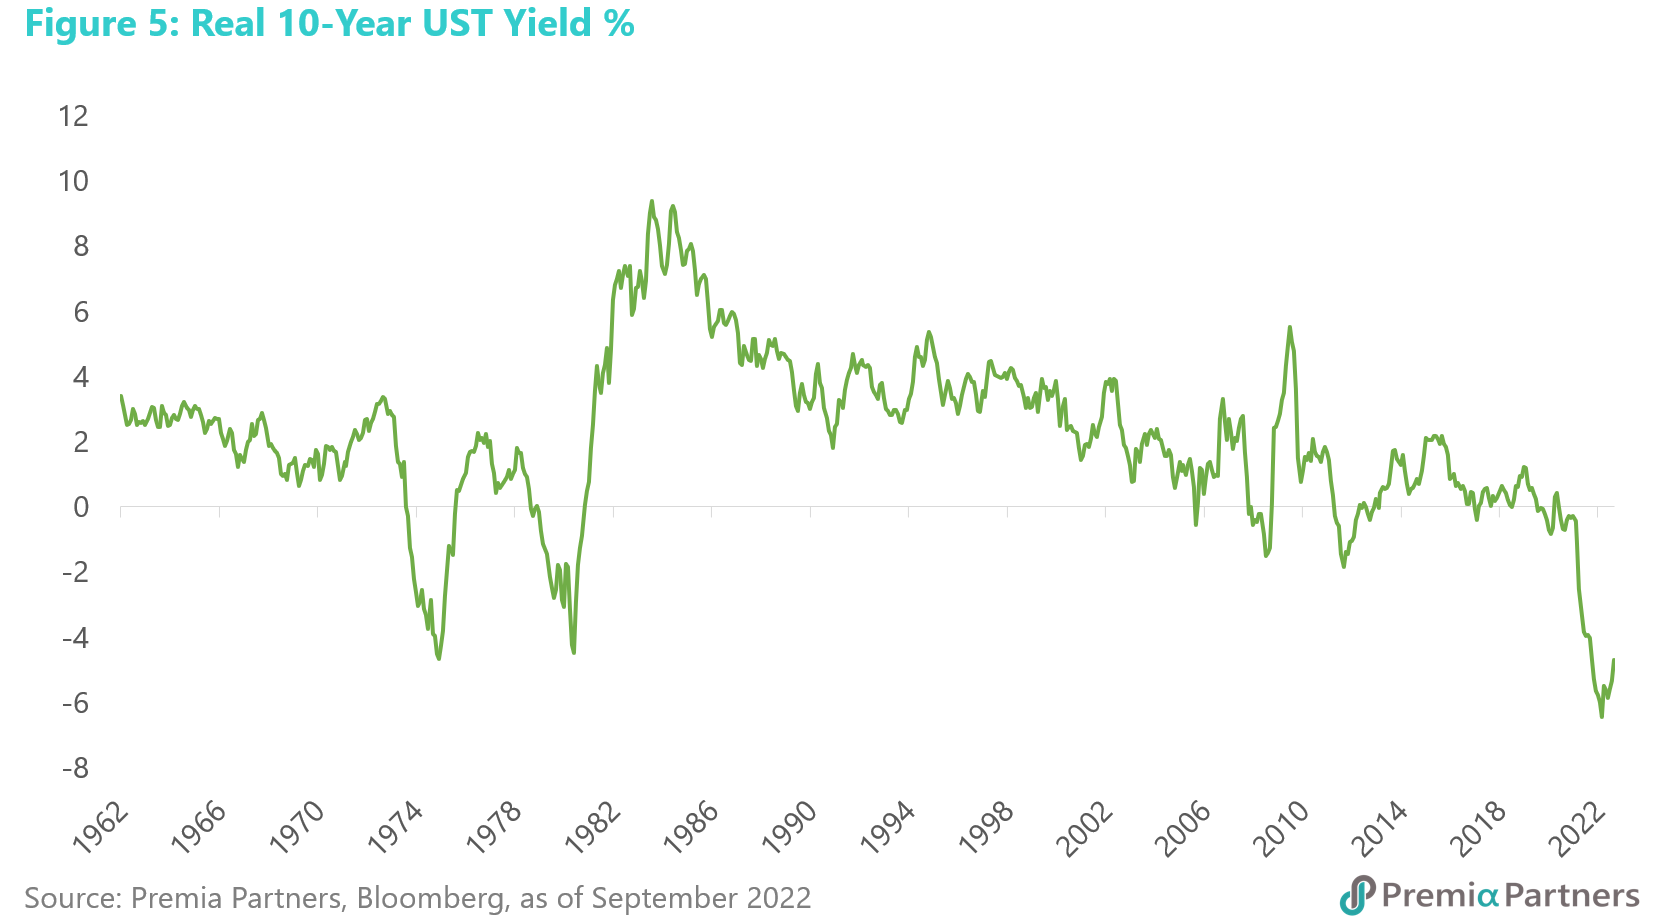
The 60-year average for the PCE inflation-adjusted yield is +2.6%. The more recent 12-year average is +0.27%. All else being equal, even a reversion back to the more moderate 12-year average of +0.27% from -6.4% will be catastrophic.
Spread widening threat even as the “risk-free” rate rises. Then there’s the spread over the “risk-free” rate to worry about. The current average spread for US BBB-rated credits is currently only around 175 basis points. If the US economy enters a recession, the average US BBB-spread could head to 350-400 basis points, which is where they peaked around the 2001 and 2020 recessions. It hit almost 800 basis points in 2008.
US corporate bonds have done worse than equities. Bloomberg reported in early November that a Bond CliQ model portfolio of investment grade bonds was down 34% year-to-date. This was double the 17% decline in the S&P 500 over the same time frame.
Default rates are likely to surge if a recession hits. While the market-to-market damage is bad enough as it is, consider how much worse it can get as spreads widen and the default rate rises. The current credit default rate is only a tad above 0%. But recent past recessions have been followed by surges in the default rate to between 5% and over 10%.
Euro Area
Triple whammy of pandemic-response inflation, war disruptions, and an energy crisis in winter – but much of the bad news may already be in the price. The Euro Area has been hit by that metaphorical “perfect storm” – a pandemic response that encouraged inflation; a war that aggravated those inflationary tendencies; and a geopolitically-induced energy crisis as it enters winter.
The result is the highest producer price inflation ever recorded (44% y/y in August) and the highest consumer price inflation since 1981. The consumer price inflation rate has come off its peak of 10.6% y/y but is still running way above US figures, at 10% for the year to November. The European Central Bank, which has raised its refi rate 200-basis points in four months, may be more stoic about the demand destruction required to curb inflation than the Federal Reserve.
European stocks offer much lower valuation relative to US equities. There is of course a geopolitical risk factor at play here. Other factors to consider are: a recession is likely to be already underway; European earnings are likely to contract next year; and European stock valuations are still not at cyclical lows, but then neither are US stocks. We would apply a neutral weight to Europe on its lower tech exposure, lower valuations compared to the US, and on it benefiting from an economic rebound from China.
Europe is likely already in recession. The outcome of all this is that the Euro Area (EA) is now highly likely already in a recession or headed into one very early in 2023. The German Bund 10-year minus 2-year yield spread is now negative-20 basis points. This inversion of the yield curve reflects a similar negative spread seen at the start of the COVID-19 pandemic in February 2020.
Monetary tightening, financial stress and sharply lower levels of confidence are blights on European stocks. As an indicator of financial stress, the EA’s financing conditions index has been tightening back to levels last seen at the worst point of the European debt crisis in 2012. European consumer confidence, as indicated by the EU’s domestic trade and household survey, has fallen way below previous cyclical lows, such as during the worst points of the Global Financial Crisis (2009), European Debt Crisis (2012) and the COVID-19 pandemic (2020). EA manufacturing has been in contraction since July, with the S&P Global headline PMI index falling in October to its lowest level since May 2020.
Expect earnings contractions next year. European equities earnings estimates have been progressively revised downwards over the course of this past year. The consensus is now for around zero revenue and earnings growth for 2023. But even that may be optimistic. Given the recession either underway or imminent, we expect the more likely outcome is deeper earnings contraction.
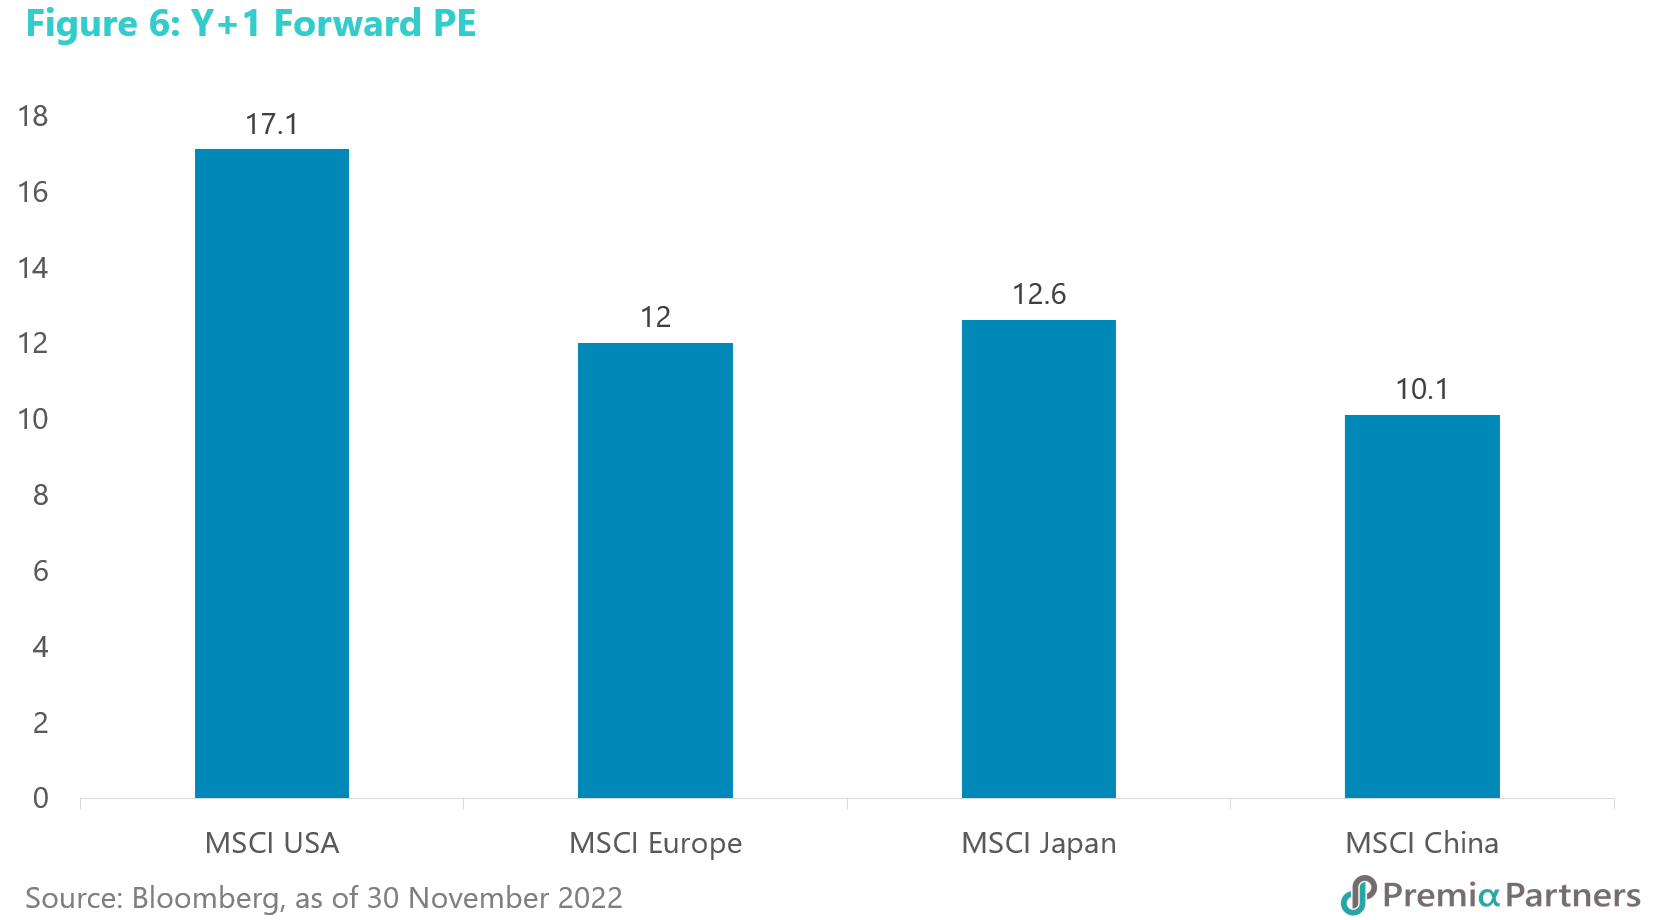
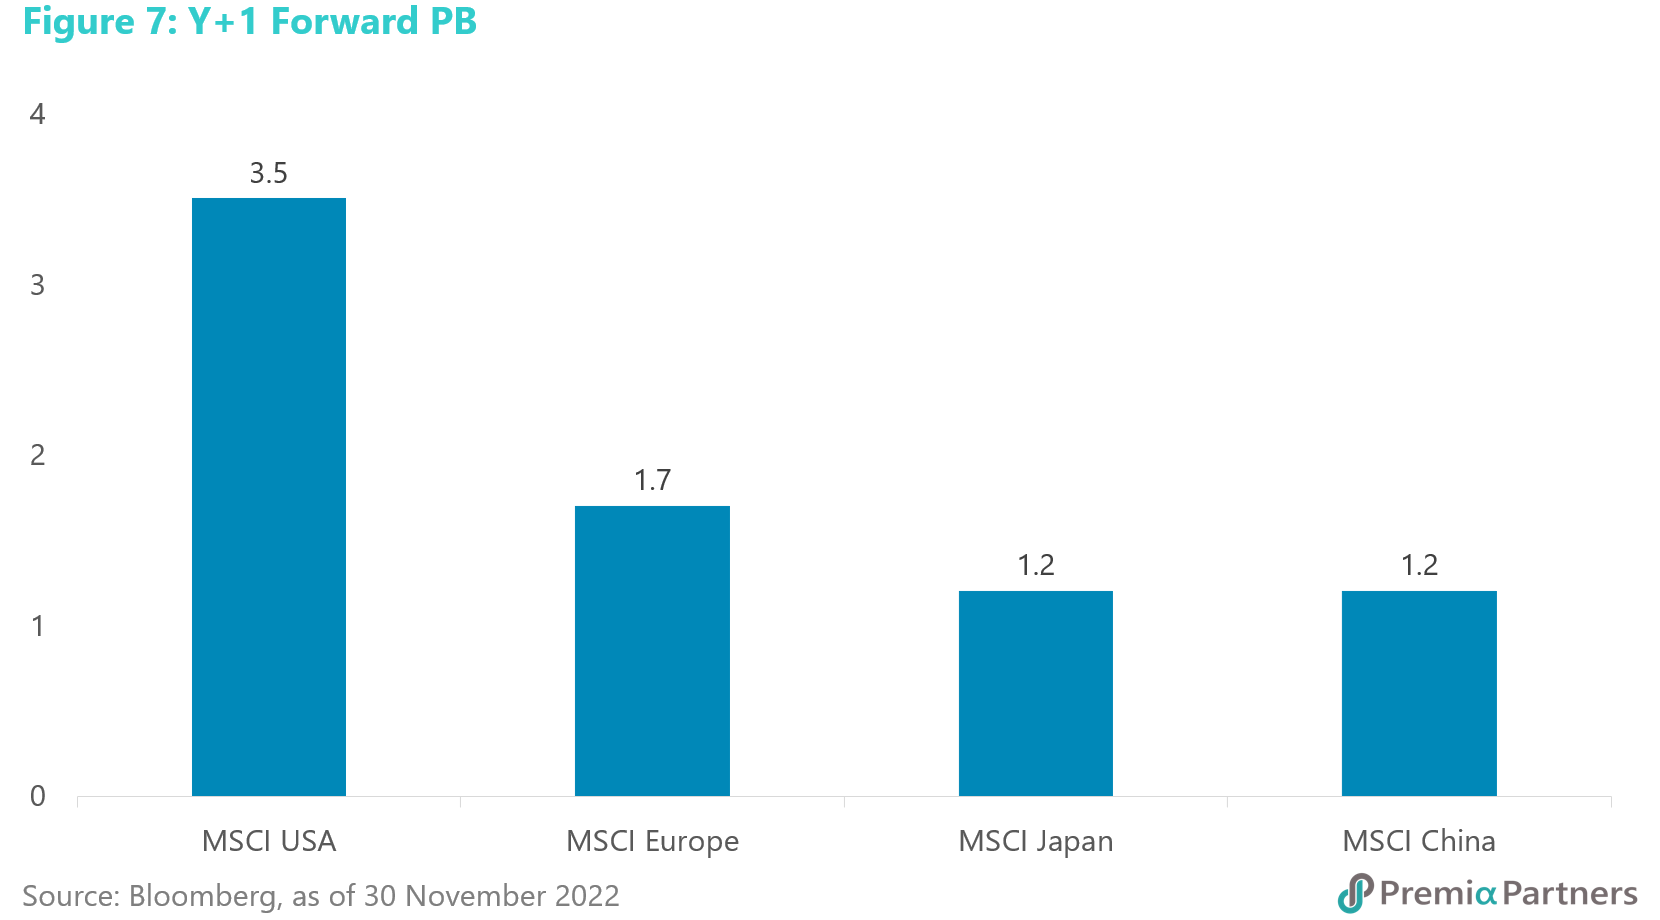
The European market as a value play. European equities valuations are much cheaper though than those in the US. The 1-year forward PE ratio for the MSCI Europe is around 12x, compared with 17x for the MSCI USA. The 1-year forward PB ratio difference is even more stunning, at 1.7x for MSCI Europe versus 3.5x for MSCI USA. Yet, there is of course a discount at play here in European asset valuations, to compensate for higher political risk.
But the geopolitical risk premium is likely to persist. The geopolitical risk premium attached to European markets is likely to persist into 2023. The ECB has constructed a measure of the geopolitical risk premium and a war news index associated with the conflict in Ukraine. Both those indicators peaked immediately after the start of the conflict, retreated but to still elevated levels thereafter, but started rising again in September.
Geopolitical analysts are largely agreed there is no end in sight to the war in Ukraine. Both Russia and Ukraine appear to have dug in for a protracted struggle, with any peace talks likely to be complex and difficult. A war of attrition such as the one in Ukraine typically ends when one or both parties to that conflict exhaust themselves. That can take a long time. Meanwhile, the economic fall out from the war continues – the sanctions, the spending on defence, the risk of refugee flows, knock-on effects from trade and economic linkages, and the dampeners on consumer and business confidence will continue to drain Europe economically.
European equities valuations are broadly similar to Japanese valuations but higher than those for Chinese stocks. So, yes, Europe is a value play market relative to the US. But it has to be noted however that Japan offers a broadly similar value proposition and China offers the deepest value of the four markets which we will come to that later. But for the purposes of looking at positioning in Europe, we would look at European stocks as value plays, in the hope that the market has already priced the worst that can happen from the conflict in Ukraine. Technology, which has a higher earnings duration risk at a time of rising rates, is only 7% of the MSCI Europe index. Technology is 27% of the MSCI USA. Within Europe, the deep value play is however the energy sector, which offers the highest free cash flow yields. But of course, that is also a sector shunned by ESG investors.
Something quite recent to note is that MSCI Europe has been outperforming MSCI USA since late September. That may have been encouraged by speculation of an easing of COVID restrictions in China.
Japan
Value play with a dangerous structural overhang. The Japanese market will likely enjoy in 2023 a higher real GDP growth rate than the US and the Euro Area, with much lower inflation. The Japanese equities market is a value play by conventional valuation metrics, with a 1-year forward price to book ratio of 1.2x, a forward PE ratio of 12.6x, and a forward dividend yield of 2.6% against a domestic government 10-year yield of around zero.
But it is that last bit – the local risk-free rate – that poses the greatest risk to investing in almost anything in Japan, and it is a structural risk that has gone from chronic to acute. The entire economic structure of Japan hangs on what is called “yield curve control” (YCC) – with the Bank of Japan (BOJ) buying everything the Japanese Government Bond (JGB) market throws at it, in order to hold the 10-year yield at close to zero.
So far, it has been successful – hence its nickname “the widow maker” of JGB short-sellers. But this has been tested severely this year and the pressure could get worse next year if the US Federal Reserve continues to hike rates, raising the differential between the 10-year UST yield versus the 10-year JGB yield.
The Yen has already taken a shocking beating this year. A further weakening of the Yen poses a risk to price stability. That is, the BOJ could find itself getting more than it bargained for in its quest to end Japan’s low inflation. A failure to hold the line on the long-term JGB yield poses a risk to debt sustainability in Japan.
Adjusting the admittedly low valuations for the above risks, we would underweight Japanese equities.
Abenomics redux. Over the period 2006-2016, the Japanese equities market was a fairly neat USDJPY correlation play. This was one of the pillars of what later became known as Abenomics, as later formally unveiled by the late Prime Minister Abe Shinzo. Aggressive monetary expansion was the first so-called “arrow” of Abenomics. The idea was that accommodative monetary policies would encourage the Yen to weaken, raise Japanese export competitiveness, lift export earnings in Yen, and ultimately stimulate economic growth.
So, the Nikkei 225 broad trend over 2006-2016 saw the index strengthening on Yen weakening - that is, it went up when USDJPY went up. The reverse was also true. That relationship however blurred from 2016 onwards.
Yen weakness this year pushed up equities returns in the local currency but did nothing for USD returns. While that relationship remains blurred, what is evident is that the Japanese market has been supported over the past year by a weak Yen, with local currency returning from Japanese equities better than US stocks, but slightly worse in USD terms.
Investors took on a huge risk for just maintaining neutral performance in USD terms – that risk was a bet on BOJ holding the line on YCC. Even that neutral performance versus US stocks in USD terms has a particularly risky element, that makes the outlook for 2023 concerning. That neutral performance vis-à-vis other Developed Market equities in 2022 was off the back of an ultra-high stakes stand-off against JGB bears over YCC. This is BOJ’s policy of holding the 10-year JGB yield at zero. As a result, the BOJ has been in a long-running battle against JGB short sellers, standing in the market buying as many JGBs as necessary to hold the 10-year yield at its “line in the sand” level of 0.25%. The upshot of this is the BOJ now owns about half of all outstanding JGBs.
Don’t expect too much from talk of a review of YCC. The market is now expecting a BOJ review of its YCC policy in 1H2023. This expectation has been encouraged by the imminent end of Kuroda Haruhiko’s decade-long term as Governor of the BOJ in April, and by recent comments from senior BOJ officials calling for such a review. We don’t expect much more than a tweaking of the target range for JGB yields and those yields will likely continue to be held at ultra-low levels.
Why the BOJ can’t give up YCC. BOJ doesn’t want to match other central banks on rate hikes. It can’t. The US economy’s nominal GDP growth rate in 2022 so far has been around 10% and its post-war average nominal GDP growth rate is 6.1%. The Fed can hike its target rate to the extent that the 10-year UST yield goes to 5% and still have some buffer for long-term debt sustainability. Japan’s average nominal GDP growth rate from 1981 to 2022 is 1.4%. It won’t take much of a rise in the long-term government bond yield to trigger a debt crisis in Japan.
And if it succeeds in holding the 10-year yield at zero, BOJ could be creating other problems. The BOJ is likely to have let the Yen devalue even further as the price of holding down government bond yields. So far, its inflation has been much lower than those in other Developed Market economies, and its economic growth outlook for 2023 is also a bit better than the US and the Euro Area.
But if USDJPY surges back to 150, Japan could over time get a much higher inflation rate than its 2% target. The risk is that once the inflation genie is out of the bottle, it could then cause the BOJ to lose control of everything - price stability, the Yen, and the government bond yield.
We don’t want to overstate the likelihood of that given that Japanese wage inflation is very low, in the 1%-2% range. But then again, US wage inflation was only 2.7% y/y up until 2Q2021. Also, if the Yen doesn’t weaken again to support the economy and Yen-denominated earnings, where is the compelling argument for Japanese stocks?
Emerging Markets
Asian Emerging Markets are structurally more resilient to rising US rates and are beneficiaries of gradual easing of COVID health controls in China. Rising rates and a strengthening Dollar have never been kind to Emerging Markets (EM). But with the markets looking to a peaking of US rates in 1Q2023, EM could continue its very recent outperformance against the Developed Markets.
On economic fundamentals, EM Asia economies are structurally more resilient than others, their growth rates higher, and inflation rates lower. A gradual easing of COVID control measures in China could deliver upside surprises to expectations of economic and earnings growth for China. And there could be spill over benefits to the ASEAN-5 through their economic linkages.
We discriminate within the EM space, overweighting deep value equities in China, overweighting ASEAN, and underweighting EM ex-Asia.
China has been leading the recent EM equities bounce. Periods of a strong US Dollar have historically seen portfolio outflows from Emerging Markets. This time has been no different, with rising US rates and yields driving outflows from Emerging Markets from April of this year. But a rebound in the MSCI Emerging Markets from late October, driven by net inflows into EM for the month, may have signalled a change in sentiment. With the CSI 300 and MSCI China rebounding in tandem with the MSCI Emerging Markets, we should also see substantial net portfolio inflows into China as well. Indeed, MSCI China has been outperforming MSCI Emerging Markets on this rebound.
EM may be starting to look past further US rate hikes in 1Q2023. Looking forward to 2023, the early months could be more challenging for EM than the rest of the year. US rates and yields are likely to continue rising through 1Q2023, with the possibility of rate cuts in 2H2023 if the US economy enters a recession, as we expect it to.
Within EM, we differentiate between Emerging Markets Asia and others. The policy buffers are better in EM Asia and there is little financial stress – the increases in sovereign debt spreads for EM Asia in 2022 over 2021 have been the smallest within EM.
For the coming year, inflation is likely to remain much lower and real GDP growth is likely to remain some of the strongest in the world. For example, EM Asia and ASEAN-5 GDP growth rates are both expected by the IMF to come in at 4.9% for 2023, versus 0.6% for EM Europe, and 1.6% for South America. EM Asia inflation is expected to average 3.3% for the year, versus 19.4% for EM Europe and 14.3% for South America.
The China “COVID pivot” could be the biggest theme on global markets in coming months. Within EM, China could enjoy the biggest upside to expected economic growth for 2023 if the steps recently undertaken towards an easing of COVID-19 restrictions continue. The indiscriminate selling of Chinese equities has created deep value opportunities. China’s return to a post-COVID normality was always inevitable and the bearish “forever COVID” narrative was unsustainable. We may be past peak China-pessimism. China could enjoy in 2023 the sort of reopening boost to economic growth seen in the ASEAN economies this year. This is likely to be boosted by policy support already undertaken.
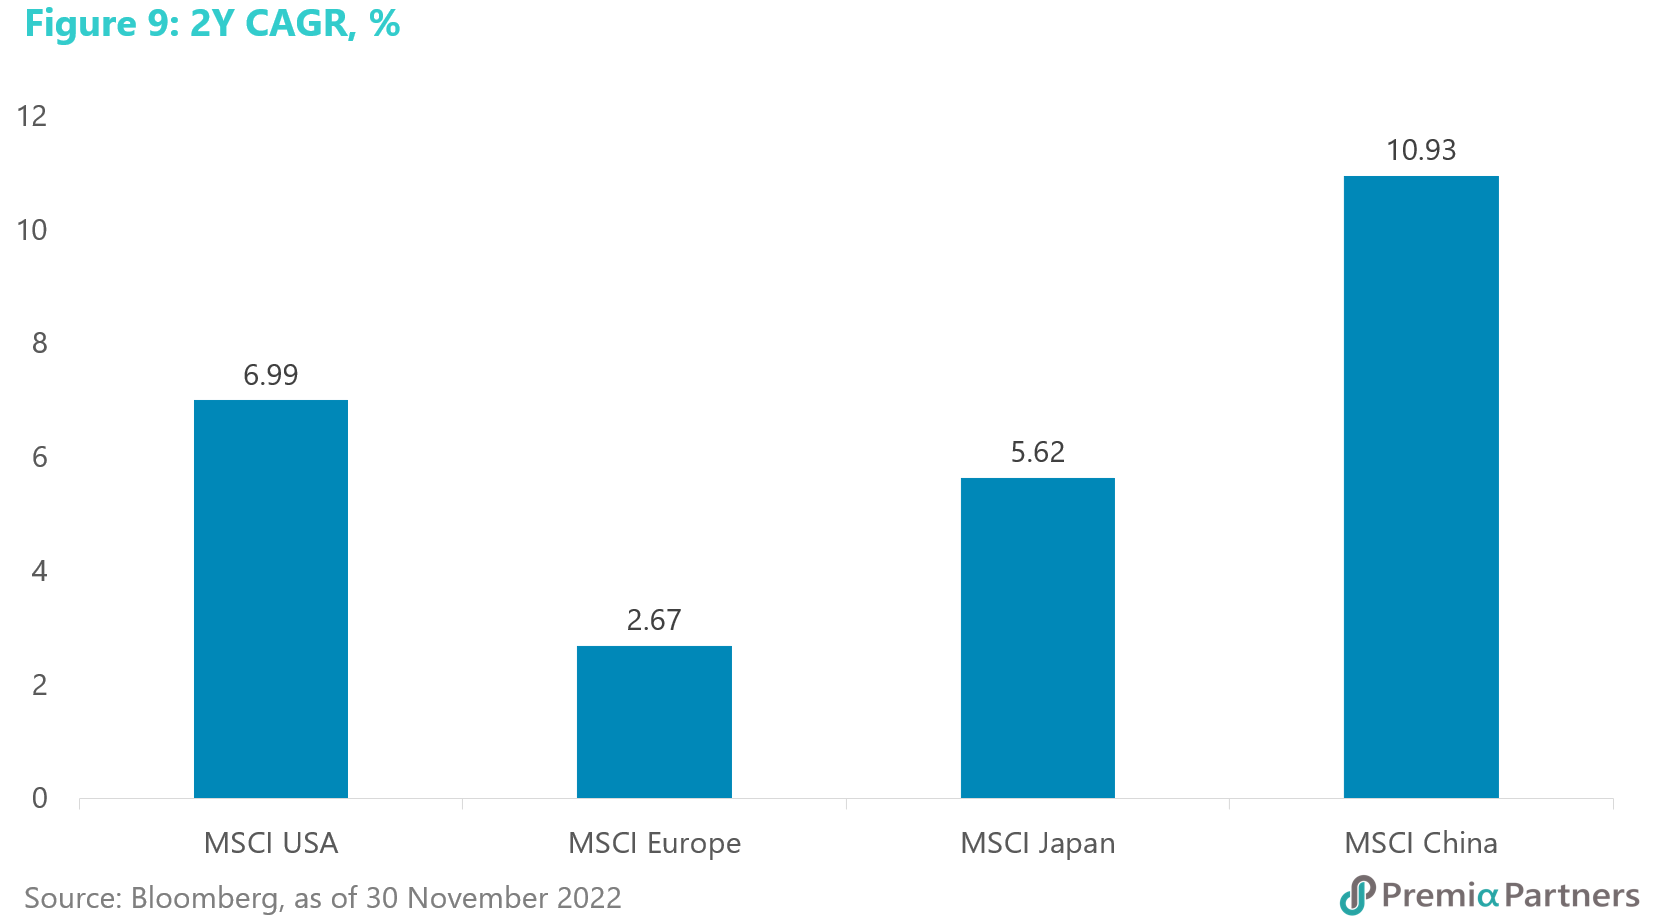
While China’s economic growth rate for 2022 - estimated by the IMF at 3.2% - is likely to be much lower than in 2021, it will still be higher than the 2.4% expected of Advanced Economies and 1.6% for the US. When you look at 2023, the outlook is for recessionary conditions in the Advanced Economies next year against 4.4% for China and that 4.4% forecast was made in the run-up to October before the very recent easing in COVID control measures. Earnings growth estimates were already stronger for China versus US, Europe and Japan, even before the recent COVID control easing.
MSCI China’s one year forward earnings growth is estimated by Bloomberg at 7.8%, versus 4.3% for MSCI USA, -0.7% for MSCI Europe, and 4.6% for MSCI Japan.
Chinese equities – a valuation perspective. Using the MSCI indices as proxies, Chinese equities generally offer the best valuation compared to the US, European and Japanese markets.
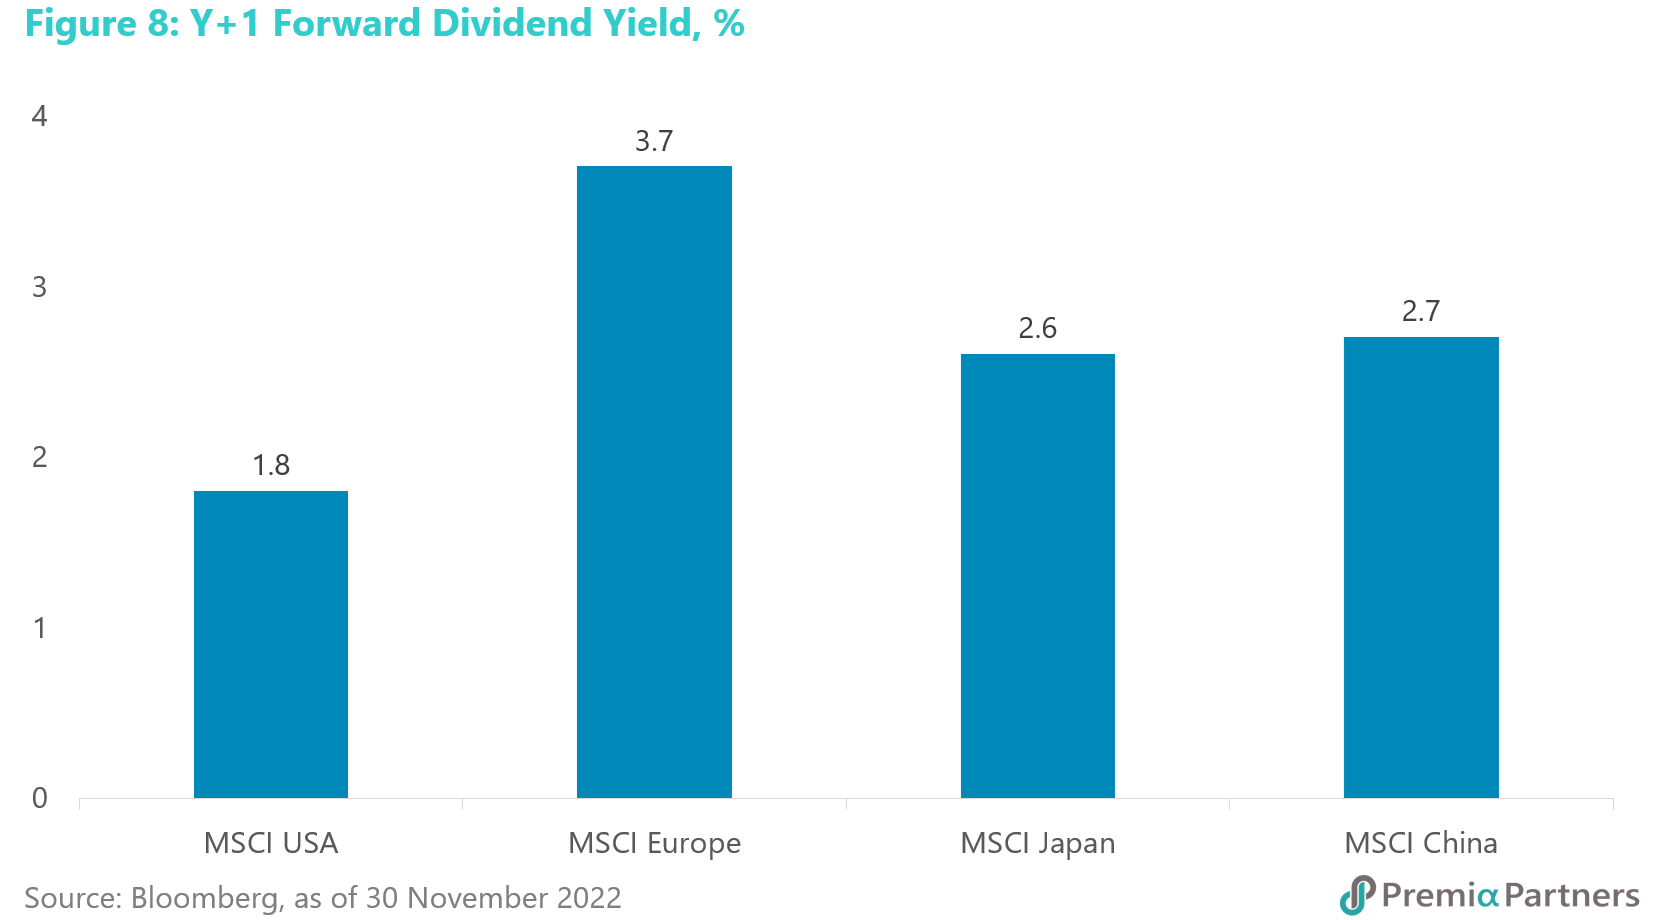
And they are the only growth play amongst them. Chinese stocks only lag their European counterparts on dividend yields. But European dividend yields would have been boosted by energy stocks’ high free cash flow, which are both volatile and unacceptable to ESG investors.
