We are intrigued to see how Graham’s principle behaves in China-A this year. Inside the book, there is a section called “Stock Selection for the Defensive Investor”, which lists out some filters to avoid over speculative stocks and to build a portfolio for long-term appreciation. Although our China Bedrock Economy strategy is not built using the same filters that the book suggested, we are keen to review how well Bedrock fits this definition of a portfolio for long-term appreciation. Throughout the article, we will use FY 2018 financial data and bottom-up median to calculate the valuation metrics for comparison.
Size is one of the important measures when looking for stability. Graham used revenue to measure size and recommended that each industry should exceed certain limits. Since our market is China and revenues have grown since Graham’s recommendation decades ago, we would not apply the same absolute numbers directly. Instead, we compare Bedrock with a large cap index (CSI 300) and a small cap index (CSI 500) to examine a company’s scale on a relative basis. The median revenue of Bedrock constituents is RMB 17.6 billion while CSI 300 is RMB 25.3 billion and CSI 500 is RMB 7.2 billion. Bedrock falls between CSI 300 and CSI 500 in terms of company size but is closer to large and mid-size companies.
Graham also looked at financial health for stability, and used working capital, current ratio and debt-to-equity value. Current ratio and working capital are more applicable to industrials and utilities. Since Bedrock and CSI 300 have a significant allocation to financials, we will focus on the debt-to-equity metric here. Bedrock’s median is 66.4% while CSI 300 is 70.1% and CSI 500 is 56.0%. Bedrock again falls between CSI 300 and CSI 500 indicating that it is not overleveraged. Up till now, Bedrock fulfils Graham’s size and financial health requirements.
Other than stability, Graham also looked at earnings growth, not to find high growth companies, but to look for companies that can keep up with inflation. He suggested that the growth of three-year average EPS over the last 10 years should have increased by one-third, which is roughly the same as an annual inflation of 3%. If we apply the same measures to Bedrock, the median is 147% which is well above the inflation target and is again between CSI 300 (251%) and CSI 500 (130%).
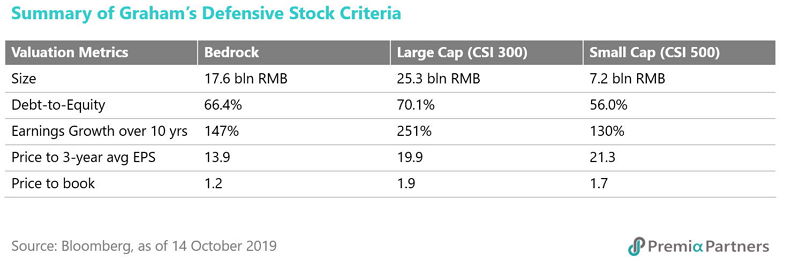
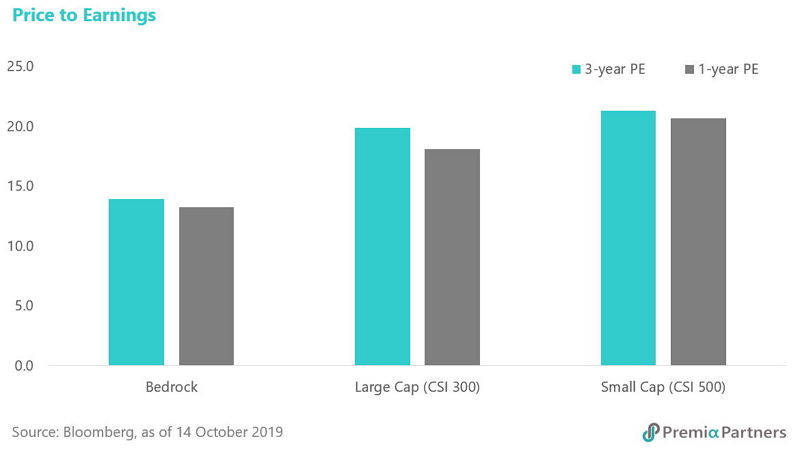
In terms of valuation, Graham suggested not to include stocks with price to three-year average earnings multiples over 15 to avoid overpaying. He used three-year average to smooth out the growth effect. To show the effect of three-year average EPS, we plot three-year average PE and one-year PE using Fiscal Year 2018 earnings side by side below. All one-year PE metrics are smaller than three-year averages, indicating that earnings in general are growing. However, Bedrock’s and CSI 500’s three-year average PE are only 0.6 point higher than the one-year PE while CSI 300 is 1.5 points higher. If the growth in CSI 300 is not sustainable, CSI 300 may suffer a larger drop. Among the three indexes, only Bedrock meets Graham’s requirement of having a three-year average PE below 15.
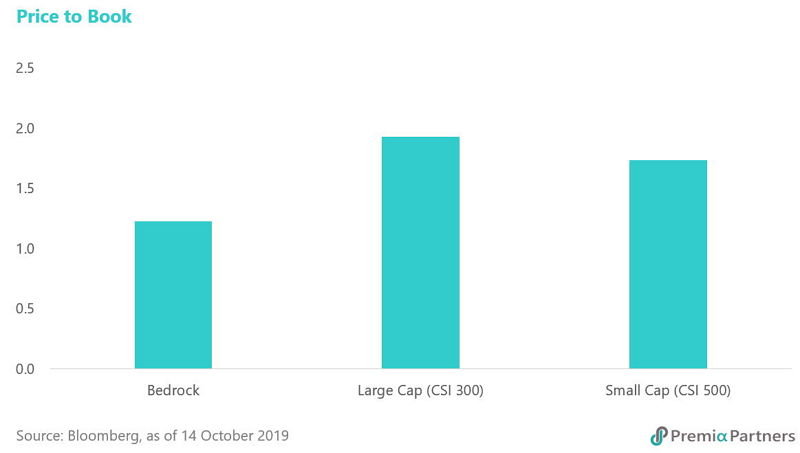
In addition to PE, Graham also suggested a Price to Book Value of less than 1.5. Again, Bedrock meets the criteria but the other two benchmarks don’t. Bedrock’s PB is at 1.2 while CSI 300 and CSI 500 are 1.9 and 1.7 respectively.
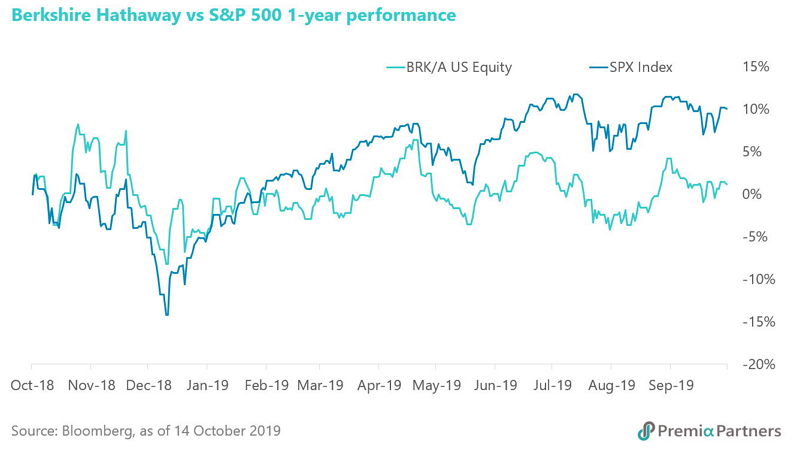
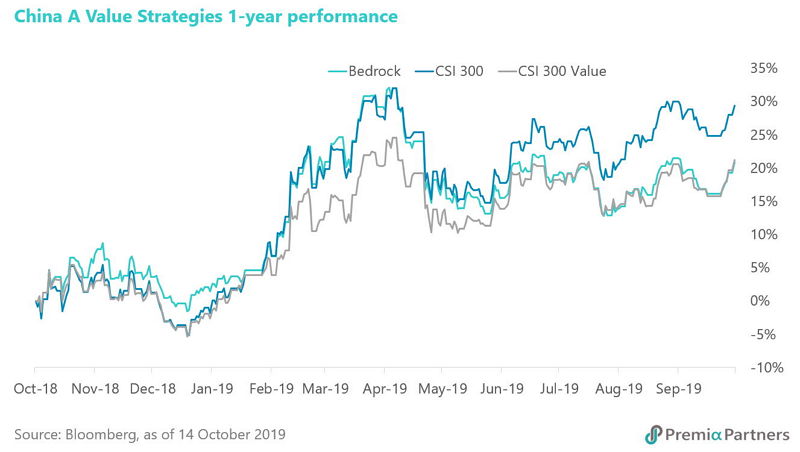
Despite Bedrock qualifying for all the above filters, it’s easy to ask why now is a good time to invest in Bedrock after it has underperformed CSI 300 by 8% in one year. First, let’s see if this is unique to the Bedrock index construction or if it is a common phenomenon from value underperformance. Coincidentally, Warren Buffett, a disciple of Graham, following a similar investment strategy as Graham and beating the market most of his career, found his investment flagship, Berkshire Hathaway, also underperforming the US market by more than 8% over the last 12 months. Similarly, the CSI 300 Value Index underperformed by a similar extent, more than 8% in China A-shares market. Would value investing continue to underperform in the short-term? Possible. Would value investing underperform indefinitely? Highly unlikely.
Second, in Bedrock’s historical performance, it has never underperformed the CSI 300 for two consecutive years. If history repeats, Bedrock may well be the investment strategy for China A that bears rewards next year.
Graham looked at two more filters that we didn’t cover here. They are earnings stability, which requires the company to have positive earnings in every year of the last ten, and dividend stability, which requires the company to pay dividends for the last twenty years. These criteria may have meaning at an individual stock level, but less so at index level because all the earnings and dividends summed up from an index are likely to be positive every year. Nevertheless, Bedrock meets most of Graham’s defensive stocks criteria and seems to be at a reasonable price level in both absolute terms (price multiples) and relative terms (recent underperformance). A conservative investor who looks for long-term appreciation may consider putting Bedrock in a watchlist, or may start to add in small pieces, on the expectation of outperformance in the future.
Last but not least, we would like to share one of our favorite quotes in the book here. “Mr. Market, an obliging fellow who turns up every day at the shareholder's door offering to buy or sell his shares at a different price. Often, the price quoted by Mr. Market seems plausible but sometimes it is ridiculous. The investor is free to either agree with his quoted price and trade with him, or ignore him completely. Mr. Market doesn't mind this, and will be back the following day to quote another price.” It’s easy to be led by emotion and short-term volatility into making irrational decisions, but it is wiser to invest when prices are depressed and the assets are "on sale."
Related Premia ETF ticker:
Premia CSI Caixin China Bedrock Economy ETF – 2803.HK/9803.HK