On June 8 last week, the underlying indexes of our ETFs, Bedrock Economy (2803.HK) and New Economy (3173.HK), went through their first reconstitution since the funds launched in October last year. Since the methodology involves fundamental financial data such as revenue, profit margin, cash ratio, accruals and R&D ratio, it is more prudent to use the audited and comprehensive data from the companies’ annual reports, rather than quarterly reports. These annual reports are usually released in early second quarter of the year and thus the rebalance occurs in early June. In this post, we’d like to review the rebalance and the resulting exposure in our ETFs.
Index overview and fundamentals
Source: Bloomberg, Premia Partners as of 2018/06/11
The Bedrock Economy Index continues to capture high quality and real economic growth. With 300 index constituents, the index covers 67.8% of the total profit listed in the A-share market, which is over 3,600 companies. The higher portion of profit relative to revenue indicates higher profitability of the index constituents relative to the market overall.
Source: Bloomberg, Premia Partners as of 2018/06/11
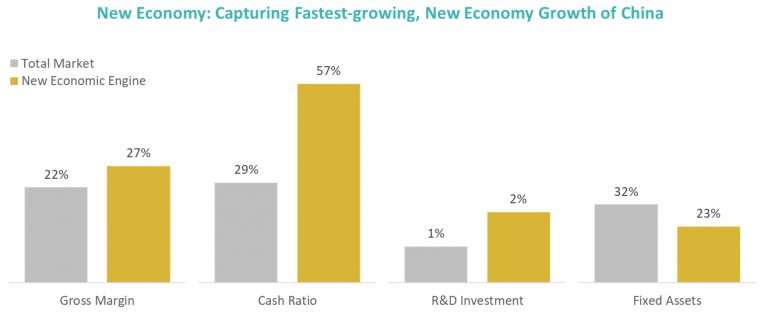
The New Economy Index has a different goal – prioritizing a basket of fast-growing companies focusing on new economy related sectors. Stock selection tilts to financially healthy, asset light and productive growth stocks, resulting in 300 index constituents that have higher gross margin, better cash ratio, stronger R&D investment and lower fixed asset ratio.
Valuations
Source: Bloomberg, Premia Partners as of 2018/06/11
The Bedrock Economy Index is trading at a PER of 12.43x relative 14.38x for CSI 300, the main China A-share benchmark. It has persistently exhibited a value tilt for China A-shares, despite also having more mid/small stocks in its universe. In addition, it has a lower Price to Book and EV/EBITDA but a better dividend yield. We list FTSE China A50 for reference but given the mega-cap and financials tilt, direct comparison vs the Bedrock Economy Index is less relevant.
On the New Economy Index side, the story is quite similar. It offers a better valuation with a PER of 22.58x relative to 24.12x for CSI 500. Similarly, the yield is higher, though Price to Book and EV/EBITDA are higher in this case. The comparison vs ChiNext, which many treat as the default benchmark for China new economy, is even more stark. ChiNext PER is 54.65x, materially higher than the New Economy Index. Its dividend yield is only 0.56 vs 1.46 for the New Economy Index, which tilts toward financially healthy and profitable stocks, allowing a higher dividend yield to be returned to investors.
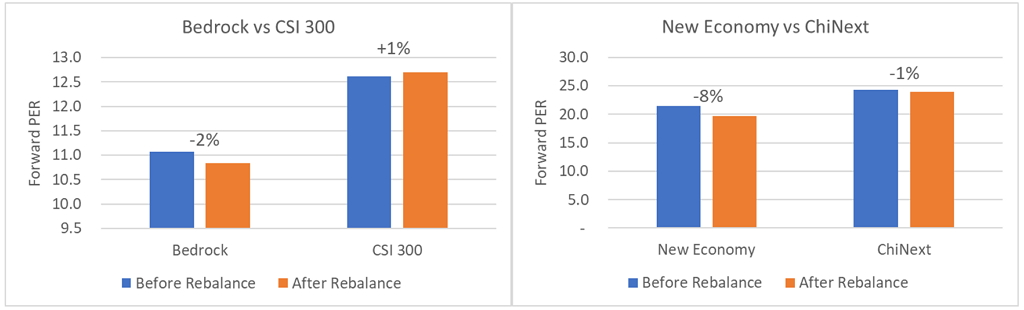
The rebalance also ensures that both strategies follow fundamentals closely. Looking at just one measure of fundamental value, forward PER, you can see the improvement on the day of the rebalance in both Bedrock Economy Index and New Economy Index relative to CSI 300 and ChiNext.
Source: Bloomberg, Premia Partners as of 2018/06/11
Sector breakdown
Source: Bloomberg, Premia Partners as of 2018/06/11
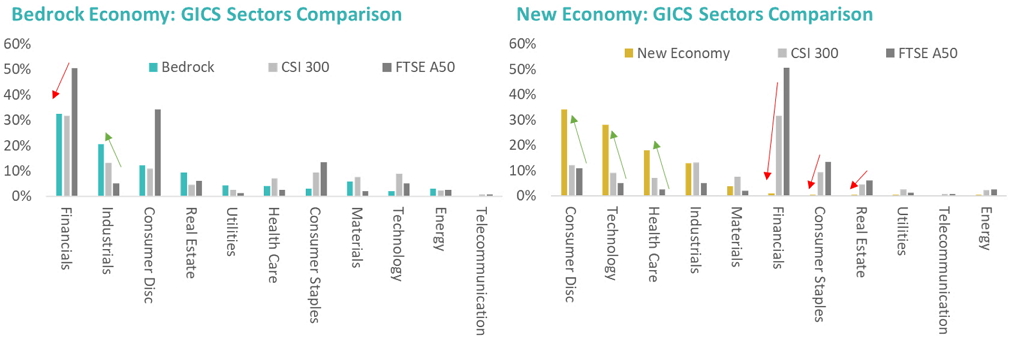
For Bedrock Economy Index, Financials remained the top sector with a weight of 32.6%, followed by Industrials (20.5%) and Consumer Discretionary (15.4%). The overall sector breakdown looks relatively similar to CSI300, but as mentioned above is different from FTSE A50 given the 50%+ weight in financials in that index. For New Economy Index, Consumer Discretionary, Technology and Healthcare continued to dominate the index with a combined weighting of 80%. The exposure in these few sectors ensure that the index will be well supported by China’s structural changes such as consumer upgrade, technological advancement, and an aging population.
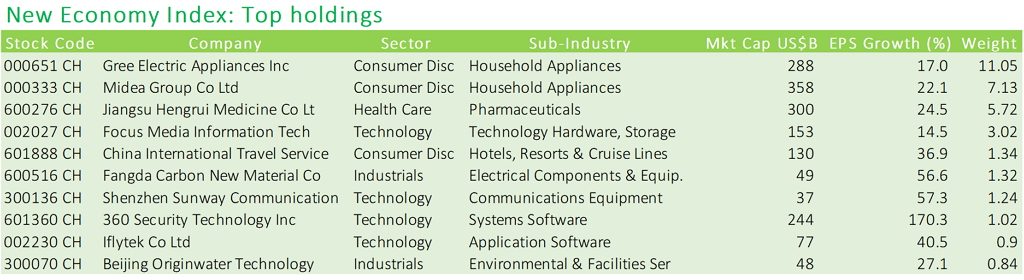
Top holdings and weightings
Source: Bloomberg, Premia Partners as of 2018/06/11
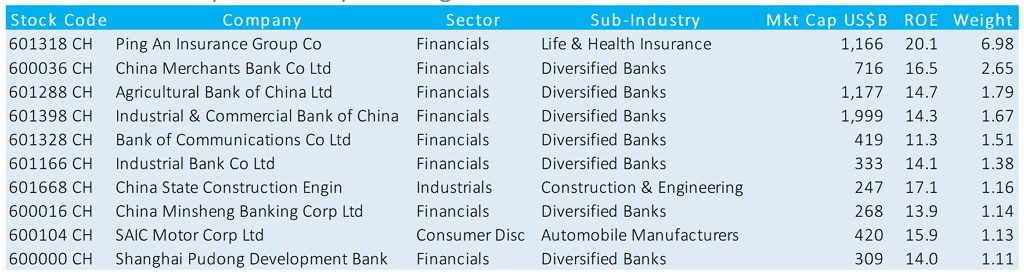
Unsurprisingly, most of the top holdings in the Bedrock Economy Index are financials, including nationwide banks and insurers. These are the largest firms in China. The exceptions are China State Construction Engineering and SAIC Motor. The former is a leader in construction industries with exposure to both infrastructure and real estate while the latter is the largest automaker in China, operating JVs with Volkswagen and General Motor. Most of them have a relatively high Return on Equity due to the financial health check in the index methodology.
Source: Bloomberg as of 2018/6/11
For the New Economy Index, top positions look more diversified with business in household appliances/robotics, pharmaceuticals, media advertising, leisure/traveling, graphite electrodes, communication equipment, cybersecurity, artificial intelligence, and sewage treatment. New economy, all aspects of it, and nothing else. Compared to mega caps like the big 4 state-owned banks, these new economy focused companies may look small by market cap, but they are undoubtedly the leaders in their respective sub-industries. They won’t be small forever though, as the New Economy Index prioritizes productive growth in its weighting methodology, which you can see reflected in the estimated Earnings per Share (EPS) Growth column above.
Major addition post rebalancing
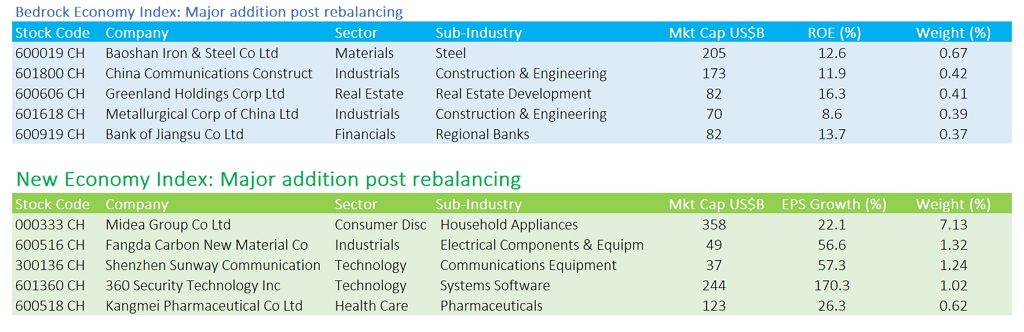
Source: Bloomberg as of 2018/6/11
For the Bedrock Economy Index, the major additions are Baoshan Iron & Steel, China Communications Construction, Greenland Holdings, Metallurgical Corp of China and Bank of Jiangsu. The recovery cycle in both commodities and real estate has resulted in improved financial health for these stocks and led to their inclusion.
For the New Economy Index, the new additions include Midea Group, Fandga Carbon New Material, Shenzhen Sunway, 360 Security Technology and Kangmei Pharmaceutical. Midea’s financial health score improved due to better accruals and cash ratio numbers, leading to its inclusion during this rebalance. 360 Security Technology returned to the A-share market via backdoor listing (reverse takeover of an A-shares listed company) late last year after privatization of its US ADR in 2016. Unsurprisingly, these newly added companies score highly on profitability and R&D, leading to significant growth expectations for the coming years.
I hope this was a useful update on the indexes used by 2803.HK and 3173.HK. Over the last few months, we’ve been busy at work on our next 2 strategies, which will make it easier than ever to capture the multi-faceted nature of Asian economic growth. Watch out for details on our plans in our upcoming posts.
Regards,
David, Alex