
A view of China’s economy compared to EM ex-China, in charts. How does China’s economic growth track record and indeed, outlook, compare against those of its Emerging Market peers? For this exercise, we have used the MSCI Emerging Markets ex-China’s key constituents for comparison. And they are India, Brazil, South Korea, Taiwan, and Saudi Arabia.
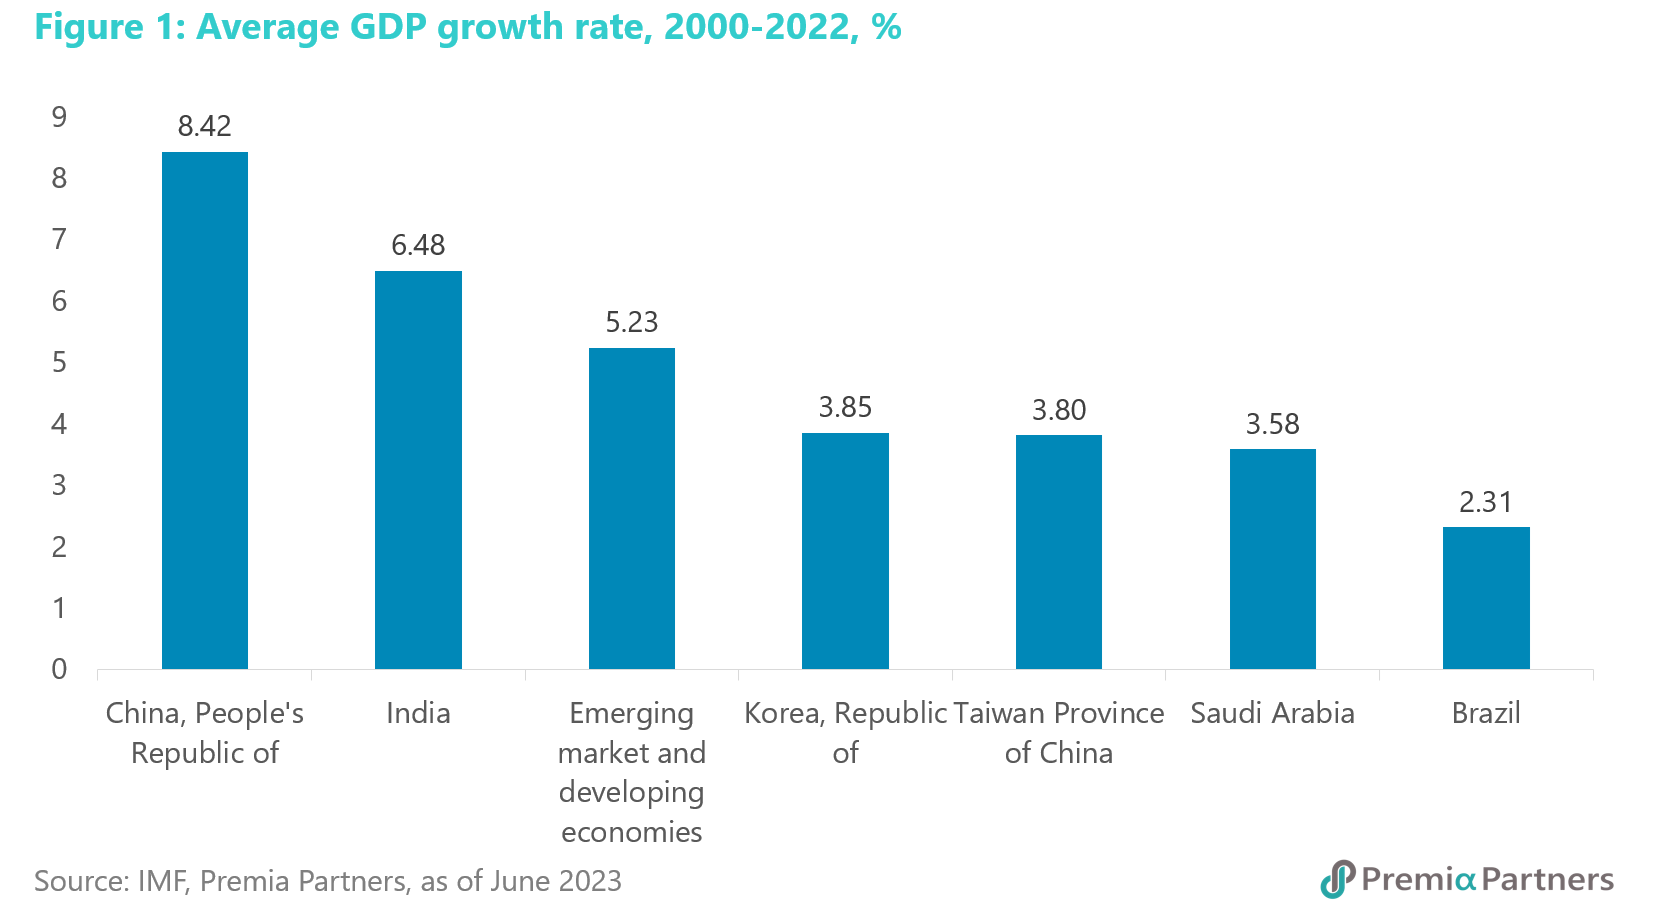
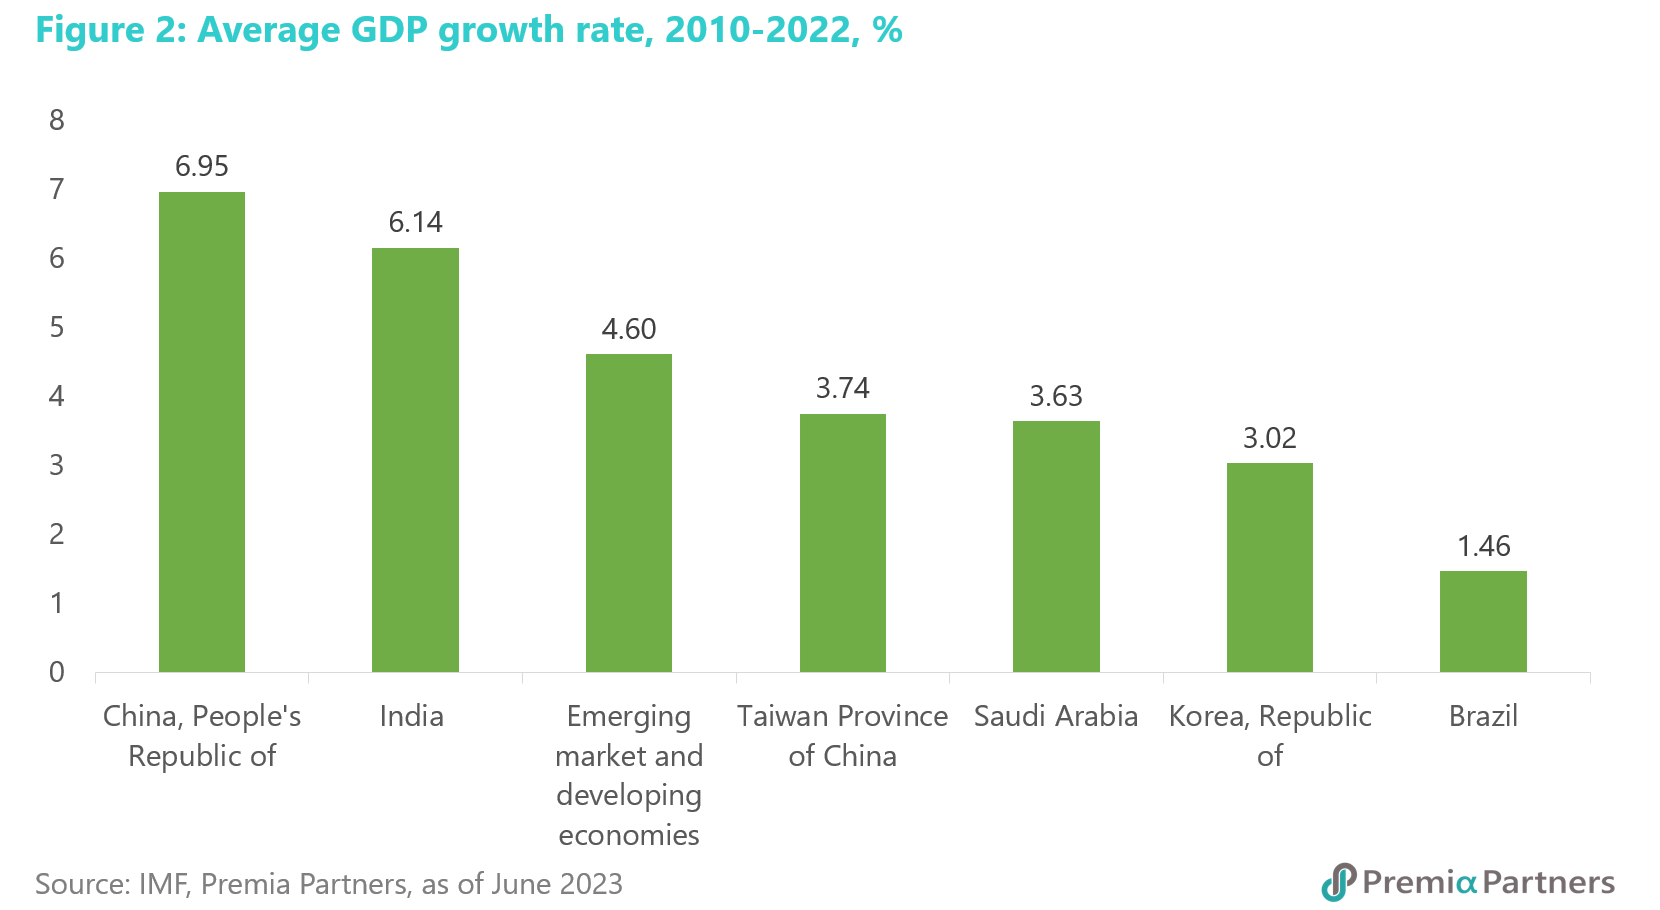
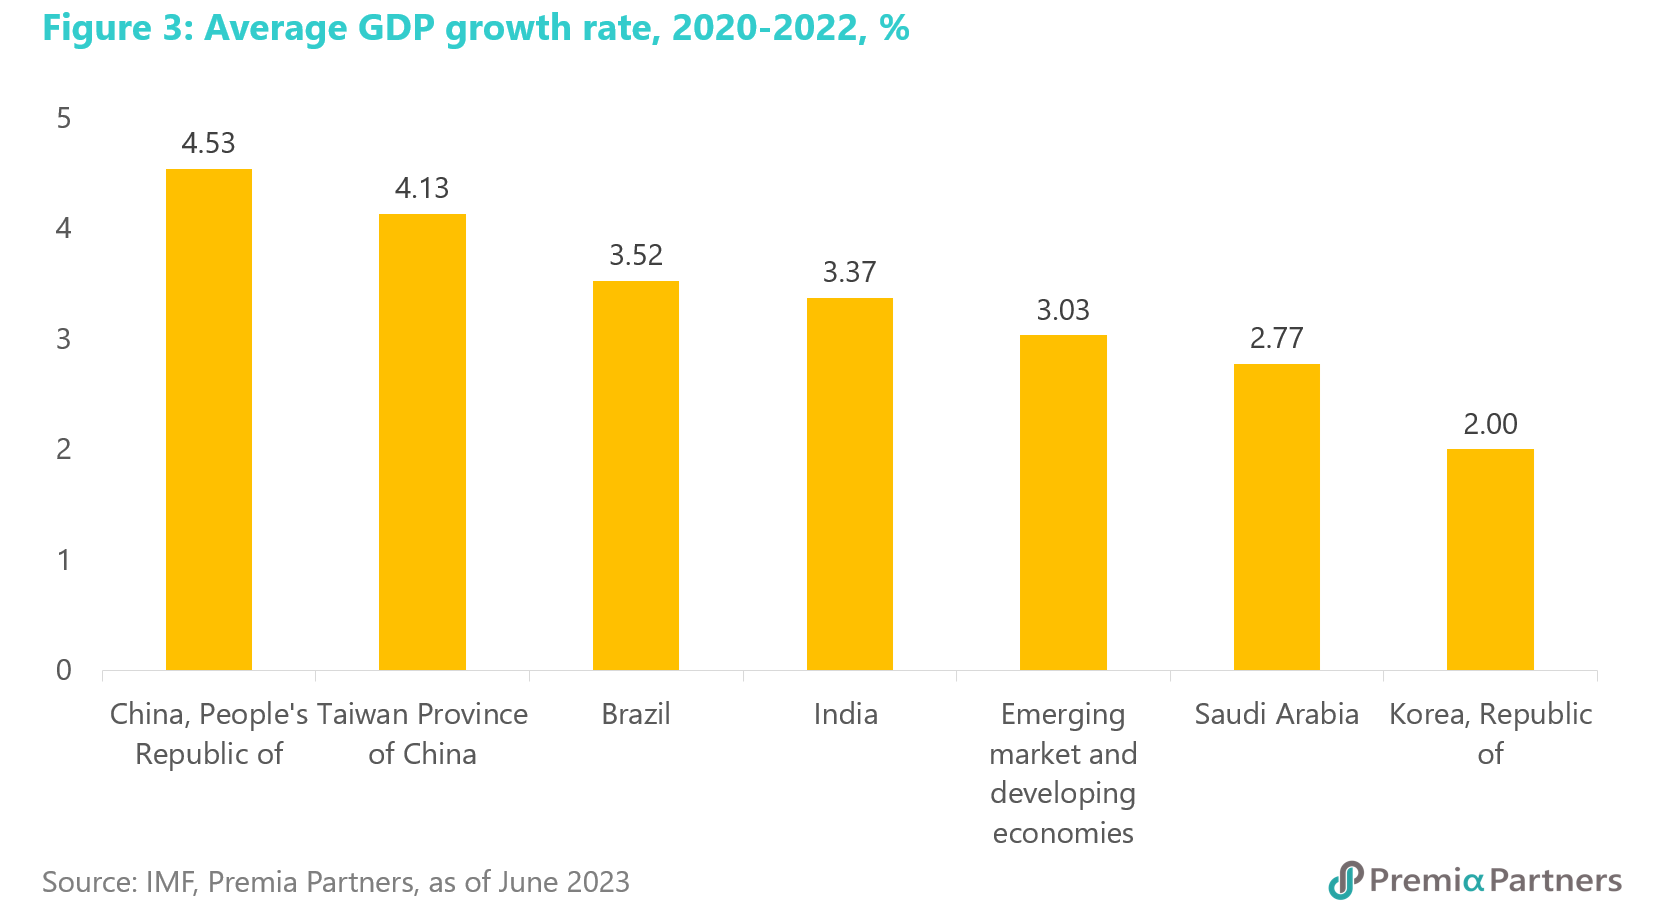
China was tops for real GDP growth over three different periods. Over three different time periods – that is, from year 2000 to 2022, from 2010 to 2022, and 2020-2022 – China’s average real GDP growth stood out as the highest in the grouping.
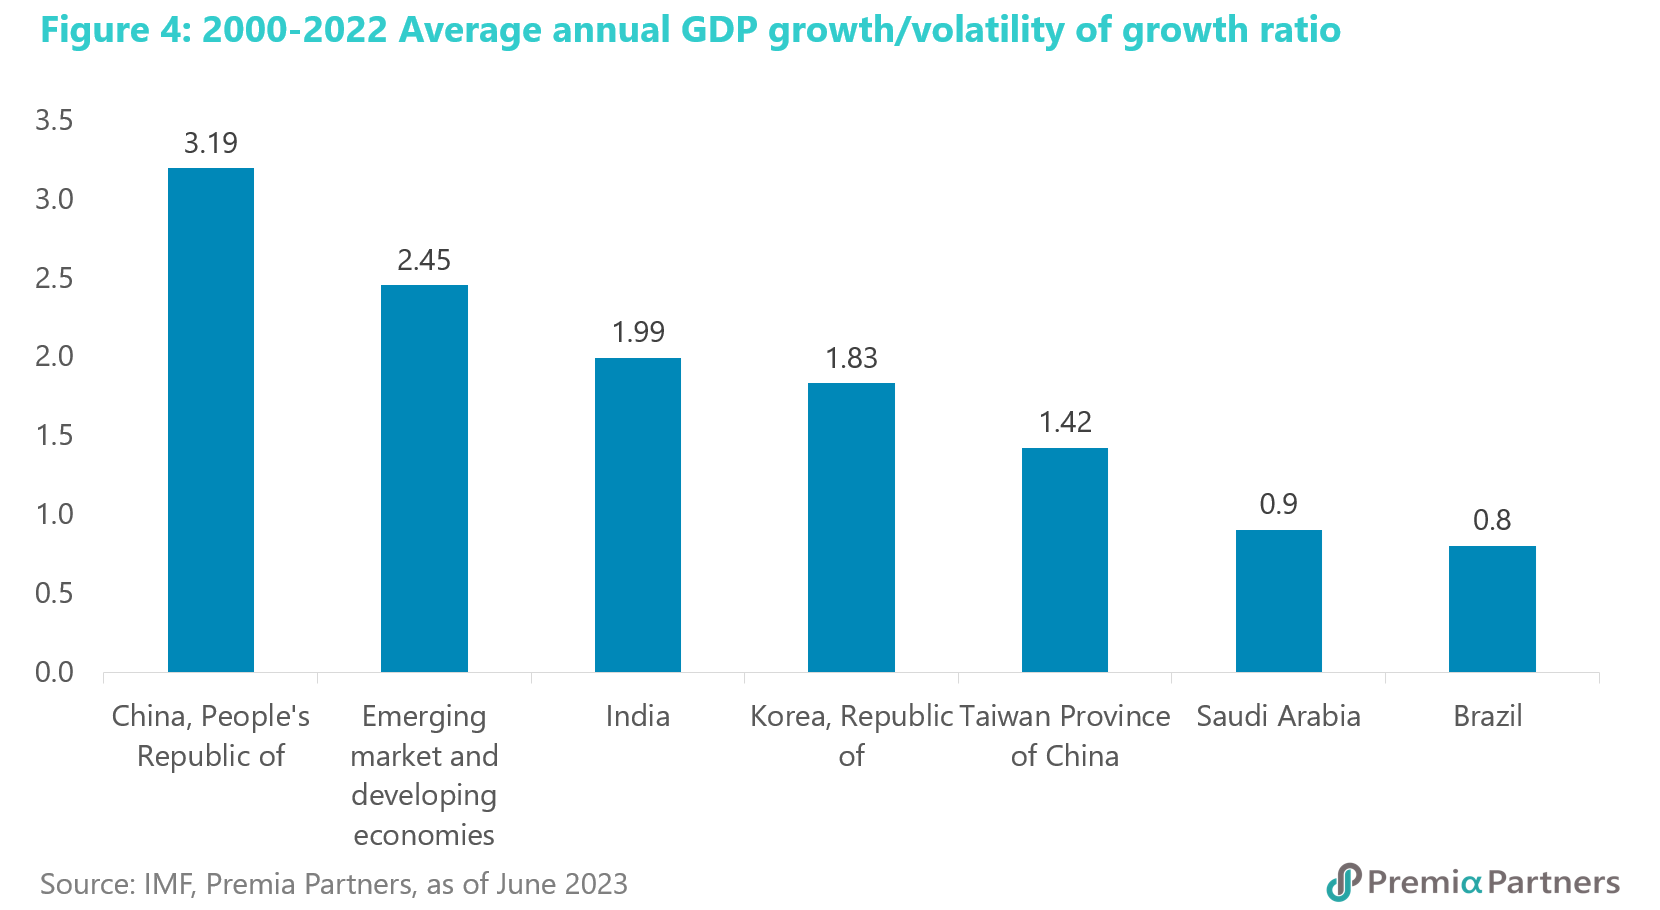
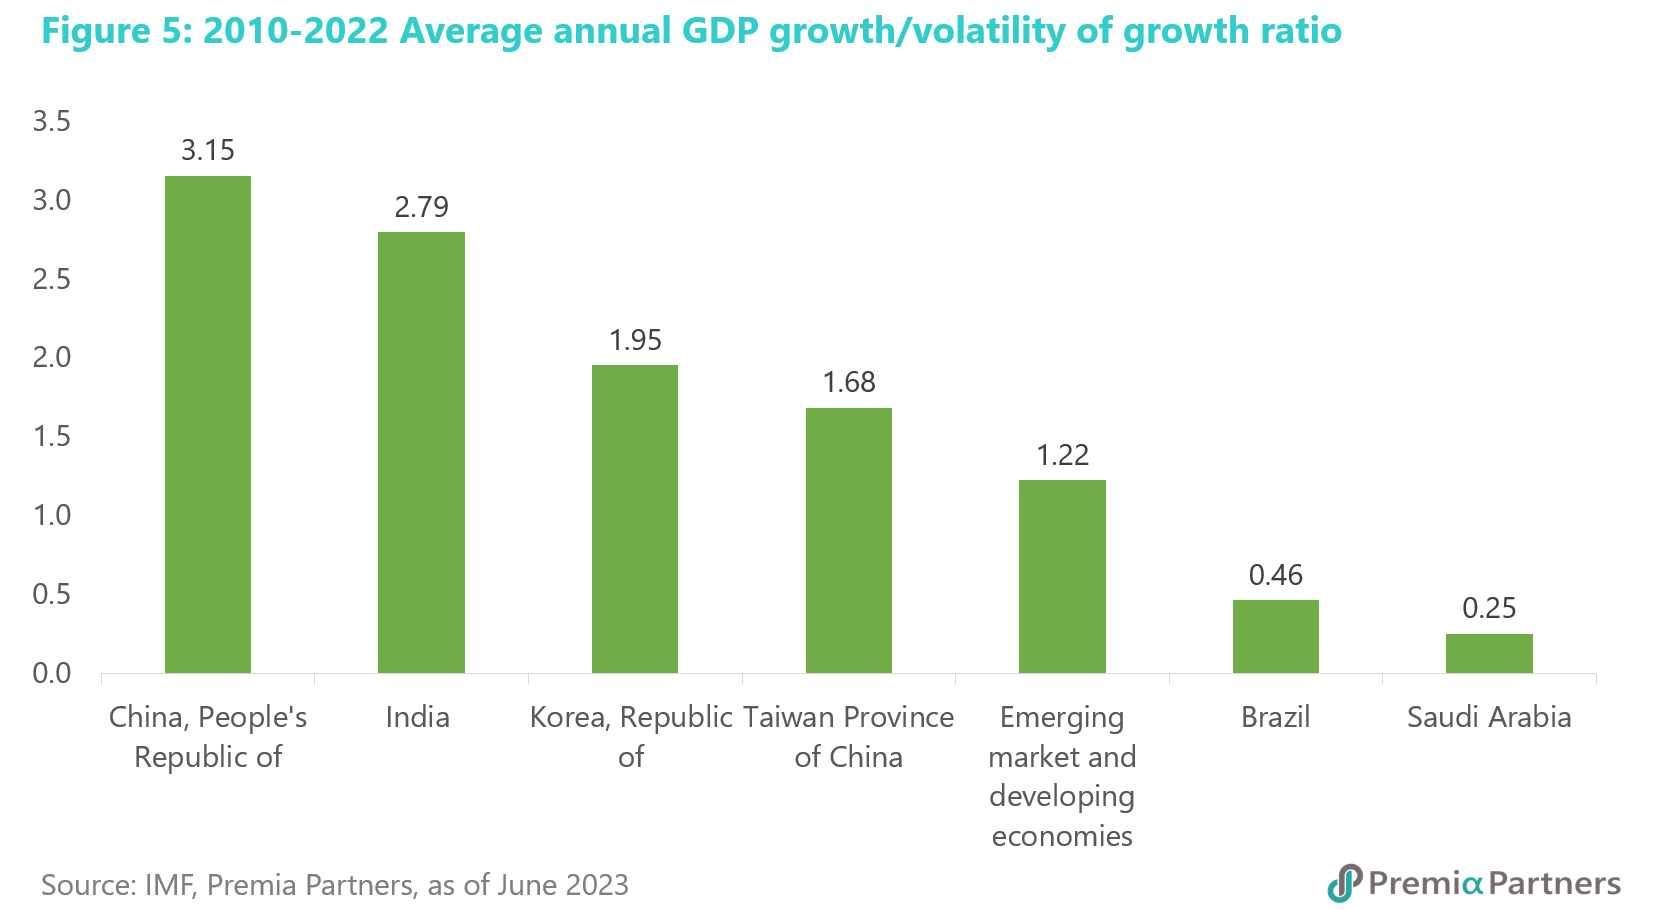
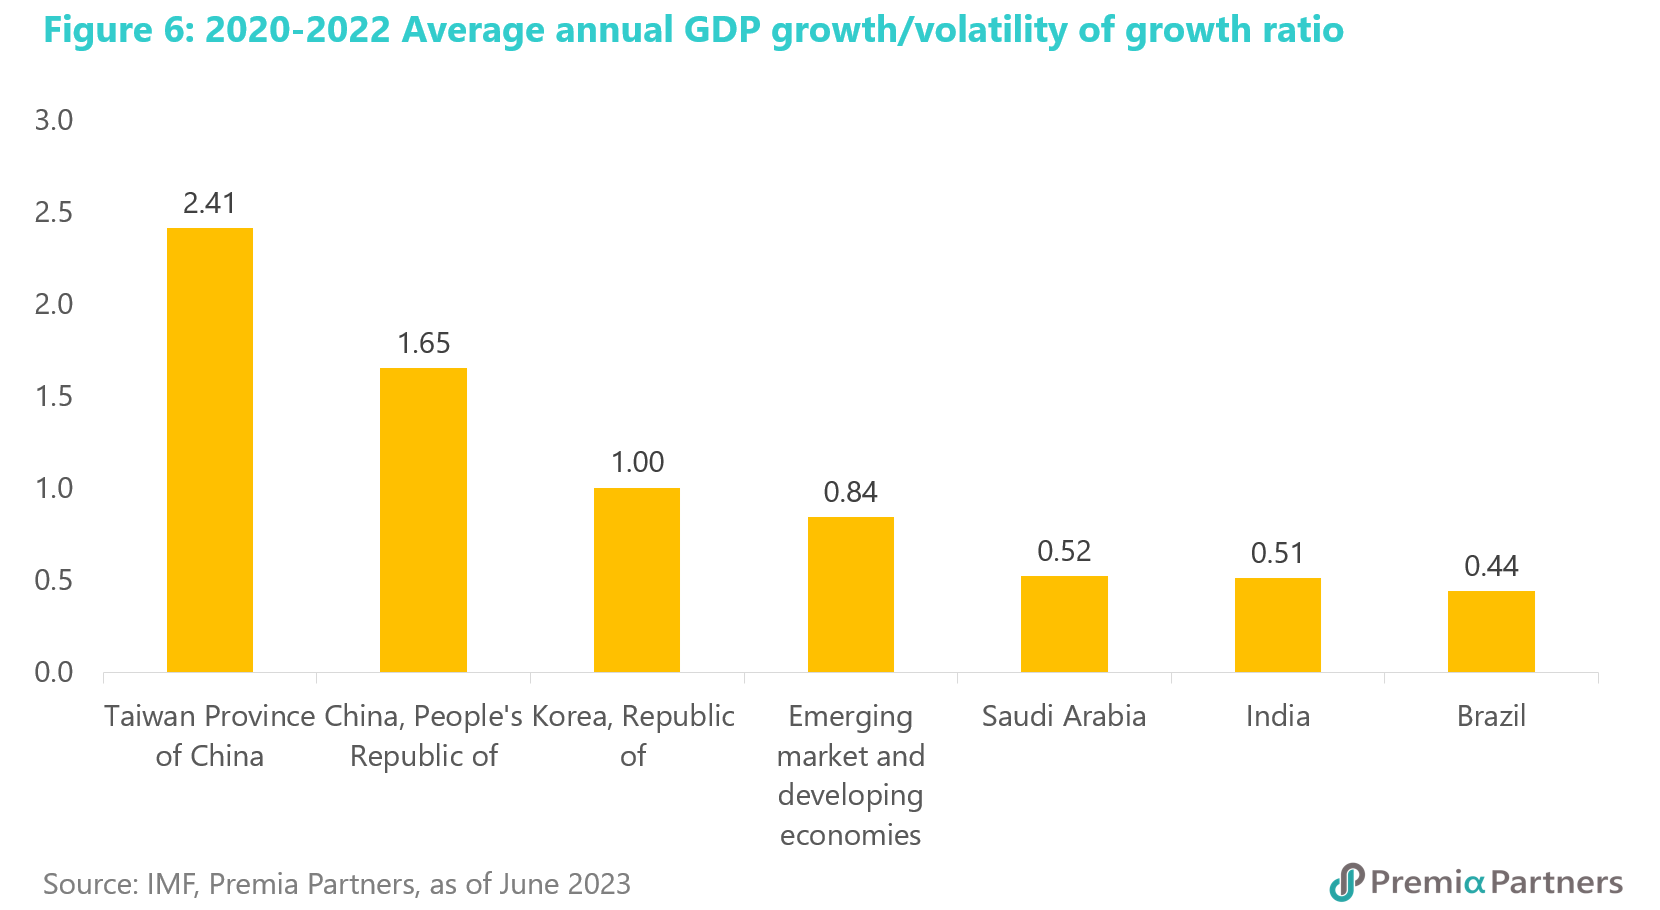
 China was tops for volatility-adjusted growth in two of the three periods. China emerged at the top of the tables as well for volatility-adjusted real GDP growth for two of the three periods examined. For this, we looked at the ratio of the average real GDP growth divided by the standard deviation of the annual growth figures. China was at the top of those tables for the periods 2000-2022 and 2010-2022. Taiwan turned in a higher figure for 2020-2022 when demand for semiconductors surged amidst pandemic lockdowns and WFH around the world.
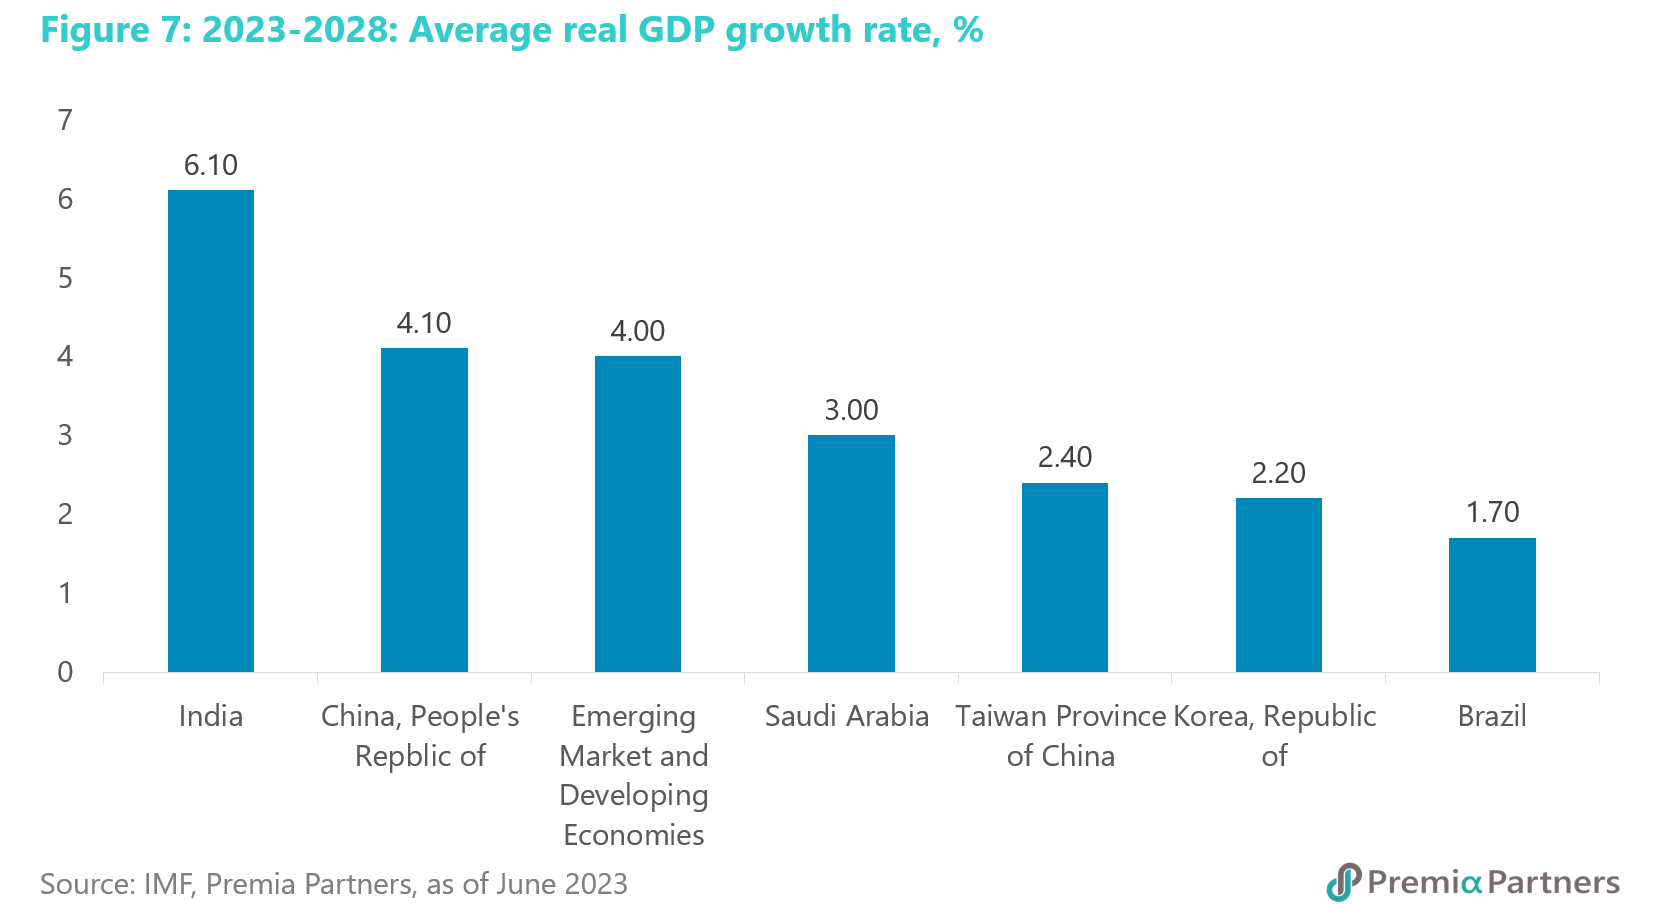
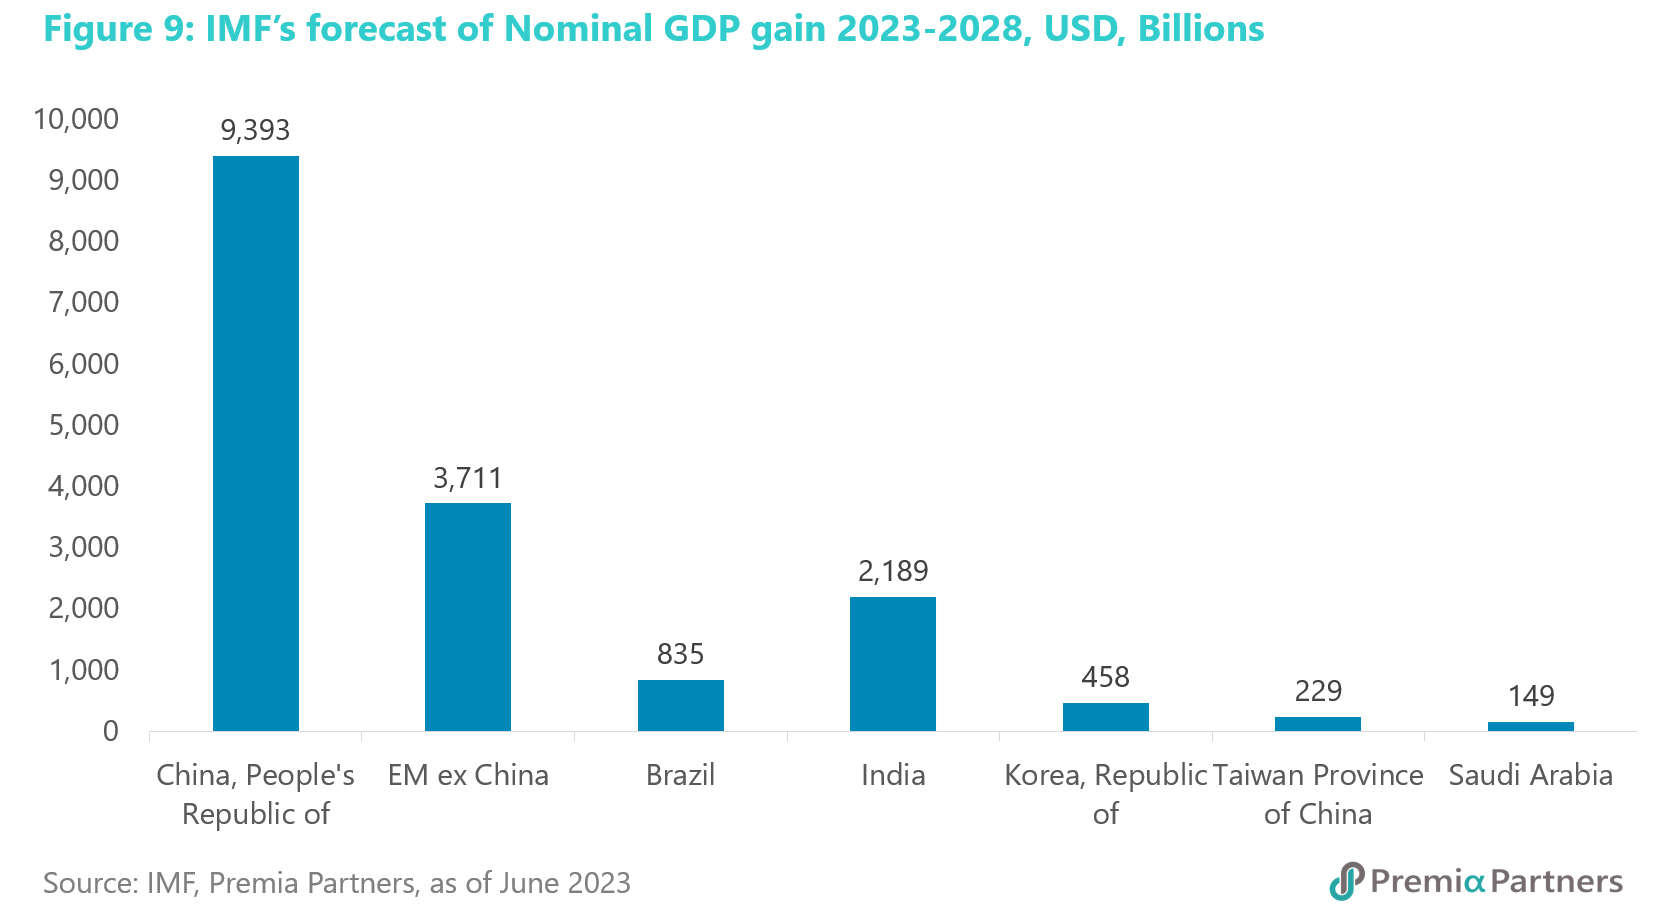
 Looking ahead, between 2023 and 2028, the IMF expects that China will grow its nominal GDP by 2.5x what it expects from the EM ex-China economies. What about the outlook? Using the IMF’s forecasts for real GDP growth for 2023 through to 2028, only India is expected to outperform China.
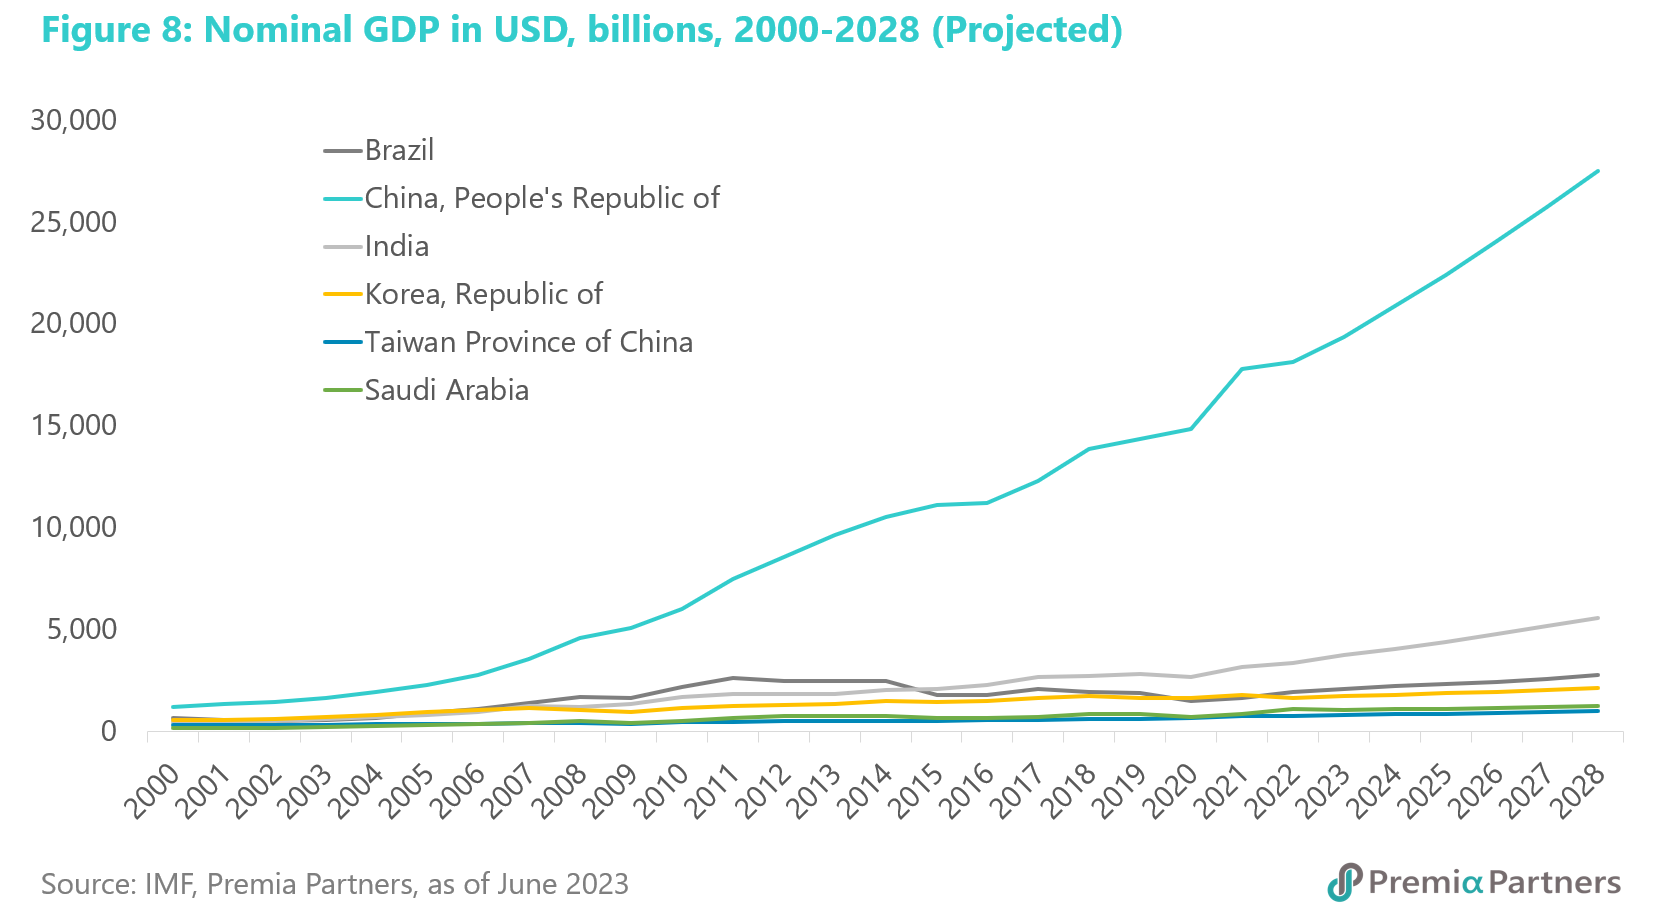
India’s higher economic growth rate of course comes off a much lower base compared to China. To the extent that much of economics and business is about scale, it should be noted that the incremental nominal GDP that the IMF expects from China in the period 2023-2028 is 2.5x the incremental nominal GDP it expects from all the MSCI EM ex-China economies put together over the same period.
China’s “macroeconomic resilience” is rated mid-way between Emerging Market and Advanced Economy levels. The Swiss Re Institute’s 2022 Resilience Index gave China’s economy a score of 0.50 versus the Advanced Economies’ average of 0.64 and the Emerging Market economies’ score of 0.42 (a higher score represents greater resilience). India scored 0.37 and Brazil scored only 0.26 and part of that high resilience score speaks of China’s relative policy stability/prudence.
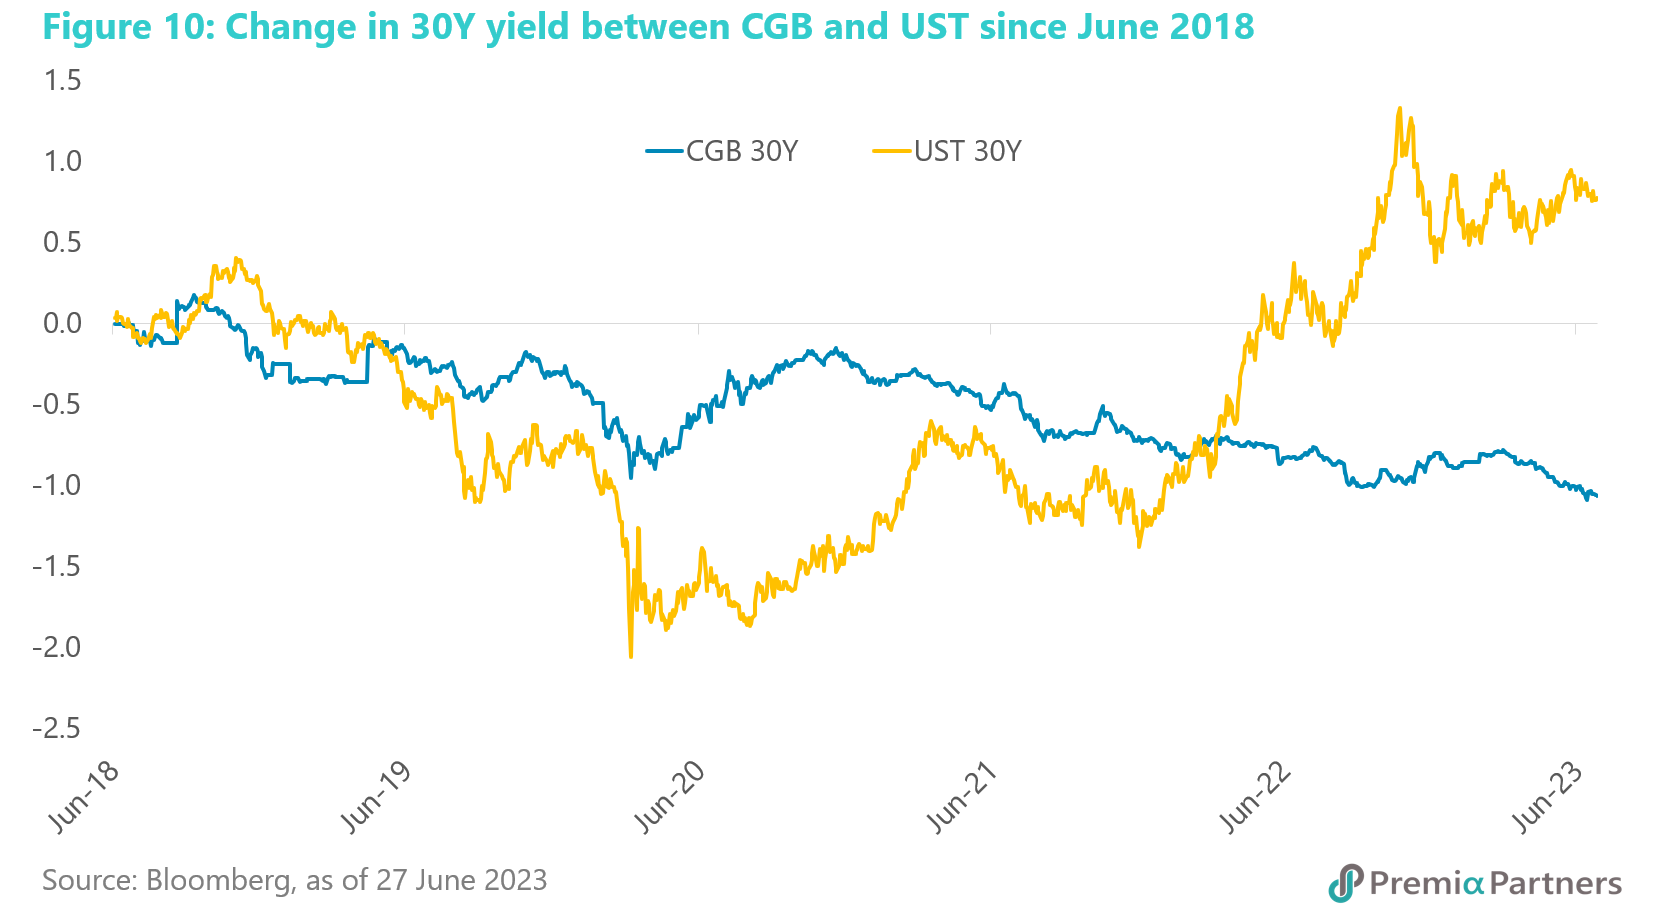
That policy prudence has translated into stable Chinese government bond yields at a time of high inflation and rising government rates and bond yields elsewhere. China’s government bond prices have shown more stability than its US Treasury counterparts amid the current US interest rate hike cycle. The 30Y CGB and UST spread has been widening since the start of the pandemic in 2020 – and this is a legacy of the all-out fiscal and monetary expansion in the US in response to the pandemic.
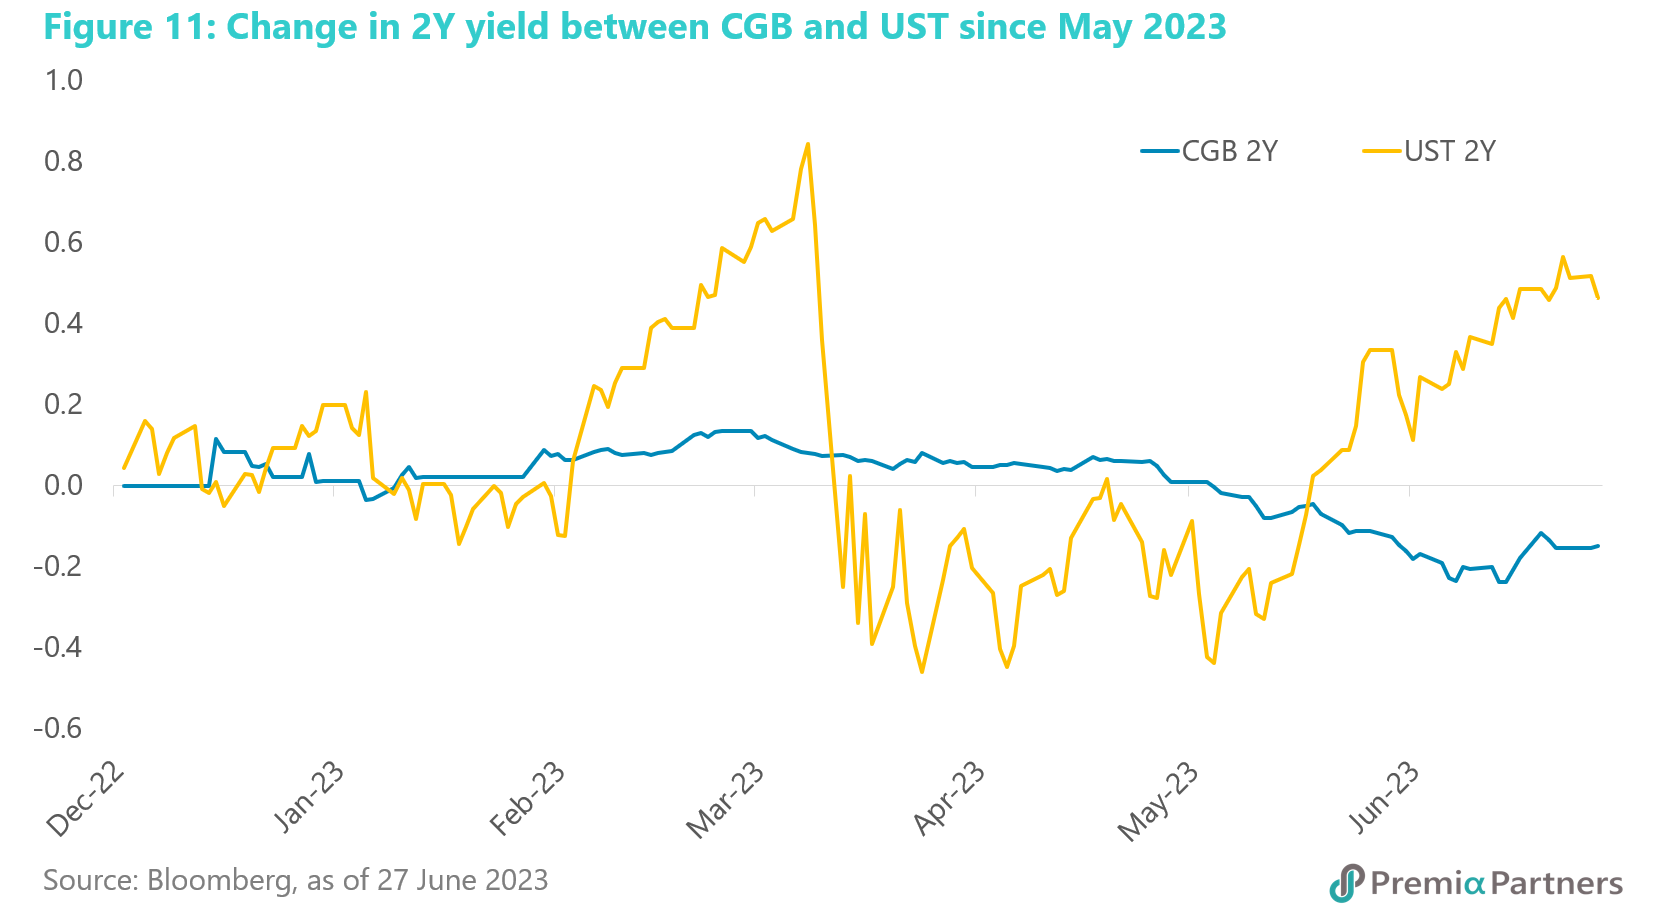
 That divergence is likely to continue. On the US side of that spread, the Fed Chair Jerome Powell has recently warned of the possibility of multiple rate rises still ahead. This is in line with the June FOMC’s median forecast of two rate hikes ahead by year end. Indeed, we have written that the FOMC has a history of underestimating its own rate hike actions, and the market may see more than the two hikes signaled by the FOMC. On the other hand, the PBOC has started to cut some of its key interest rates. With mild inflation, PBOC may cut further its key interest rates to stimulate China’s economic growth. Note how the yields of the 2-year US Treasury and the CGB have diverged quite sharply since the start of May.
We believe that the long-duration CGB bonds may diversify investors’ bond portfolios while offering higher yields than the short-duration ones. For cost and operational efficiency, investors may have a look at our Premia China Treasury & Policy Bank Bond Long Duration ETF, which invests in a basket of CGBs and policy bank bonds with ten years or more tenor. We also offer a USD-hedged version for investors concerned about currency movements.
Equities valuations and growth outlook are pointing to an undervalued opportunity in Chinese equities. Comparing the latest forward PE ratio from Bloomberg with the expected 5-year consensus earnings growth rate (as published last week by Yardeni Research Inc. citing Refinitiv IBES data), we find that MSCI China offered the best value for growth – and by a large margin too – compared to the MSCI Emerging Market ex-China markets.
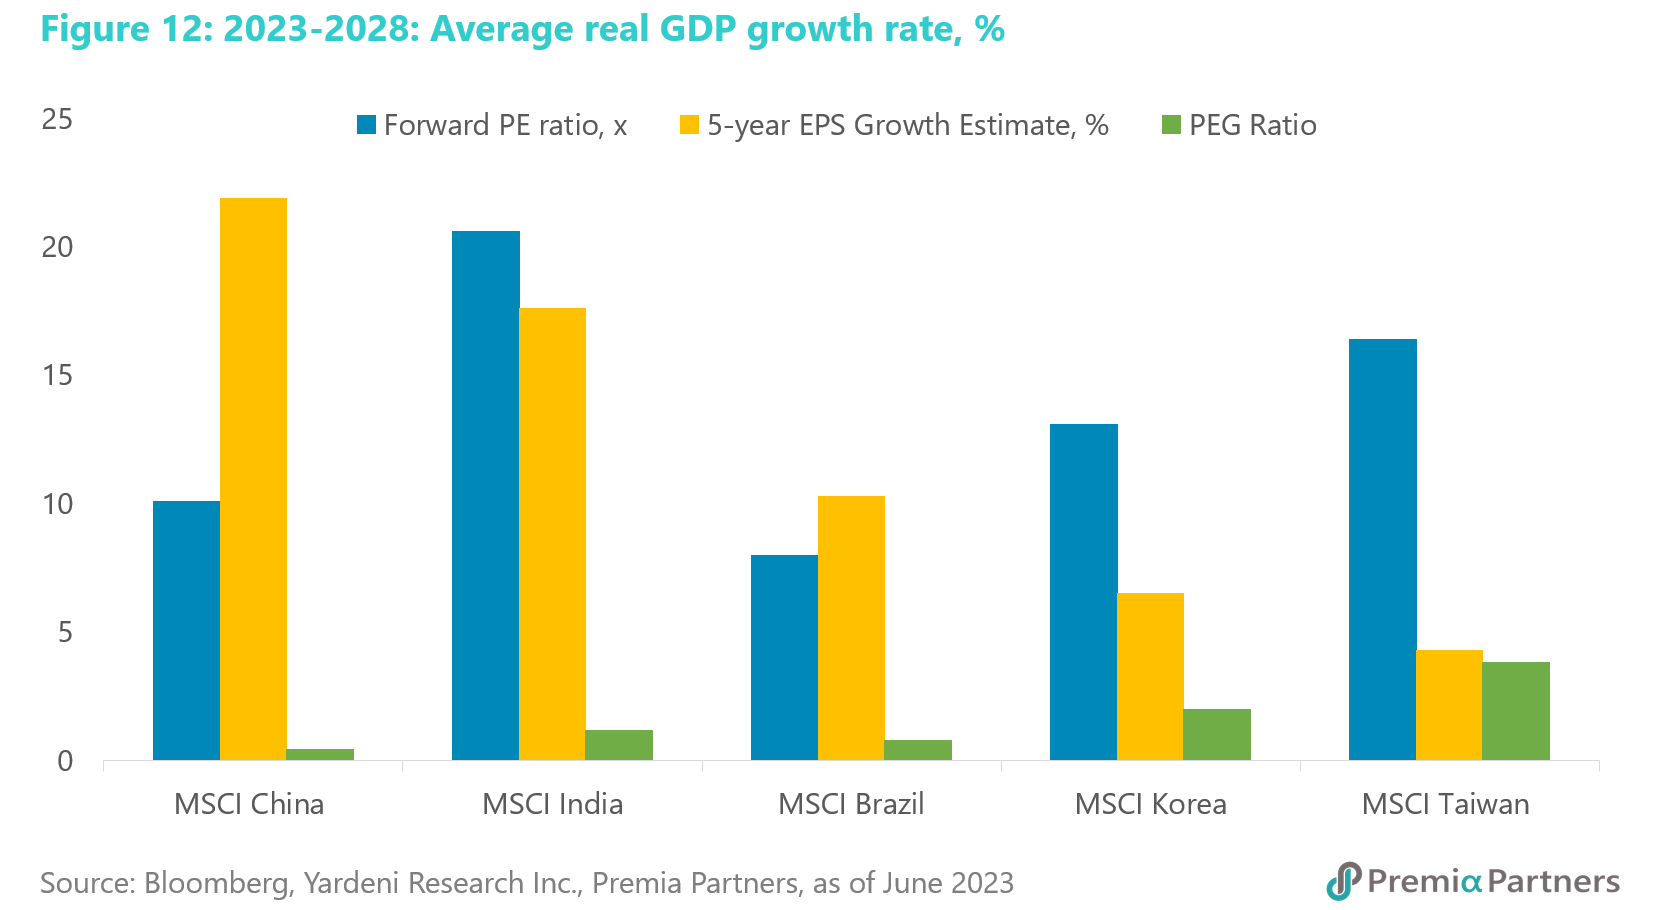
The MSCI China index forward PE ratio stands at 10x, relative to an estimated 5-year consensus earnings growth of 22%.
