
The China “lost decade” narrative has been driving pessimism over Chinese assets in recent months. Our senior advisor Say Boon Lim explains below that China 2023 is unlikely to be Japan 1990 because of quite a number of differences: 1) China’s labour force could stay resilient despite ageing – and indeed the labour force has increased over recent years; 2) China still has a bulge of workers in the 30-39 years age bracket who will be coming into the prime productivity 40-49 years age group in coming years; 3) convergence between the TFP for China and those of Developed Economies will help drive economic growth in coming years; 4) the Chinese government’s policy focus on the supply side will help China avoid Japan’s secular stagnation; 5) China is rapidly narrowing the gap in R&D spending against the OECD; has surpassed the US in patent grants; and is leading the US in “critical technologies”; 6) hukou reforms could unleash more productivity growth - in terms of urbanisation, China 2023 is Japan 1960; 7) the Chinese property market’s much talked about “oversupply” is not big enough to trigger a “lost decade”; 8) China is unlikely to accept a Plaza Accord style currency appreciation which contributed greatly to Japan’s “lost decade”; 9) China’s banks in 2023 are way better capitalised than Japan’s banks in 1990; 10) the Chinese government today has vastly more financial resources to deal with its economic problems than the Japanese government had in 1990.
China’s “lost decade” narrative is a replay of Gordon Chang’s failed 2001 prediction of the “Coming Collapse of China”. Predictions of a coming “lost decade” for China are likely to go the same way as the 2001 headline grabbing book “The Coming Collapse of China”. Both have attracted a lot of attention because they offer the media sensational one-liners. To be fair, they do identify shortcomings in China’s economy. Yet, they then take leaps into exaggerated pessimism which offer up confirmation bias for China sceptics.
China’s economy is slowing – that is obvious – and will continue to gradually slow in coming decades with increasing economic maturity. However, the idea of Japan’s “lost decade” doesn’t just imply gradual easing of growth – it suggests something a lot closer to the “collapse” as predicted by Gordon Chang 22 years ago.
Japan suffered not just the loss of a decade, it has lost three decades. Japan has lost more than the decade from 1991-2001. It is now in secular stagnation, with real GDP growth bouncing around zero. In popular Japanese commentary, ushinawareta jyu-nen (lost 10 years) became ushinawareta nijyu-nen (lost 20 years), and now, ushinawareta sanjyu-nen (lost 30 years). That is unlikely to be China.
There are many reasons why China 2023 is not Japan 1990. Broadly, the three most significant reasons are 1) China’s stage of economic and social development/economic convergence 2) its massive financial resources, and 3) policy choices versus some sort of deterministic destiny.
An ageing demographic does not translate neatly into a smaller labour force. One of the biggest arguments offered by the “China lost decade” proponents is the working age population profiles of Japan and China. The percentage of population aged 15-64 in China today is similar with that for Japan in 1990 – at around 69%. China’s current fertility rate of 1.2 births per woman is even lower than the rate of 1.5 for Japan in 1990, and these figures are then related to the future size of the labour force. At a simplified level, economic growth is said to be the sum of the delta of the labour force and the delta in labour productivity.
Despite the ageing of its population, China’s labour force actually rose over recent years. The relationship between the age profile of a population and the size of the labour force is neither an immediate nor direct one. China’s labour force actually rose from 771m in 2019 to almost 782m last year, surpassing its previous 2015 peak. This was despite the percentage of the population aged 15-64 falling continuously since 2010.
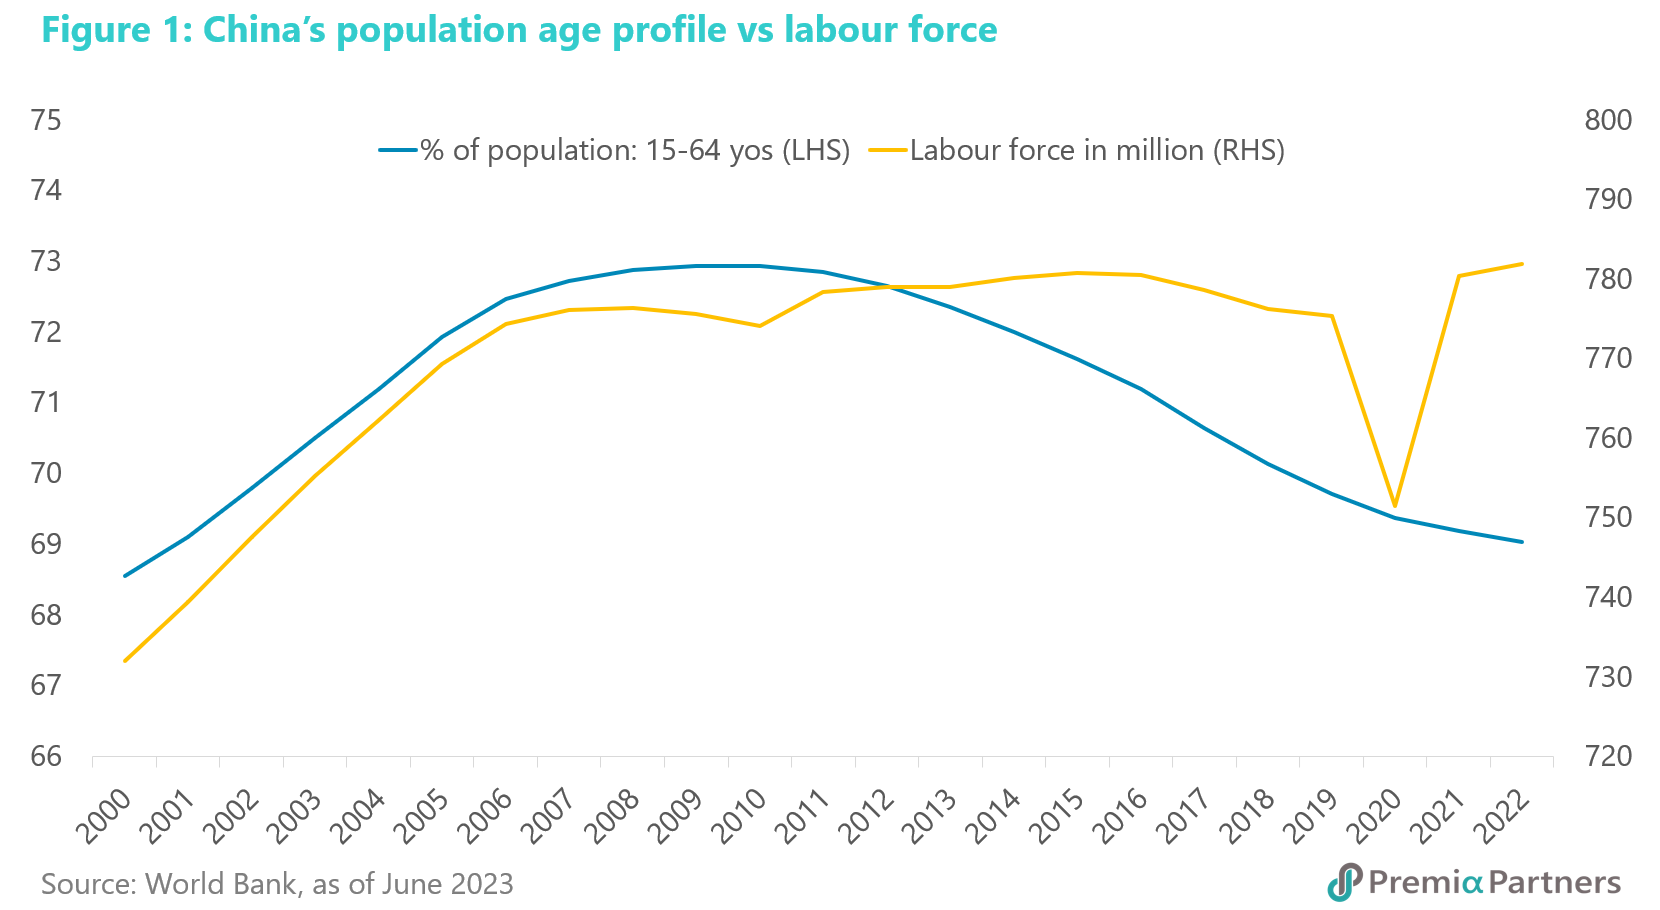
So, all that had happened was that the average age of the labour force edged up from around 37 years in 2017 to 38 years in 2022.
The suggestion that China will suffer labour shortages as a result of an ageing demographic is something we are unlikely to see anytime soon. China has an unemployment rate of over 5.2% and a youth (aged 16-24) unemployment rate of almost 21%.
A gradually shrinking labour force does not translate neatly into lower economic growth either – much has to do with productivity. Then, even when the labour force starts to shrink, the relationship between the size of the workforce and GDP is, again, neither immediate nor direct. A study published by the Rand Corporation and the US National Bureau of Economic Research concluded that two-thirds of the reduction in GDP growth caused by the ageing of a population is driven by a lowering of labour productivity rather than the slowing of labour force growth.
So, a deterministic view that an ageing population equals lower economic growth is simplistic and likely erroneous. There is a productivity element at play, and we will cover this below, under China’s policy choices.
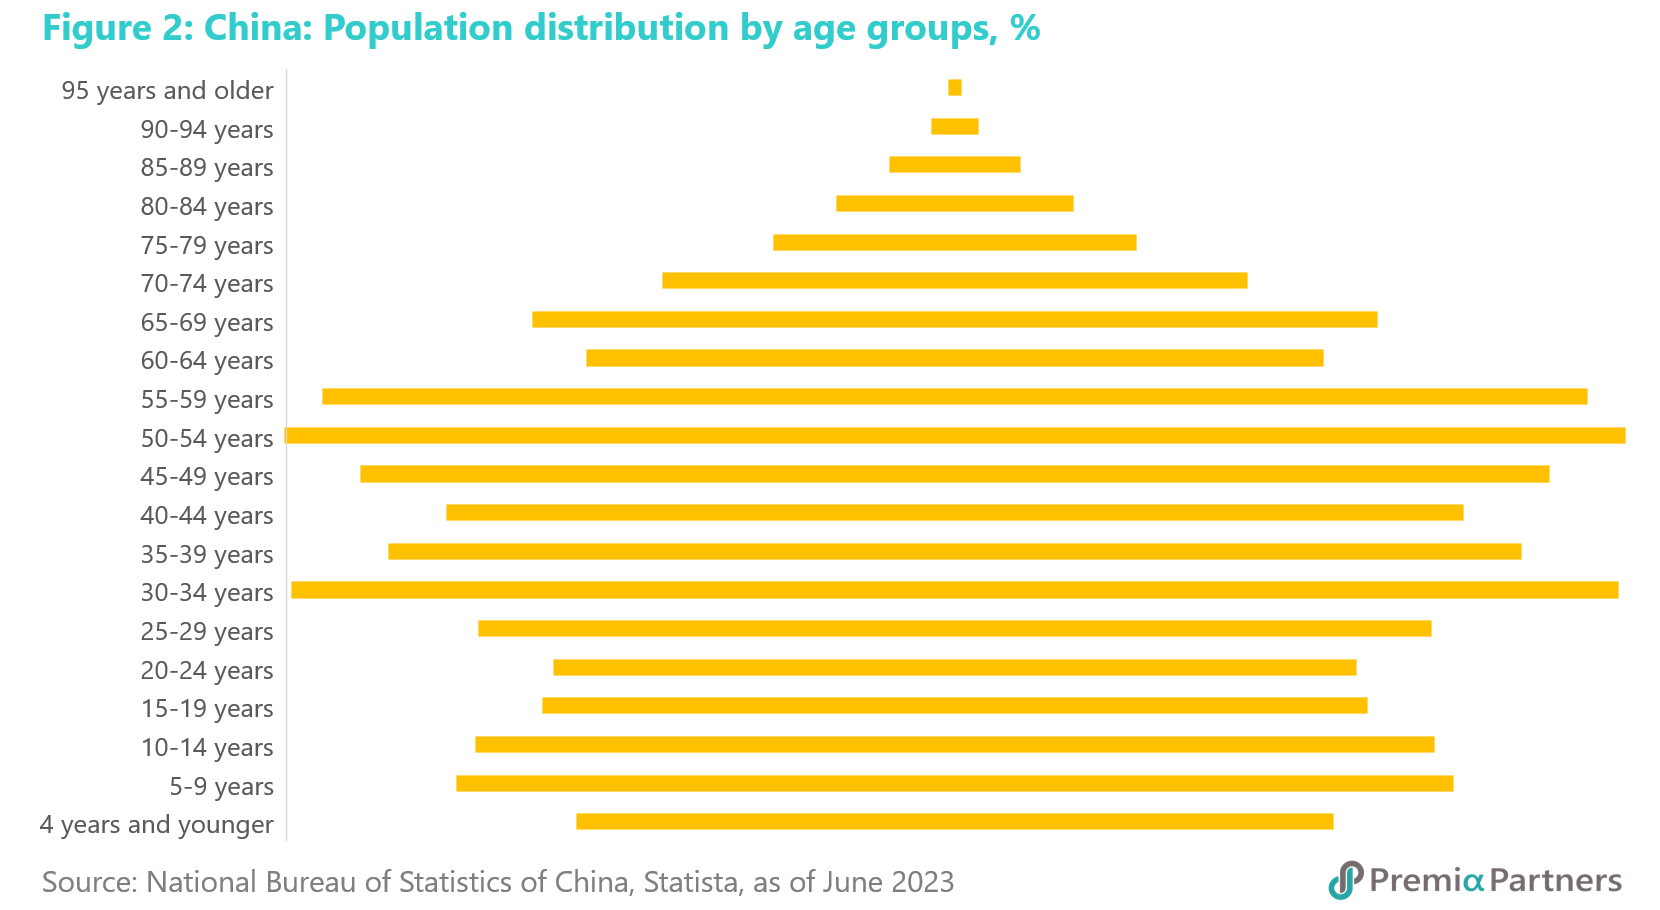
Interestingly, the above Rand/NBER study also argued that “productivity growth increases with the proportion of workers aged 40-49 and decreases as the proportion who are older rises”. So, the outlook could be more nuanced than if it was related simply to the average age of the labour force.
Indeed, China still has a little bulge in its population distribution chart for people aged 30-39 who are moving into that supposed prime productive age group in coming years.
A small aside: Ageing is a global phenomenon. The median age in China is 38.4. In the US, it is 38.5. In Germany, it is 47.8; in UK, it is 40.6; in France, it is 41.7. Also, South Korea has a fertility rate of 0.8, but we don’t read too many articles of a “lost decade” facing South Korea.
China’s relatively low total factor productivity offers room for catch-up/convergence to drive economic growth. Productivity growth will play a critical part. Some years ago, a report by an Australian think tank described China as a “low productivity superpower”. At one level, it might seem – and might have been intended – to be disparaging. However, on another level, it ironically supported a more positive outlook for China’s growth prospects.
It was stating the obvious – that developing economies have lower total factor productivity than developed economies. Indeed, the idea of “convergence between economic leaders and followers” – a powerful source of economic growth – is driven in part by that movement of productivity towards the “efficiency frontier” occupied by the leaders.
China’s TFP growth has come in cycles – likely in lagged response to structural economic reforms. The negativity over China’s TFP outlook is the result of the flattening and decline in TFP over the past eight years.
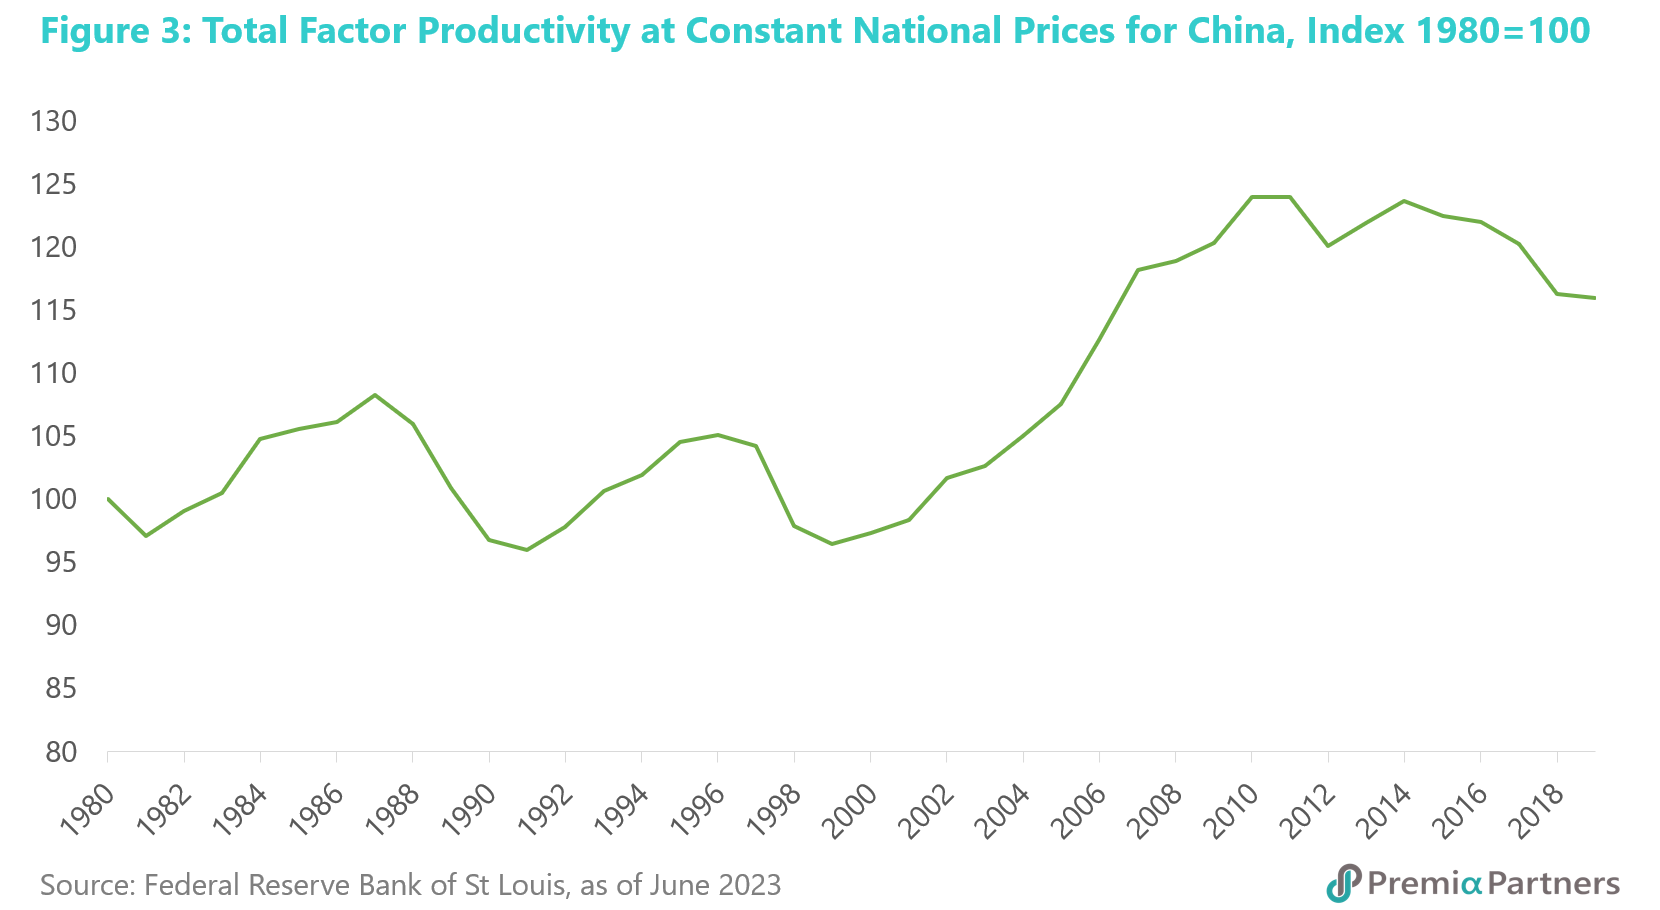
That is a reasonable concern. Looked at in the broader sweep of history however, China has seen many waves of productivity growth and decline, only to push back up again – likely the lagged response to structural economic reforms. The conclusion that the past eight years is the end of China’s productivity convergence with the Developed Economies of the world is another example of a leap into grand pessimism that confirms the biases of China sceptics.
Writing for the World Economic Forum in 2016, Professor Keyu Jin, then from the London School of Economics and Political Science said: “China’s productivity growth – which has been an important economic driving force for the past 30 years – is primarily a result of two large structural transformations, and not innovation and technological adoption. Indeed, developing countries like China have grossly misallocated resources, and simply reducing the distortions and moving capital and labour from low-productivity areas to high-productivity ones could result in significant productivity gains. China has already managed to do something similar when it moved workers from the low-productivity agriculture sectors and state-owned companies into higher productivity manufacturing sectors and private firms. The efficiency gains were tremendous. If it were to continue to do the same – and also focus on reallocating capital and investment – this could bring about significant productivity gains.”
The Chinese government’s focus on supply side reforms is a policy choice that will help China improve productivity and avoid Japan’s secular stagnation. So, China’s economic outlook should be seen in the context of its policy choices, rather than a deterministic destiny based on some other country’s history. In this regard, note the Chinese government’s policy choice of boosting investment in research, development and innovation. China has dramatically narrowed the gap with the OECD in R&D spending as a percentage of GDP.
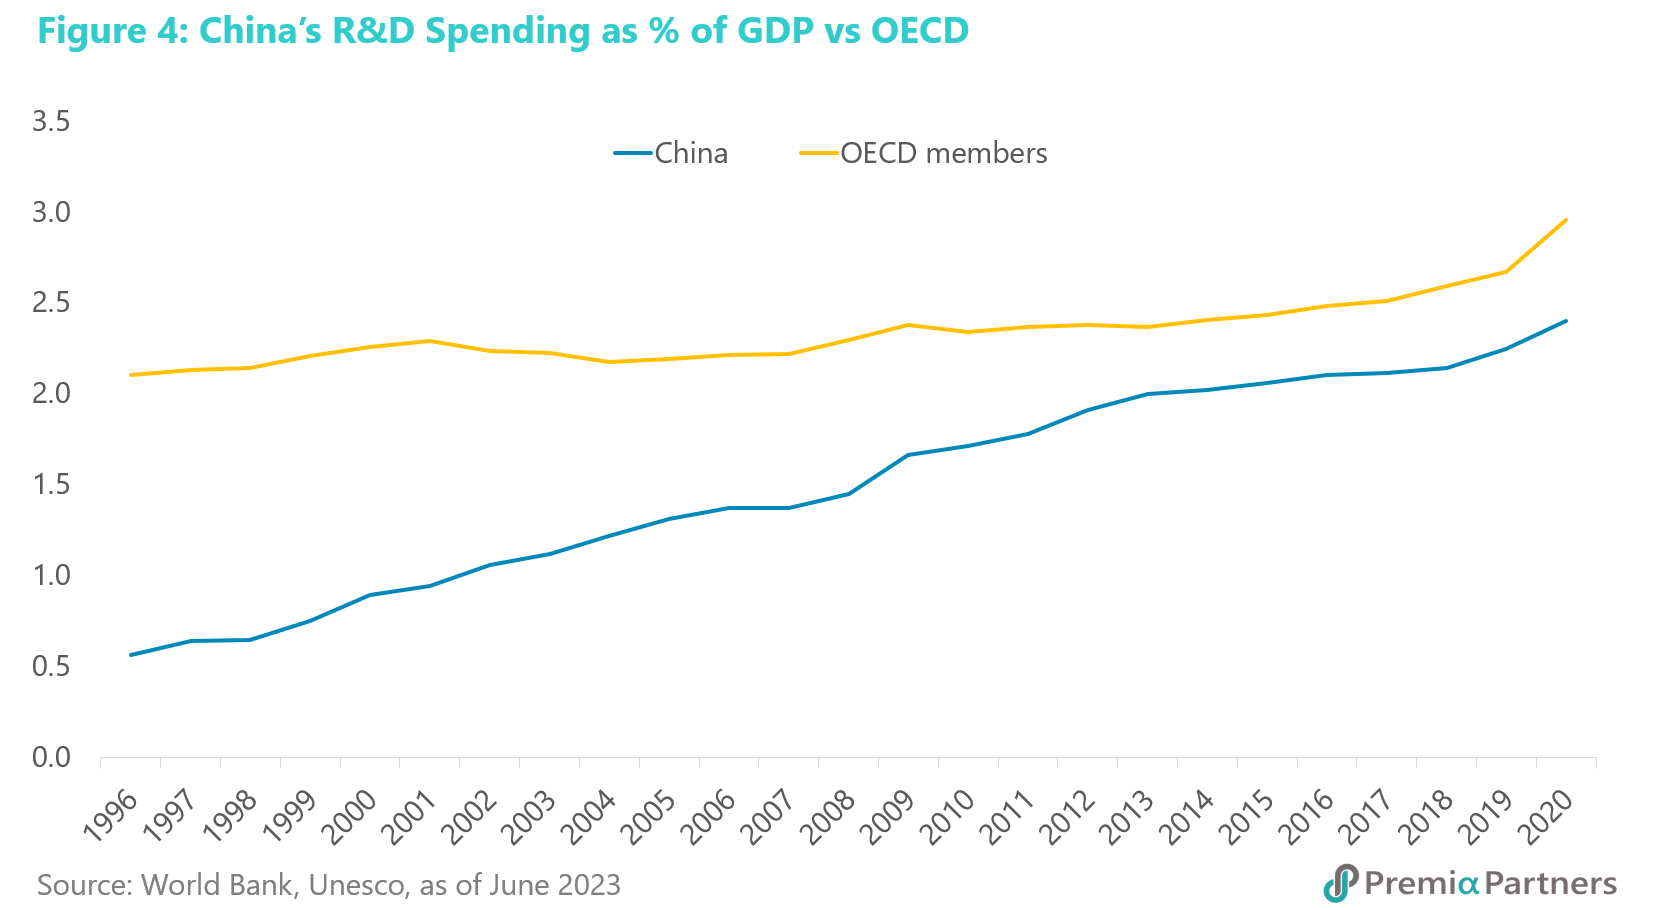
China is rapidly narrowing the gap in R&D spending against the OECD; has surpassed the US in patent grants; and is leading the US in “critical technologies”. According to the US-based Centre for Strategic and International Studies (CSIS), comparisons based on raw, aggregated patent data shows that China has been the world’s leader in patent applications and grants for nearly a decade. Patent grants from China overtook the US in 2014 and by 2020 was running at over 500,000 compared to around 350,000 for the US. The Australian Strategic Policy Institute (ASPI), which tracks 44 “critical technologies”, reported last year that China led the US in 37 of the 44.
Hukou reforms could unleash more productivity growth. Another policy choice which could boost China’s growth outlook is hukou reform. Last year, China’s National Development and Reform Commission (NDRC) announced that the hukou household registration system would be amended to encourage more urbanisation. Hukou limits will be removed for cities with populations under three million and registration for cities with populations between three million and five million will be made easier.
Urbanisation drives productivity growth. The links between urbanisation and productivity growth are well documented. For example, the World Bank recently wrote: “With more than 80% of global GDP generated in cities, urbanisation can contribute to sustainable growth through increased productivity and innovation if managed well.”
Cities are hubs for information, knowledge and education. In short, they are hubs for the development of human capital needed for productivity growth. In an economy that is open to investment and technology, cities are also gateways for the entry of global knowledge, and this is an important factor for China’s productivity growth outlook.
In terms of urbanisation, China 2023 is Japan 1960. China currently has around 64% of its population in urban centres. So, China – in urbanisation terms – is around where Japan was in 1960.
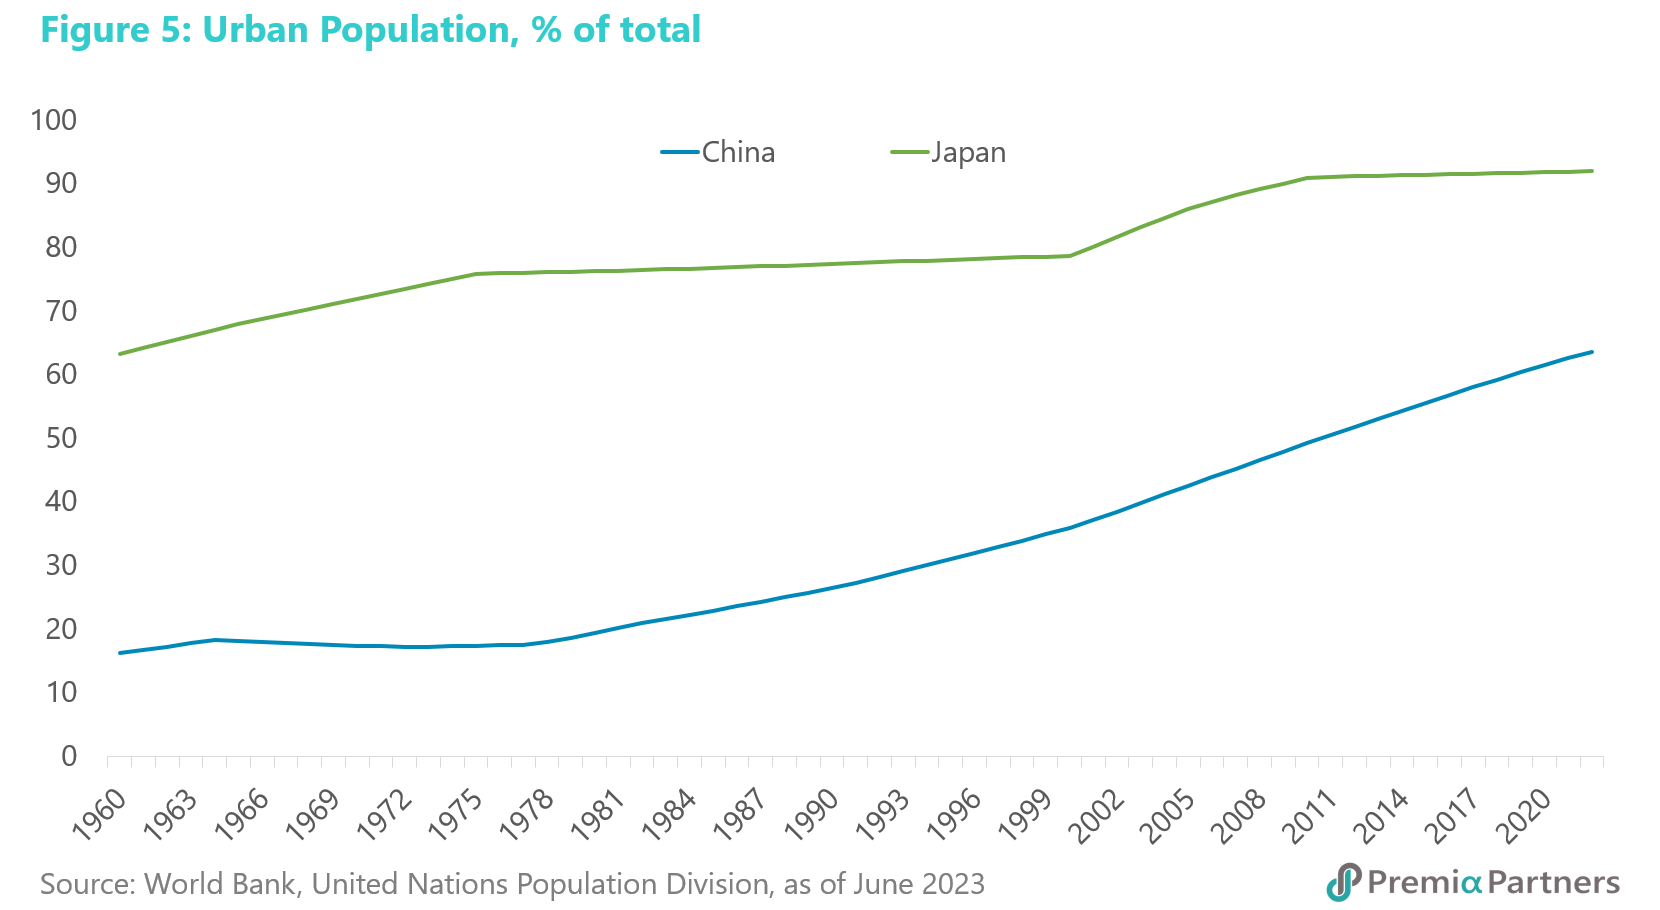
This is another stark example of how China 2023 is not Japan 1990.
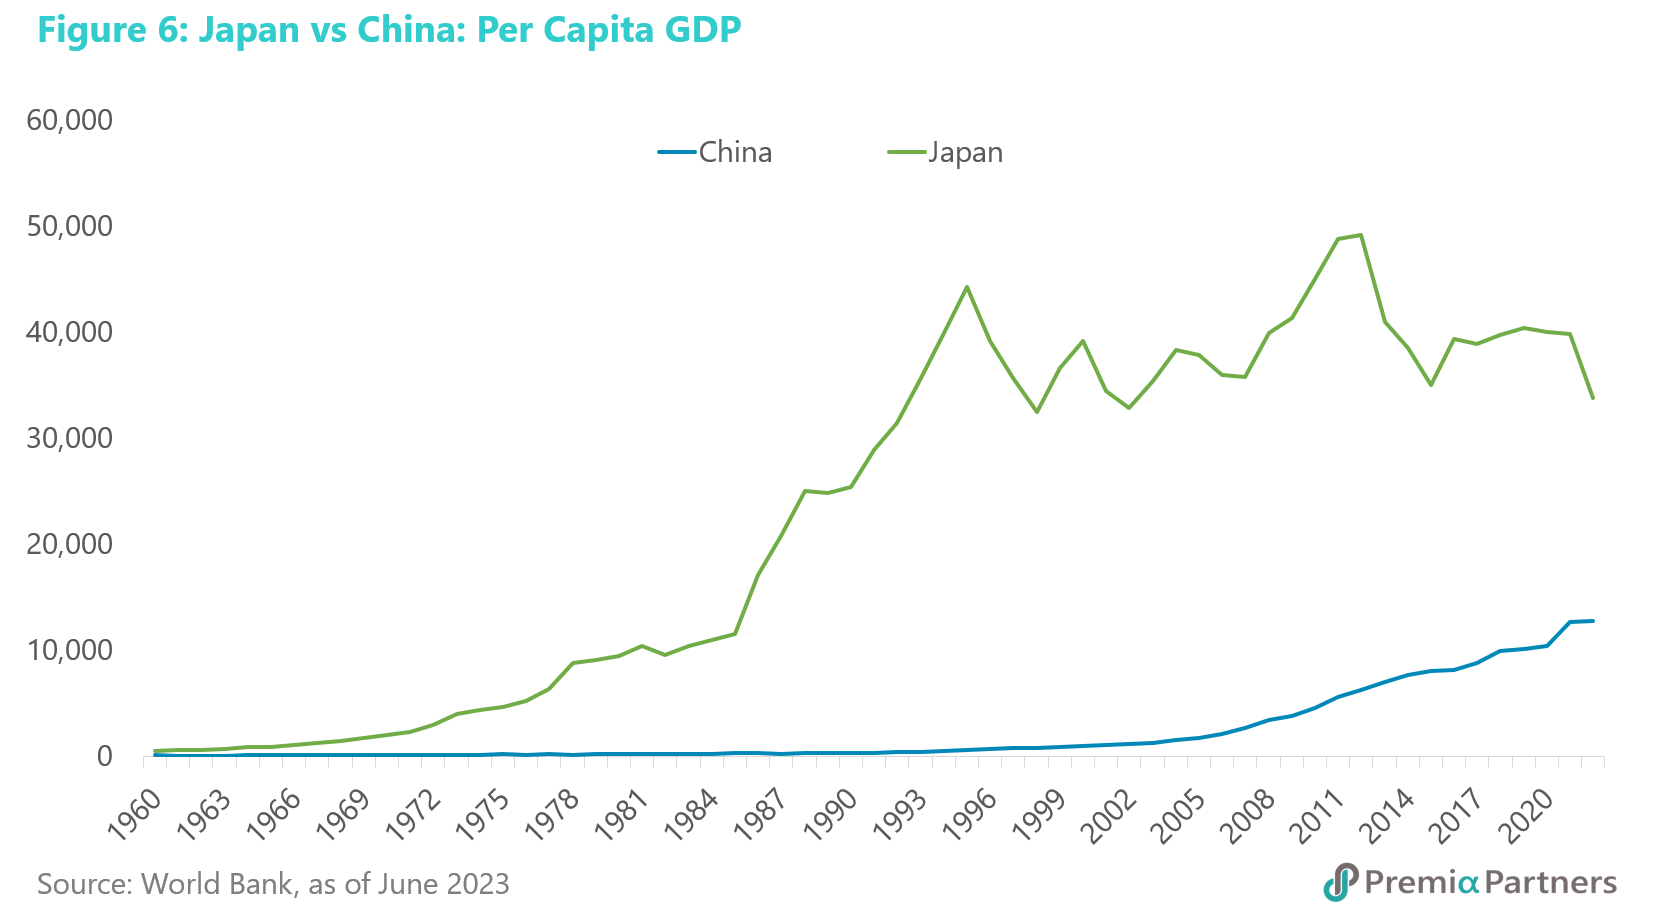
Japan’s per capita income stagnated at US$44,200, China’s per capita income is currently only US$12,700. Indeed, in terms of the convergence/catch-up theory of economic growth, in per capita income, China is approximately where Japan was in 1985. Japan’s per capita income rose sharply for another 10 years after that to around US$44,200, before it stagnated. China’s per capita GDP is currently only US$12,700.
Why the Chinese property market’s much talked about “oversupply” is unlikely to trigger a “lost decade”. The above cited relative levels of urbanisation and per capita income could also help mitigate the current oversupply in China’s residential property market. For starters, the stock of unsold homes – measured as fractions of annual sales – is between 3-4 months, depending on the source of the data. For example, the Wall Street Journal, citing Wind data, reported recently that China had 3.5 billion square feet of finished but unsold apartments in February this year. Last year, sales of residential property space were reported by the National Bureau of Statistics at 11.8 billion square feet. So that is equivalent to around 3.6 months of annual sales. Data from China Real Estate Information Corp, as at February this year, put the inventory at around 4.2 billion square feet. Meanwhile, Bloomberg data showed 2022 sales of 12.3 billion square feet. So, that works out around 4.0 months of sales, which is a bit less than what is regarded as normal in the United States.
Yet, let’s say the more negative estimates of stock overhang are right. Even if you take a multiple of the above figure of 3-4 months of sales – let’s say 12 months of demand – that is not likely to be the catastrophic “lost decade” trigger some would have believed.
Urbanisation, upgrading, renewal will likely absorb excess supply. Even with a declining population, as per capita incomes rise and with continued rural-urban migration, there is likely to be “upgrader” demand for new homes. Also, the life expectancy of a home in China is estimated by Credit Suisse, and as reported in the Wall Street Journal, at only 35 years. So, renewal is another potential source of demand.
Did the US inflict the “lost decade” on Japan? Consider geopolitics – and this is not a conspiracy theory. Japan’s acceptance of the massive Yen appreciation forced by the Plaza Accord played a big part in the “lost decade”. Writing for the Asian Development Bank Institute, Fujii Mariko and Kawai Masahiro said: “One of the direct causes of the banking crisis in Japan was the bursting of the asset price bubble in the period from the late 1980s to the early 1990s. After the 1985 Plaza Accord, Japan pursued expansionary fiscal and monetary policies to counter fears of recession brought about by the sharp appreciation of the yen. At the same time, a strong yen created a confidence and optimism in the future of the Japanese economy. This belief—supported by abundant liquidity and self-fulfilling expectations of ever rising prices of stocks and land—led to asset price bubbles.”
Yen appreciation made the Japanese feel rich even as US protectionism undermined the economy. The Yen appreciation was spectacular. USDJPY went from around 263 Yen at the start of 1985 – the year of the Accord – to around 80 Yen some ten years later in 1995. Around that time, the US battered the Japanese economy with a range of protectionist and “market opening” measures. China is unlikely to acquiesce to similar pressures today.
China 2023 has reserves equal to at least 18% of its GDP while Japan 1990 had reserves equal to only 2.8%. China has choices, and consider also the resources that China has to back up its policy choices. Notwithstanding its unwillingness to throw the metaphorical “kitchen sink” at the economic challenges, China has prodigious financial resources. At the start of the “lost decade”, Japan had foreign reserves of US$88 billion against a GDP of US$3.13 trillion. That was only 2.8%. China’s official foreign exchange reserves today are US$3.3 trillion against US$18 trillion in GDP. That is 18%. And if you believe Brad W. Setser, a former Deputy Assistant Secretary for International Economic Analysis in the U.S. Department of the Treasury, who recently wrote about hidden Chinese reserves being double the official figure, China’s foreign exchange reserves could be around 36% of GDP.
China’s deflating of its own property market contrasts with Japan’s asset inflationary policies before the start of the “lost decade”. Ironically, despite its massive financial resources, a major part of the policy choices that China has opted for – amidst the clamour by the market for “stimulus, stimulus, stimulus” – has been to constrain property speculation and prices; curb investment in the property sector; and direct economic resources into developing economic resilience via core technology, R&D and domestic consumer growth.
The immediate “sugar hit” of expansionary policies made the Japanese feel rich and invincible during the “bubble era”. Money was there for the taking while the economy deteriorated. The Yen made everything foreign cheap, encouraging frivolous purchases both at the consumer and corporate level. The end is now legend.
China’s policy choices may have disappointed the markets in that they are not quick fix/instant gratification measures. They are broadly speaking about lifting the supply side’s ability to contribute to growth.
Ironically and contradictorily, even while the market has been demanding more stimulus, many have also been arguing that China is in a Japan-style “liquidity trap”. Why stimulate if you believe China is in a liquidity trap?
Why a Japan-style “liquidity trap” is unlikely for China – the system and even economic indicators/measures are different. The massive amount of research on the topic of “liquidity trap” is a bit like the title of a recent book about a US President: “Too much and never enough”. That is, despite all the work and words put into the research, understanding of the why and how of a liquidity trap remains inadequate. So then applying it to a country with a very different system to the US and Japan – and with even different measures of M1 and M2 money supply – might lead to wrong conclusions.
Liquidity traps emerge when businesses lack confidence in growth opportunities. This is a huge topic on its own. Here, we will only make a few broad comments: Liquidity traps are associated with deflationary expectations and pessimism about long-term economic growth. In Japan, it is also associated with banks being unable to lend – because of non-performing loans and capital adequacy problems – and companies unwilling to borrow, because of a lack of confidence about growth opportunities.
Japan was already a mature industrial economy before the War – its post-war reconstruction was not the beginning of its industrialisation. In an economy the size of China and at its relatively early stage of development, it would be a huge leap into grand pessimism to conclude that it has run out of growth opportunities. Japan started its industrialisation in the mid-19th century, at the start of the Meiji Restoration. What happened after World War Two was reconstruction of an already relatively urbanised society with well-developed human capital. China’s industrialisation started almost a century later.
Inadequately capitalised Japanese banks couldn’t clear out their NPLs in the 1990s – Chinese banks today have 15% CARs. China today has more influence over state-owned banks’ lending and SOE companies’ borrowing than Japan had in 1990. For starters, Chinese banks have much higher capital adequacy ratios today, averaging around 15%, compared to the 8.0% for Japanese banks circa 1990. Note also, Japanese banks in those years, under the keiretsu practice of cross-shareholdings within conglomerates, held a lot of their capital in the shares of related companies. So, when the bubble burst, the value of Japanese banks’ loan books fell together with the value of stock held for capital adequacy. A double whammy. This is not the case in China today, where banks follow the Basel III capital adequacy framework.
There is no NPL crisis in China – so why expect crisis-style measures? The Chinese Government today has more leverage over how the country’s banks handle non-performing loans than the Japanese government had in 1990. The templates for handling bank NPLs are very well established from even before the Asian Financial Crisis – the establishment of “Asset Management Companies”; the creation of good bank-bad bank; and the parceling together and auctioning of assets to foreign investors. Perhaps the reason China has not followed those templates for handling NPLs is because it has, until now, not had the need for an international fire sale of its national assets. Put simply, why would it follow the templates for countries in financial crisis when it does not have a crisis?
So, again, we come back to policy choices – of which China still has many – instead of some deterministic destiny. Indeed, as Paul Krugman pointed out in the late 1990s, “structural reforms” that lift confidence in future growth opportunities might be one way to break out of any liquidity trap.
The link between the 1985 Plaza Accord and Japan’s liquidity trap. Here is one more aspect of Japan’s 1990s “liquidity trap” worth considering – one not often talked about. Did the US do this to Japan? Did the Plaza Accord push Japan into a currency-driven liquidity trap?
The late Stanford University economics professor Ronald McKinnon said that “pressure from the United States to appreciate the yen from ¥360 to the dollar in 1971 to just ¥80 in 1995” was “the historical origin of Japan’s deflationary psychology”.1
The “unbalanced political-economic interaction between the two countries” instilled “fear that U.S. mercantile pressure will return, and that the yen will be higher (and the Japanese price level will be lower) in the decades to come”, he wrote in an IMF publication in the late 1990s.
“Not until 1978, however, was the expectation of an ever-higher yen sufficiently strong to drive Japanese nominal (but not real) interest rates persistently below those in the United States. This was not a problem for the Japanese as long as U.S. nominal interest rates remained high because of inflationary expectations. However, when the U.S. Federal Reserve convincingly stabilized the U.S. price level by the mid-1990s and U.S. interest rates came down, Japanese interest rates were driven toward zero. Thus has the liquidity trap in Japan been externally imposed—as an incidental, rather than deliberate, outcome of U.S. policies,” he wrote.
5.8% annual GDP growth for 2026-2030, 4.9% for 2031-2035 – if that’s a lost decade, Japan would love to have this one. For long-term projections of China’s GDP growth, have a look at work done by economist Xun Wang, a research fellow from Peking University, and published in the book “China 2049” (edited by David Dollar, Yiping Huang and Yang Yao and published in 2020 by Brookings Institution Press). The paper predicted that, under a low fertility rate assumption, China could grow at an average annualised rate of around 5.78% for the period 2026-2030; 4.90% for 2031-2035; and 4.00% for 2036-2040. If these are lost decades, we suspect Japan would want one or two of them, thank you very much.
