
It’s been a month since we launched our ETFs and we’ve been asked by a few clients to walk through a quick synopsis of A-shares vs rest of world, as well as the various options available within A-shares. I thought it would be easiest to cover these topics through a valuation and mean reversion lens, as that seems to be the angle missing from many of the comments I see about continued performance upward.
Valuations overall
Nick Ferres, Vantage Point’s CIO, covers the risks quite well here, so I’ll start with a summary of his points. Technology stocks have seen positive price movement justified by their earnings so far, but the latest moves up have been parabolic and likely entering the last phase of the bull market before a potentially aggressive correction. Speculative excess can be seen elsewhere as well, from bitcoin to art auctions. Here’s my very simple monitor for the same thing:
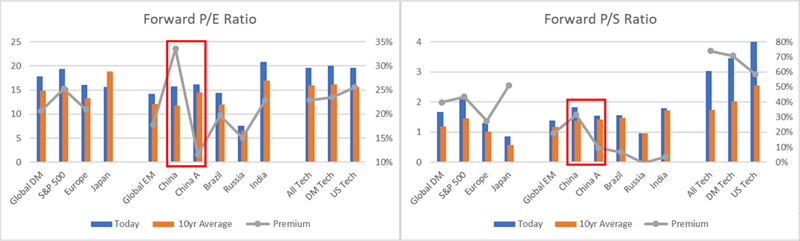
Source: Bloomberg, as of 21 November 2017
Forward P/E ratios are higher than their 10yr averages in every major DM and EM market except Japan. The premium ranges from 12% to 24%. The highest is in China offshore stocks while the lowest, curiously enough, is in China A-shares. Similarly, on a Price to Sales (P/S) basis, all markets are higher than their 10yr averages. EM has the lowest premiums (again, with China offshore stocks being the exception), but that is likely driven by the tech rally, which you can see all the way on the right. The tech sector has a P/S premium of ~60-70%! Tech sector earnings growth justifies some of the premium, but the valuation levels today suggest a recovery not far on the horizon.
A-shares vs rest of world
In a world of high valuations across the board, a long-only investor needs to do 2 things to protect their portfolio: 1) identify the catalyst likely to cause the rally to sputter, and 2) identify a market that has lagged (and is therefore cheap) and has relatively low correlations with the rest of the world. The charts above give us a hint for the latter, but let me quickly share my thoughts on potential catalysts. In my mind, there are 2 catalysts big enough for investors to stand up and notice and geopolitics is not one of them. Short of outright war, investors have from time and time again shown a willingness to ignore geopolitical risk. The bigger issues in my mind are a failure of US Congress to pass tax reform and disappointing news from the FANGs, BATs or any of the other major tech firms.
US tax reform is far from a done thing and as the debates on travel bans and healthcare reform have shown, a desire to act is far from an ability to act. A failure on this front would cement a mindset that President Trump cannot accomplish much of anything and that the lofty valuations and confidence underpinning current market levels may not be warranted. On the tech side of things, I don’t think it would take much for investors to take profit. Earnings growth expectations are quite high and even a “just OK” number might be an opportunity for some to exit. The looming possibility of greater regulation is also not out of the question.
If either of these events occur, where can we seek refuge? You guessed it! A-shares are not only relatively cheap, but are also under-owned by investors, uncorrelated with the rest of global markets and have a large wall of money (both foreign and domestic) coming their way. From a fundamental asset allocation point of view, A-shares volatility has trended down materially in recent years, the RMB is stable, IPOs are decreasing, and the economy is quite robust. All in all, a good story that can be summed up in 6 quick charts.
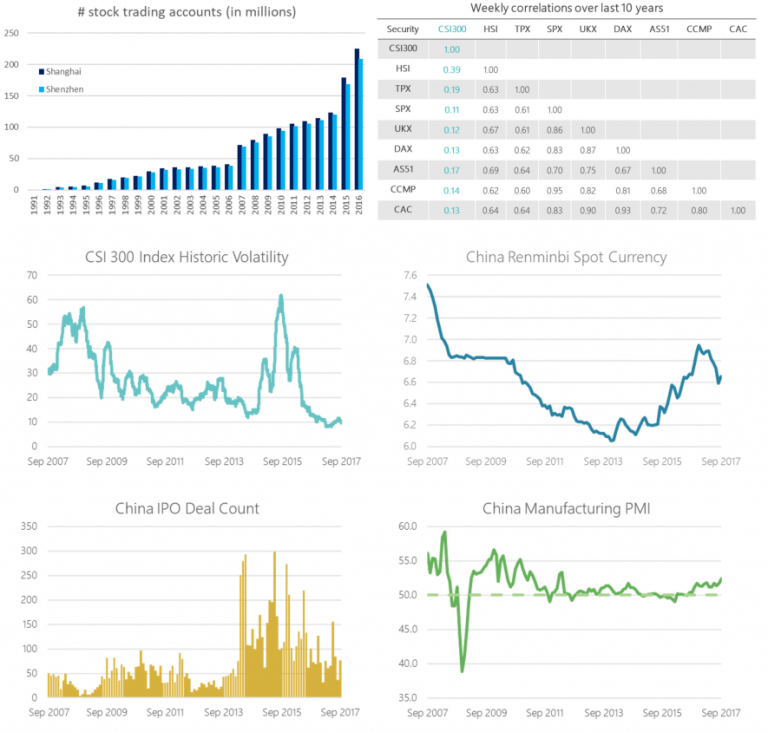
Source: Shanghai & Shenzhen Exchanges, Bloomberg, as of 21 November 2017
A-shares with nuance
If you agree with the above logic and are thinking of adding A-shares to your portfolio (or already have them), then the next question is deciding how to obtain the exposure. We’ve already spoken about the issues with existing beta options for mainstream exposures here and the lack of new economy options here. Today, I’d like to dig into style and sector performance to show why a simple mkt-cap construct is not your best bet.
From a style point of view, the 2 most common strategies globally are value and small size. In developed markets, value has consistently outperformed since the ‘70s, but has suffered vs growth over the last few years. Small caps have not had such issues, showing consistent outperformance across pretty much every period. You can see the details below:
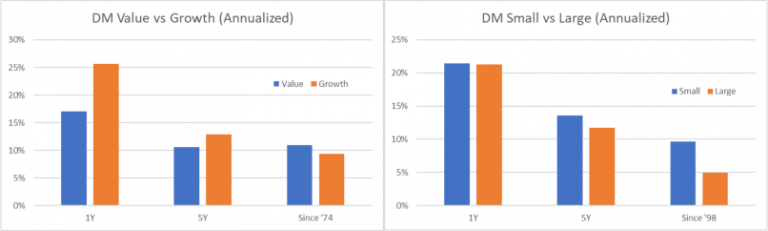
Source: Bloomberg, as of 21 November 2017
What do these charts look like in A-shares? Given their uncorrelated nature, we see the exact opposite pattern over the last few years! Value has consistently outperformed but small caps have experienced a massive correction over the last 1 year. Coming off non-sensical highs in 2015, small caps have re-rated massively vs large caps, underperforming by ~12% annualized since the peak of 2015.
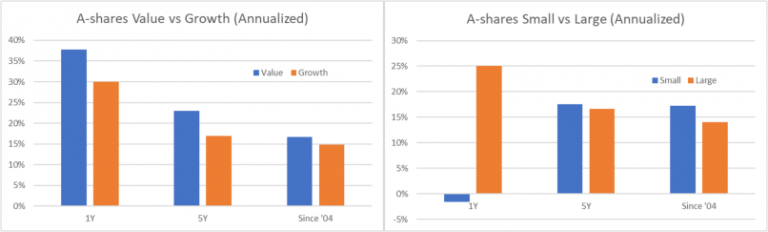
Source: Bloomberg, as of 21 November 2017
Some investors might view this as proof that one should invest in China mega-caps only and leave the rest alone, but we take a different view. Coming back to valuations, it is evident that 2015 small cap multiples were unrealistic and have simply corrected to their long-run average (in fact, below it if you include the peaks as the chart below does). In contrast, large caps are flirting with their 2011 and 2015 valuation peaks.
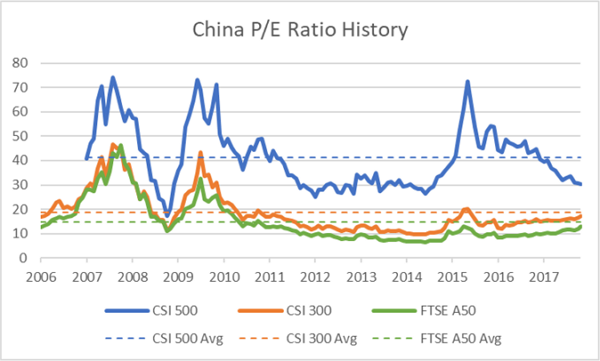
Source: Bloomberg, as of 21 November 2017
Size on its own can be quite volatile and we suggest that a singular focus on the size factor be handled with caution. As a result, we decided to take a multi-factor approach for our Bedrock Economy and New Economy ETFs. 2803 HK (Bedrock) provides a value, balance sheet health, low vol and low size bias. While this has resulted in underperformance so far in 2017, the combination of value and size exposure should generate substantial excess return going forward. 3173 HK (New Economy) is a services sector play – focused on consumer discretionary, technology and healthcare sectors. Its diversified sector exposure and balance sheet health, profitability and R&D bias has resulted in material outperformance vs Chinext so far this year, but significant size bias has detracted from performance relative to the large cap benchmarks.
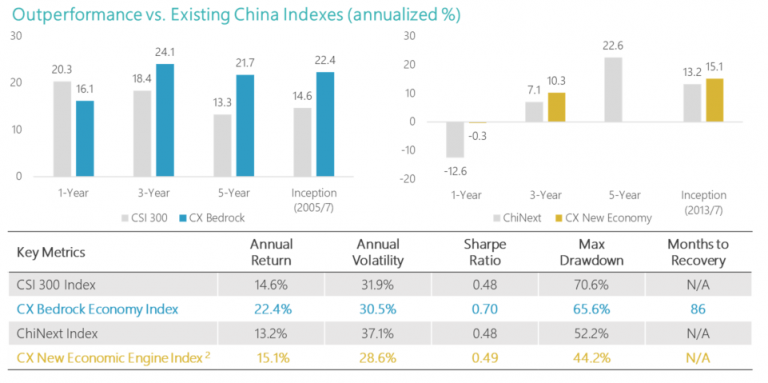
Source: Bloomberg, as of 30 September 2017
To wrap up, A-shares are a relatively cheap alternative to global markets’ increasingly stretched valuations. The challenge is what type of China exposure investors want to have in this market. Mainly large cap banks and some industrials and real estate? Then FTSE A50 or CSI 300 are the way to go. For a broader but still traditional exposure, 2803 HK lowers financials to more reasonable levels, adds consumer discretionary and prioritizes value and size factors to deliver excess return. Or, for those who want to focus on new vs traditional economy sectors, 3173 HK offers close to 0 financials, real estate and energy stocks and instead targets consumer discretionary, technology and healthcare stocks while prioritizing size and balance sheet health factors.
