US equities – the challenge of scaling the “triple peaks”
Investors in US equities may have to lower their returns expectations for 2H21 in the face of what some are calling the “triple peaks”.
The upward momentum of US equities has slowed considerably over the past 16 months, from the explosive initial rebound late March last year. Our sense is that we would either see small gains in coming months or indeed a correction in the face of the likely peaks in economic growth, earnings growth and policy stimulus.
GDP growth is likely as good as it gets – now the risk of a comedown after the high. US GDP forecasts have already proved way too high and are likely to continue to be disappointing in coming quarters.
2Q21 GDP performance disappointed badly – at 6.5%, well below the market expectation of 8.5%. The US Conference Board forecast even higher at 9%.
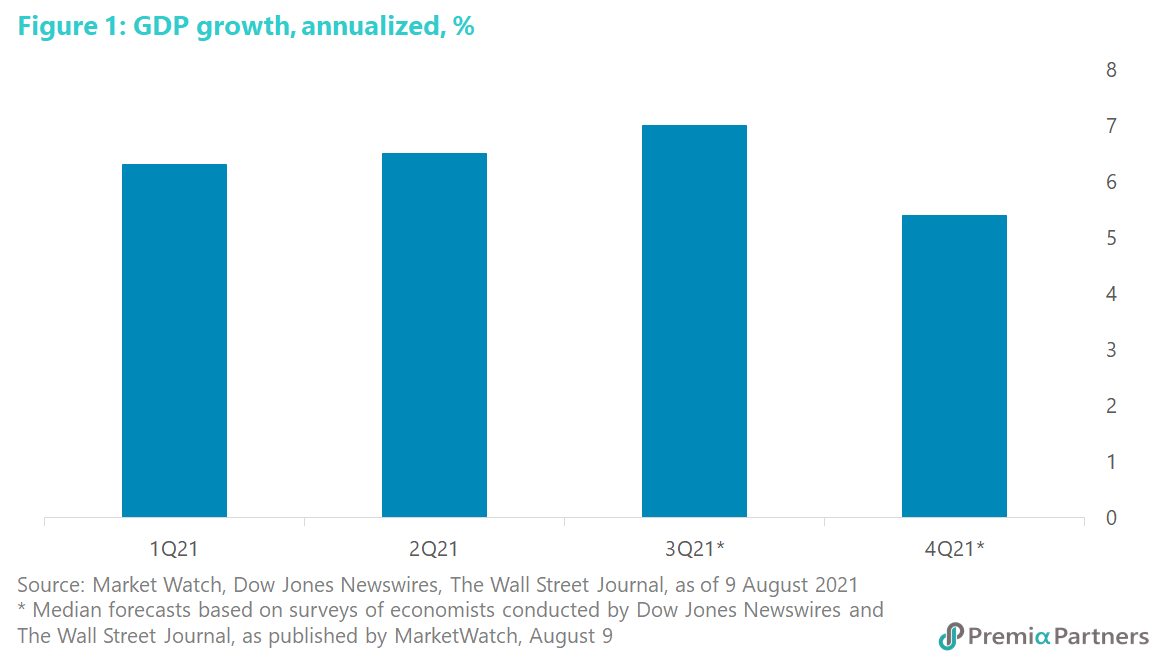
Despite the 2Q disappointment, the market is still expecting around 6.7% GDP growth for the full year 2021. To achieve 6.7%, the US economy is going to have to turn in around 8.0% growth in 3Q21 and 5.0%-6.0% growth in 4Q21. Those are the sorts of expectations still around: The market is expecting anything from 7% (Dow Jones Newswires and The Wall Street Journal survey median consensus) to 8.3% (Moody’s Analytics survey median consensus) in 3Q21 (figure 1).
Of course, we can’t rule that out. Yet, the odds are challenging given the disappointment in 2Q21; the fading of the March 2021 “helicopter money drop” which boosted household income by a whopping 21%; and the rising COVID-19 cases in the US.
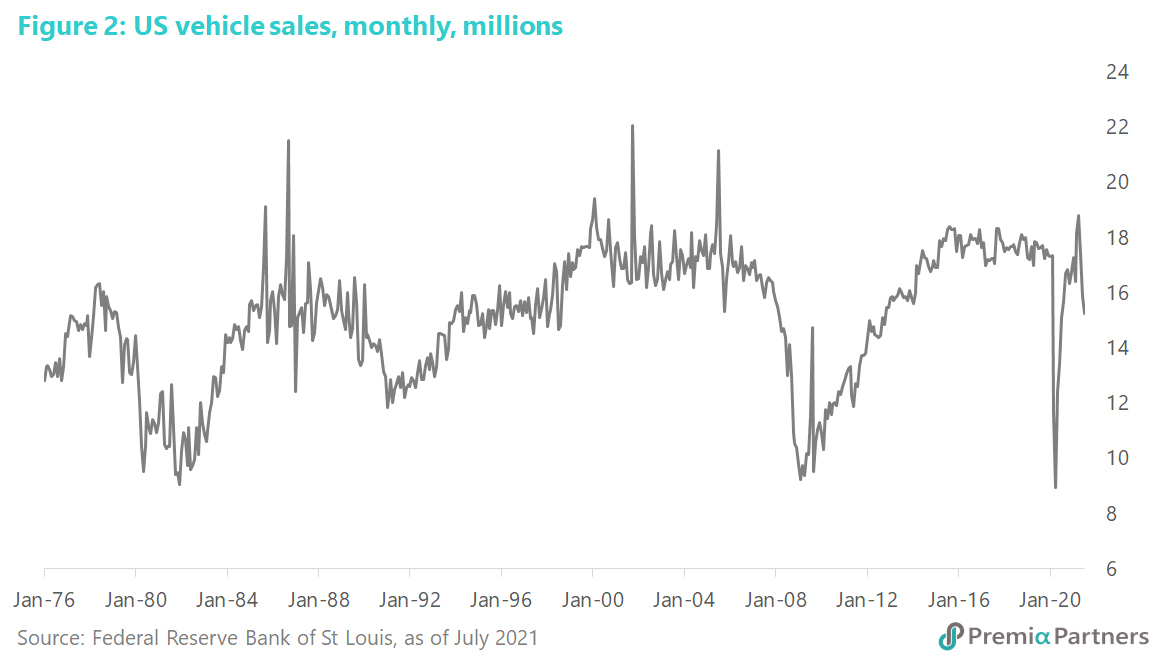
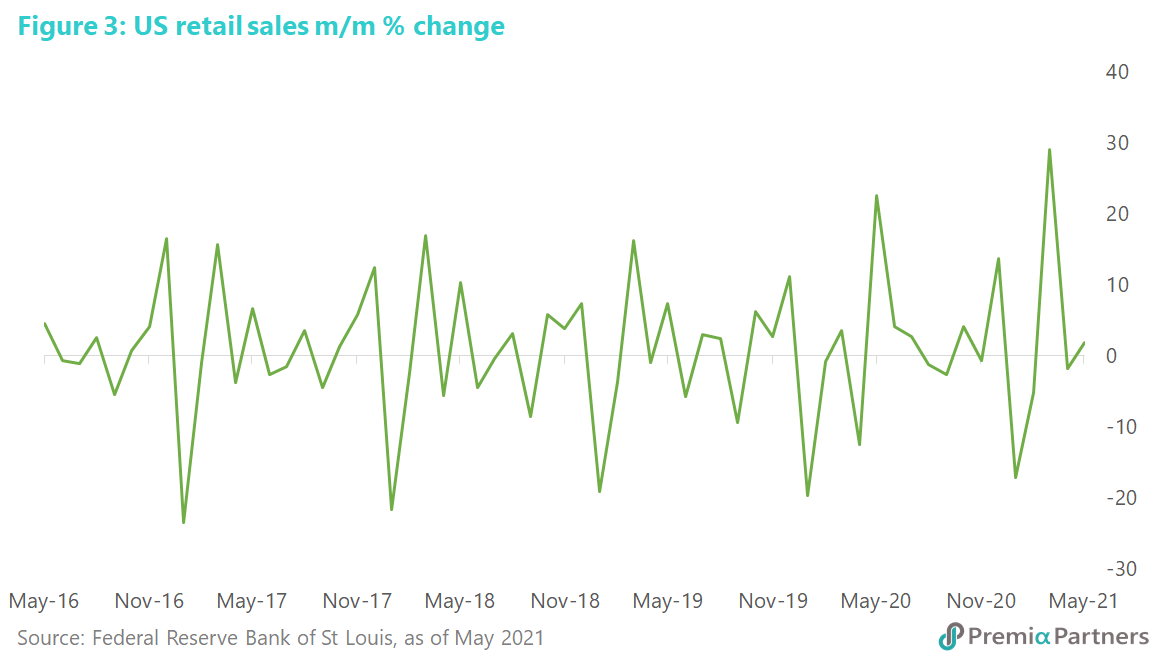
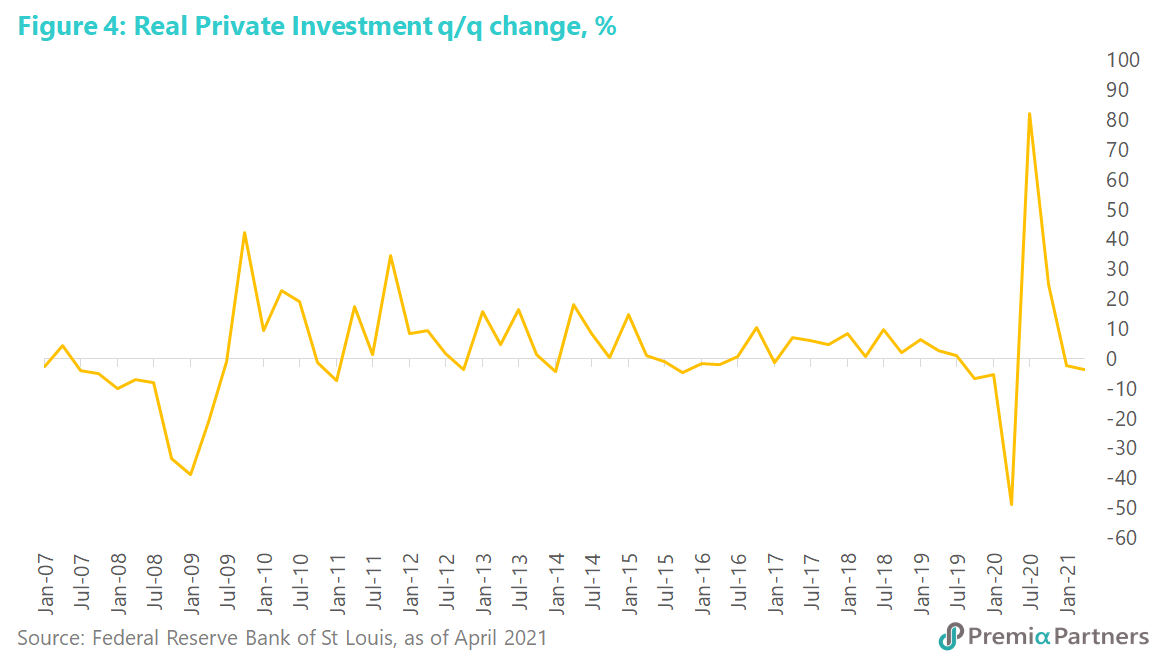
Indicators and proxies for the drivers of GDP growth are showing signs of cyclical reversals. US vehicle sales peaked in April, and has come off since (figure 2). Retail sales peaked in March and came off quite substantially in April, before a small bounce in May (figure 3). Private investment q/q growth surged in 2Q20 off depressed lows, but has since eased (figure 4).
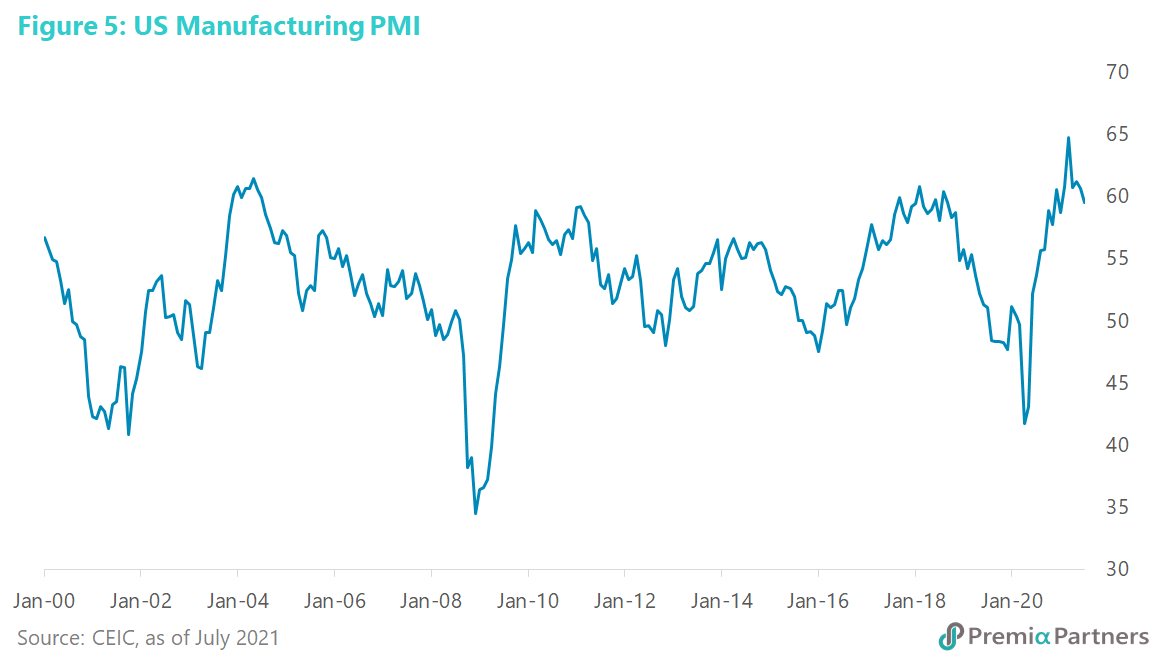
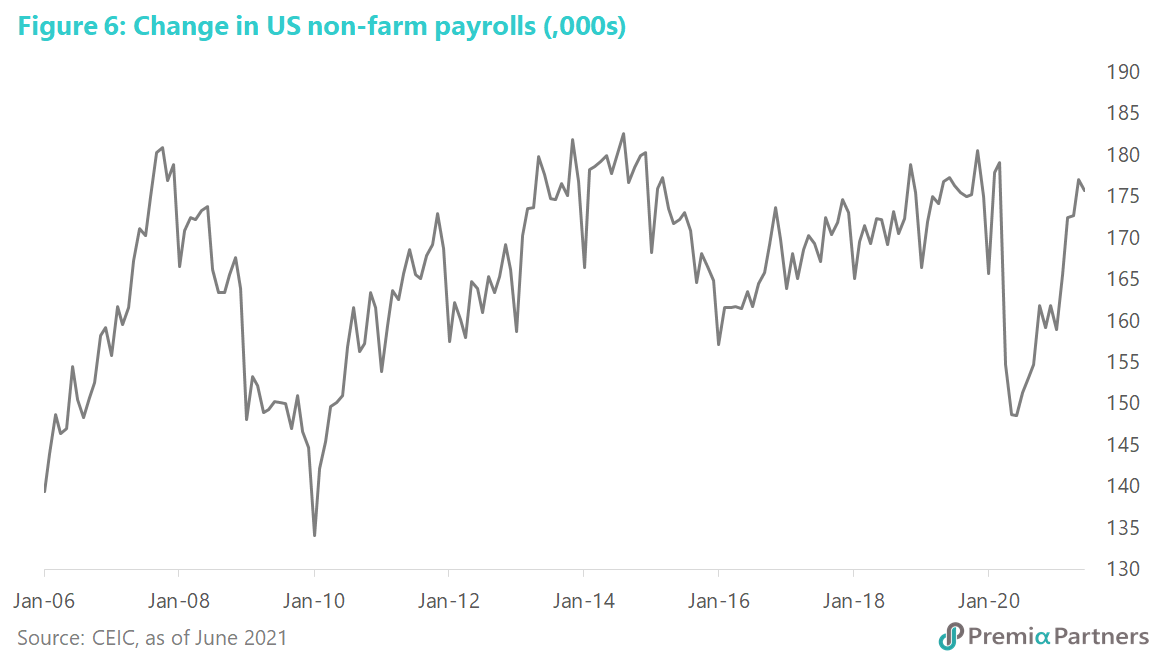
The ISM US Manufacturing PMI also peaked in March and has been easing over the past four months (figure 5). Meanwhile, the growth in non-farm payrolls is approaching cyclical peaks of 180,000. It eased a bit in June (figure 6).
Of course, most of this data supports the idea that the US economy continues to grow – indeed strongly, by historical standards. Yet, it is the incremental gains versus expectations that often matter more to markets. Indeed, the data could flip back up again. The point here is simply that the headwinds against bigger gains are considerable.
Peak stimulus means another “sugar hit” is unlikely. Indeed, the daily chatter from Fed officials now is about the timing of the tapering of asset purchases (likely to be in a few months from now) and the timing of the first interest rate hike (either late-2022 or early 2023).
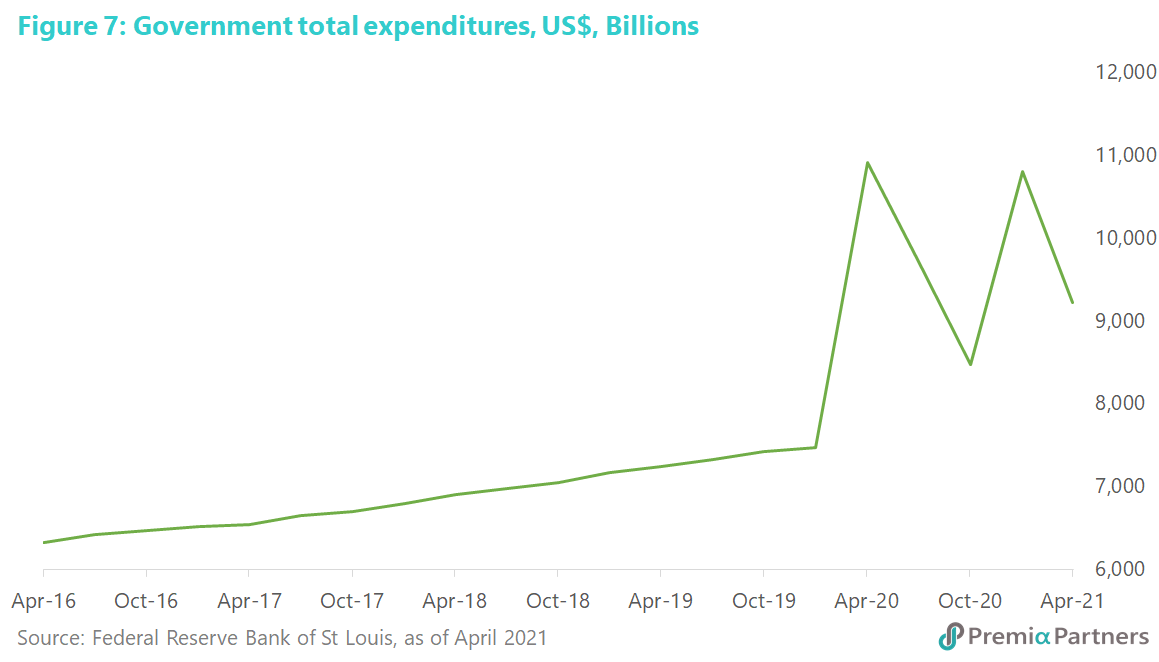
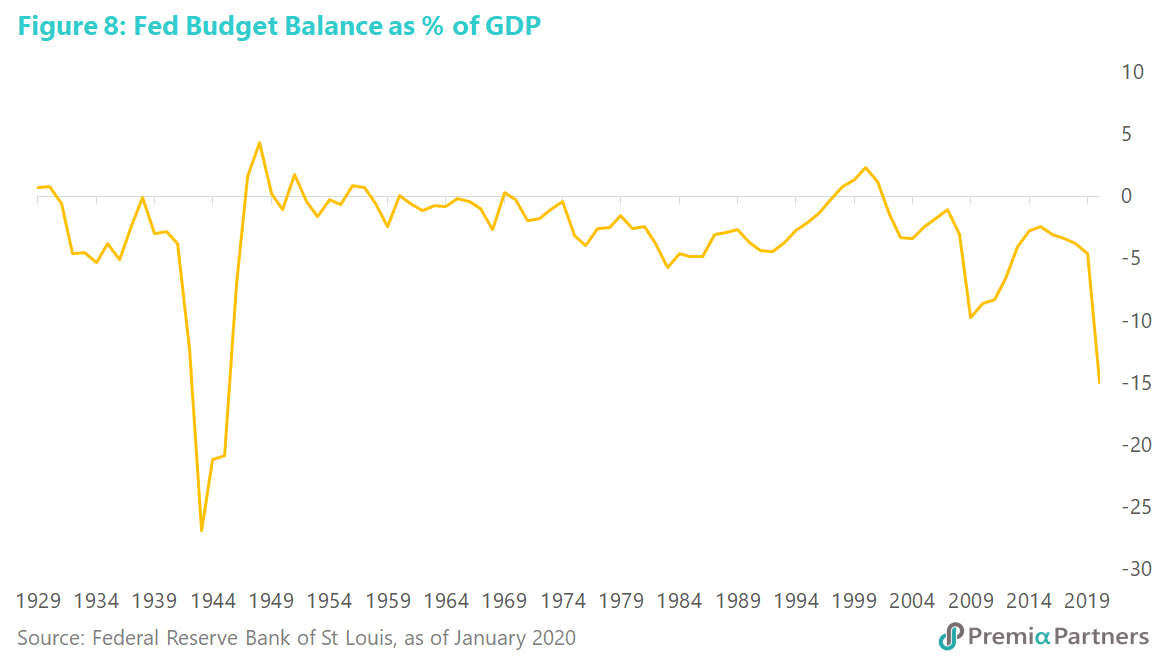
The seasonally adjusted annual rate of US total government spending appears to have hit a ceiling at just under US$11 trillion (figure 7). With the threat of inflation and political bickering over the debt ceiling lurking in the background, it seems unlikely that we will see a stronger fiscal impulse over coming months. Note that the US Federal budget deficit is running at around 15% of GDP, exceeded only by the spending during the darkest years of World War Two (figure 8).
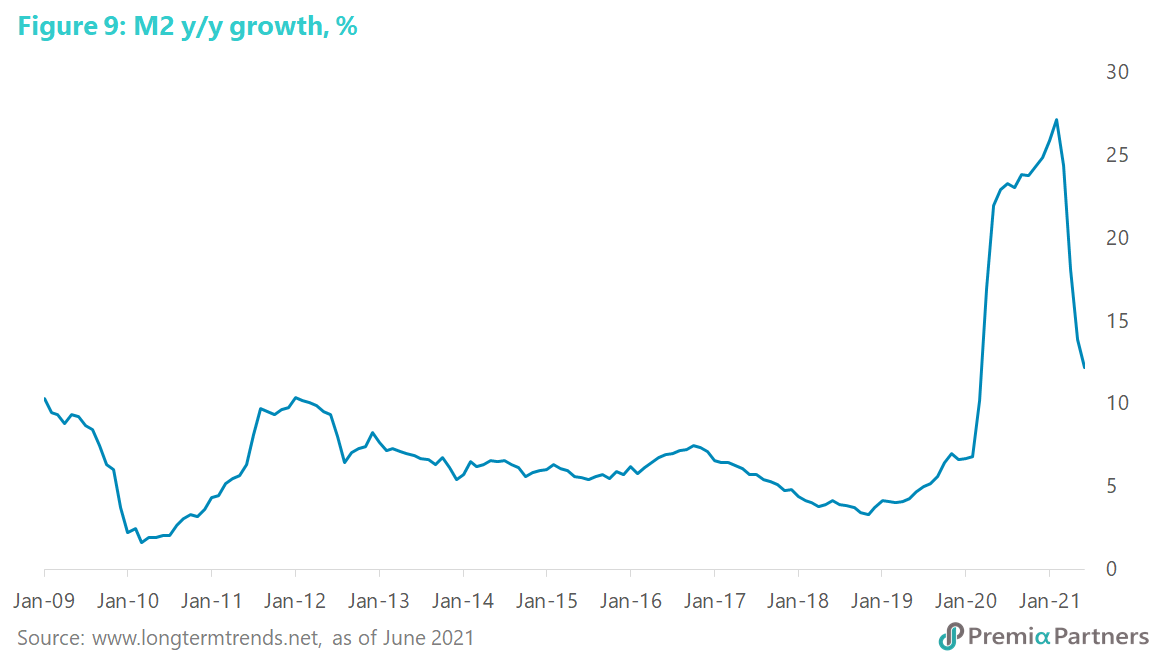
Note also how US M2 money supply has been declining in year-on-year terms since peaking in February. This combined with the recent rapid growth in the GDP means that the “excess liquidity” which typically drives asset prices is coming down (figure 9).
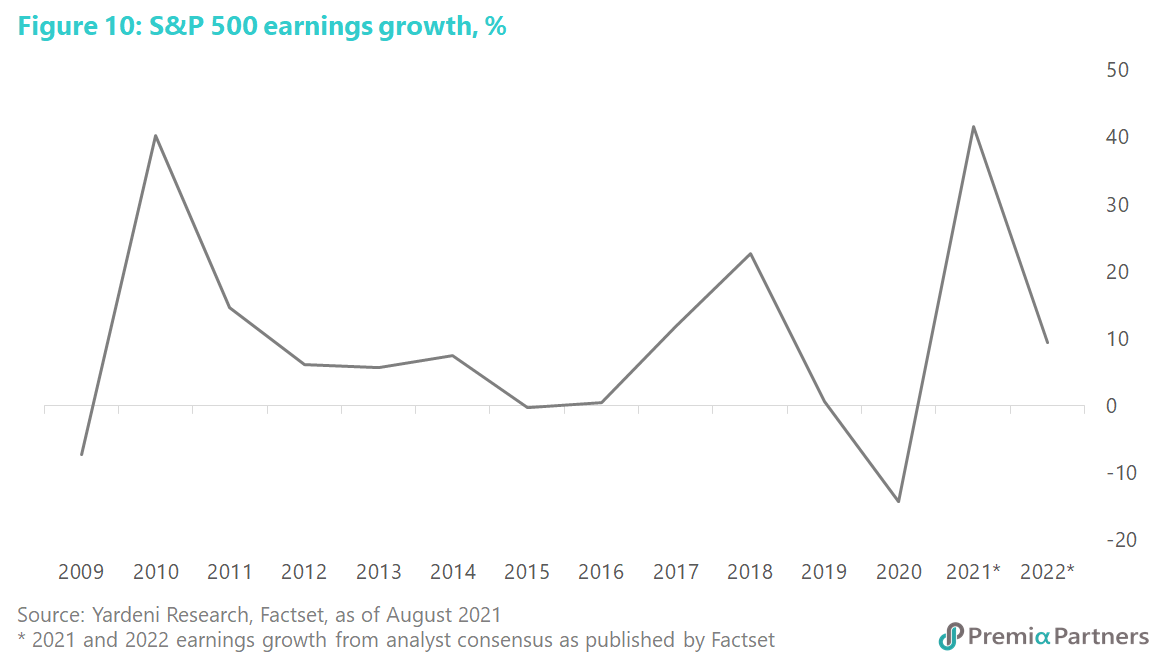
Peak earnings – what to do to impress the market after 88.8% growth? With around 90% of S&P 500 companies having already reported their 2Q21 earnings, the EPS growth rate is running at 88.8% y/y. The question now is how to impress investors after a performance like that. The analysts’ full year earnings growth forecast for the S&P 500 has crept up from around 37% before the start of the earnings reporting season to around 42% now. And that, by the way, was approximately where the last peak in S&P 500 earnings growth came in at for 2010 (figure 10).