
The first quarter of 2018 was a story of 2 halves. January was an aggressive move up in global markets, including A-shares across the board. It was essentially a continuation of 2017, with many of the same factor and sector performance dynamics. The correction from early February onward put a stop to that momentum trade, with A-shares seeing a wholesale rotation to different factor/sector results. Our New Economy and Bedrock ETFs underperformed in January but made up significant ground in February and March, so much so that New Economy (3173 HK) was one of the few A-shares strategies to deliver positive returns in Q1.
Q1 overall
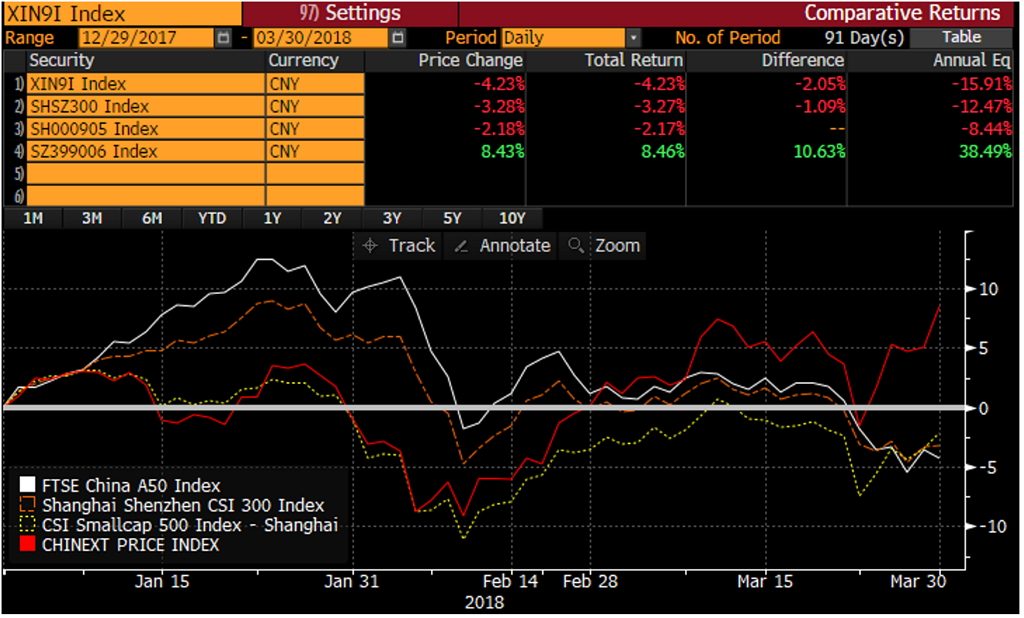
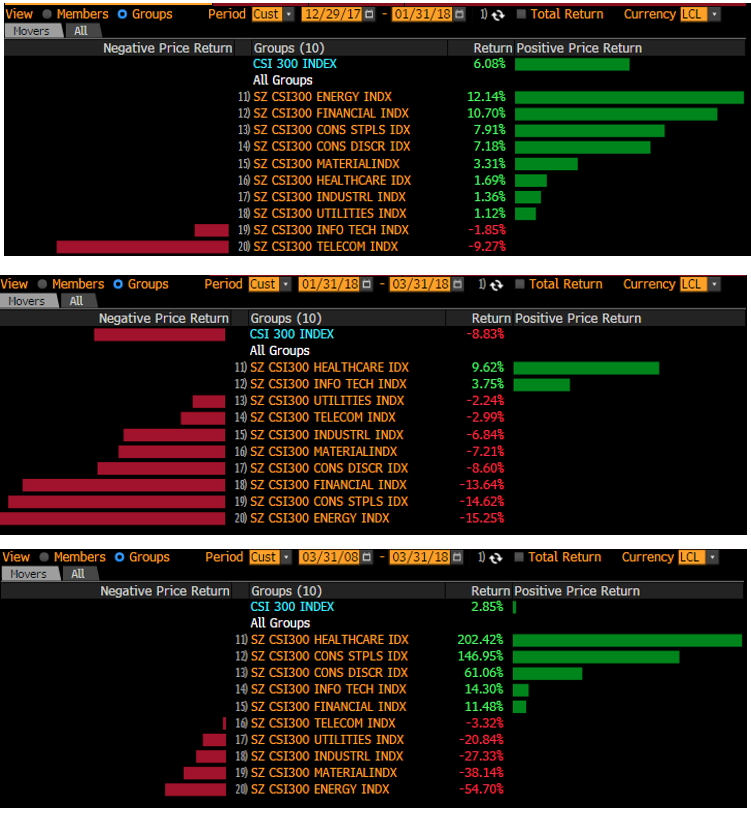
ChiNext led the market with a positive of 8.5% whilst FTSE A50 was down by 4.2%. A complete reversal of 2017. The A-shares market overall trended down with other global markets and the mega-cap rally ran out of steam. Sector wise, new economy sectors such as health care and information technology managed to have a positive return of 10.1% and 1.3%, respectively. All other sectors were negative, with telecom and consumer staples leading at -13.2% and -8.0%. All of this happened in February and March, with January looking like a continuation of 2017 – strong performance from financials and mega-caps. Momentum was king. But as the global correction got under way, it was the recent leaders that fell first. Investors began to take profit on their winners and refocused allocations to new economy and mid/small-cap stocks. The movement was in sync with policy agenda at the Two Sessions, held in March, emphasizing a shift in the economic growth model to focus on quality instead of quantity of growth. It was also in line with increased trade tariff rhetoric – new economy and smaller stocks are less exposed to global trade dynamics.
Q1 performance by market cap Source: Bloomberg, as of 2 April 2018
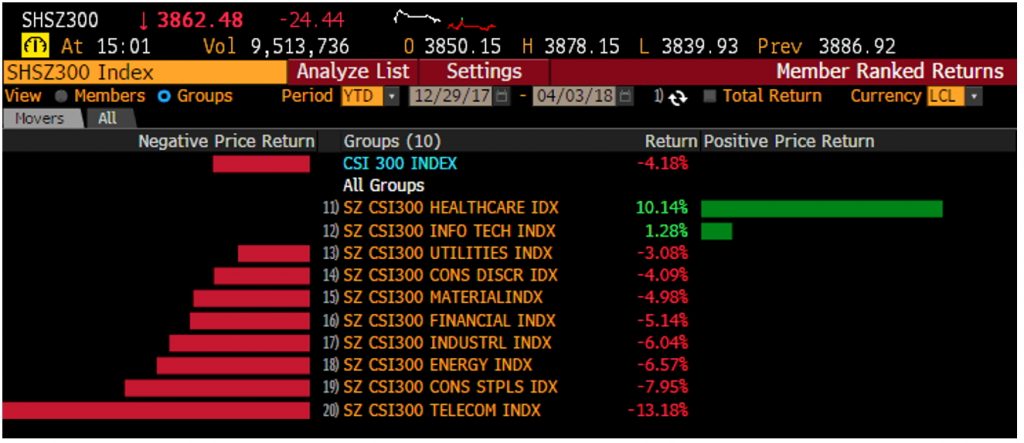
Q1 performance by sector Source: Bloomberg, as of 2 April 2018
Factor results
Going forward, thanks to our friends at Rayliant, we will also include comments on factor patterns as well as traditional sector and macro drivers of returns. During the quarter, factor returns were subject to the same January vs February/March dynamic. January was led by Value and Low Risk, while Size suffered. This is in line with FTSE A50 outperformance, given mega-cap financials are not overly rich and score well on low volatility given their one-way performance in recent years. February and March witnessed completely different factor dynamics, with Value and Low Vol retreating into negative return territory by quarter-end. Instead, Quality and Growth ended the quarter positive and Size recovered nearly all of its January losses.
Source: Rayliant Global Advisors, as of 10 April 2018
What will we see in the rest of 2018? January or February/March?
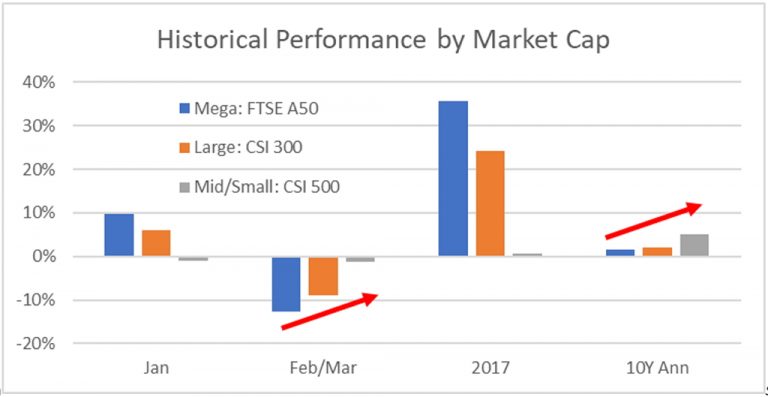
Given the starkly different dynamics, many clients asked for our thoughts on which version of A-shares we expect to see going forward. Should we position for January or for February & March. Wihle there is no crystal ball to answer this question, we do have some compelling long-term data that points to February & March being the norm. Below are data points for Jan, Feb/Mar, 2017 and 10Y returns through the lens of market cap and sector allocations.
Market cap – 10Y returns point to 2017 & January mega-cap outperformance being an outlier: we expect broader market cap exposures to continue to outperform.
Source: Bloomberg, Premia Partners, as of 26 Jan 2018
Sectors – the last 10Y have been led by healthcare, consumer and technology stocks. It’s not lost on us that this is the exact composition of 3173 HK, though we have to admit we are a bit embarrased not to have built this chart earlier on.
Source: Bloomberg, as of 2 April 2018
Relative Value in Large vs Small
The biggest shift of the quarter was of course in the small vs large trade. We’ve been talking about this for a while, pointing out that both valuations and recent performance suggest that it might be time to underweight mega-caps. To recap, mid/small-caps retrenched from their 2015 peak to a PE sub 30x while mega and large-caps continued to trend up (left chart). The gap in large/small valuations is close to all-time tights – you can barely see the February/March correction in relative valuations (right chart). There is still more room for this relative value trade to run.
PE Ratios
Source: Bloomberg, Premia Partners, as of 2 April 2018
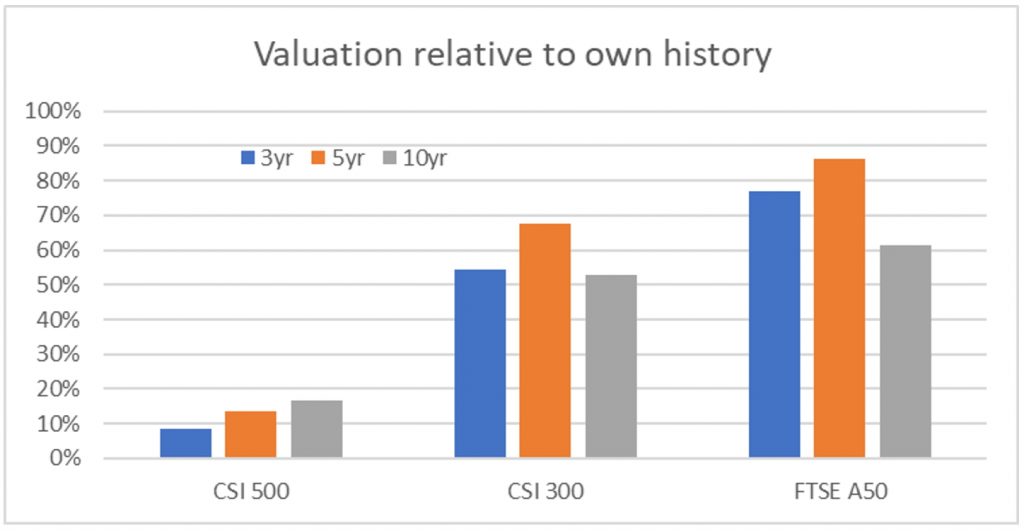
Here’s another way to look at the dispersion. Mid/small-caps are currently trading in the ~10th-20th percentile in valuations relative to their own history. In contrast, mega/large-caps are trading in the 50th-60th percentile vs the last 10 years. Over a shorter horizon, mega-caps in particular look rich in the 75th-85th percentile vs the last 3-5 years.
Relative Historical Valuations
Source: Bloomberg, Premia Partners, as of 2 April 2018
Premia A-shares ETFs
In terms of our ETFs, now that we have our first full quarter behind us, we can start to look back at their behavior. Here’s a quick summary of what you need to know:
Summary statistics at quarter-end (in US$) – slow but steady growth in AUM and turnover. We saw multiple creates in both ETFs and an improvement in turnover from January to March.
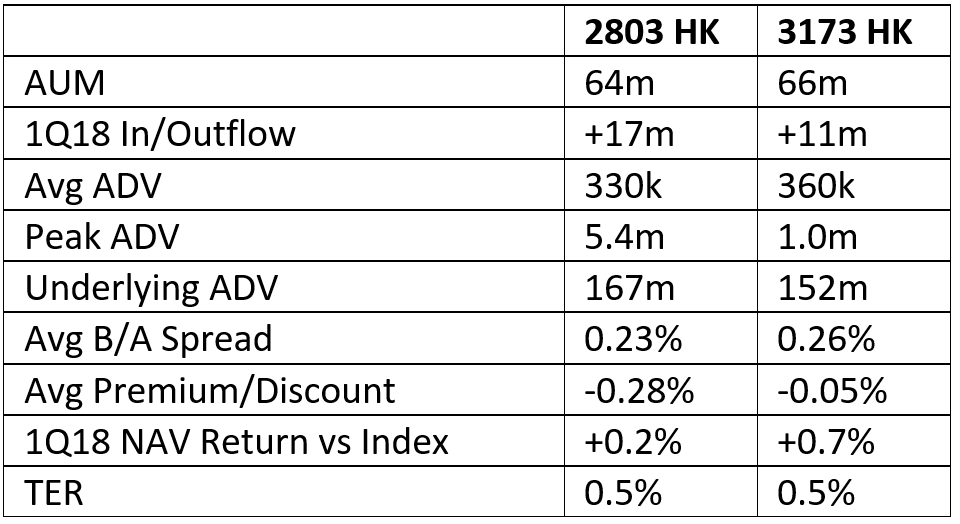
Source: Bloomberg, Premia Partners, as of 2 April 2018
Premium/Discount relative to other ETFs – despite launching less than 6 months ago, both 2803 HK and 3173 HK held their own in terms of premium/discount levels vs the more established ETFs. 2803 HK and 3173 HK averaged -0.28% and -0.05% in discount since inception. Don’t worry if you can’t spot the Premia ETFs immediately without looking at the legend. That’s the point – their premium/discounts are in line with the leading A-shares ETFs.
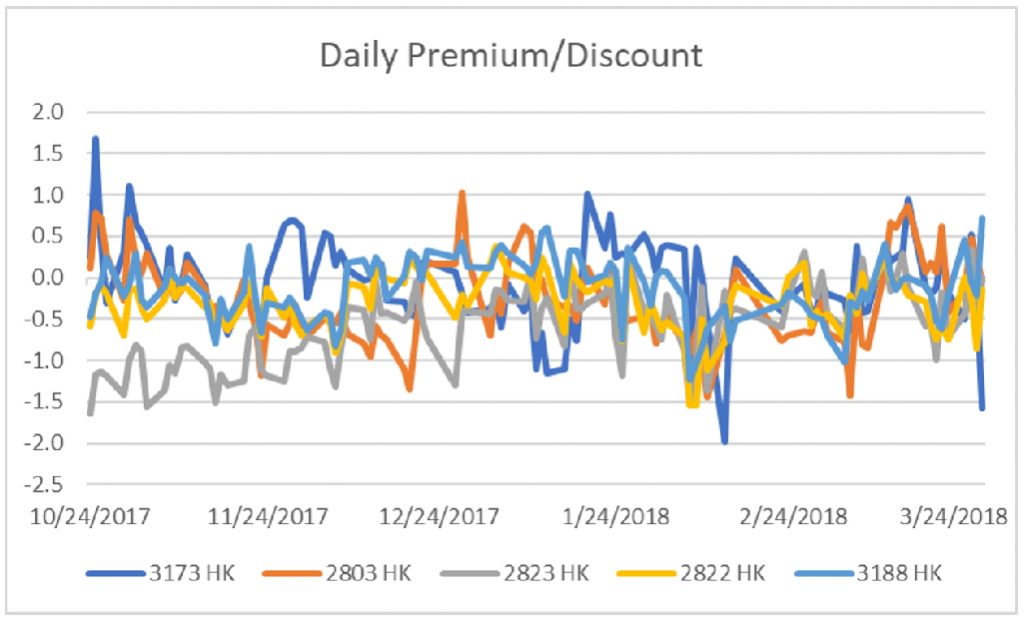
Source: Bloomberg, Premia Partners, as of 2 April 2018
Index Return vs mainstream indices – The CSI Caixin Rayliant New Economic Engine Index (the index used by 3173 HK) outperformed all 3 of the major benchmarks (FTSE China A50 Index, CSI 300 Index, MSCI China A Inclusion Index) while the CSI Caixin Rayliant Bedrock Economy Index outperformed two of the three. Unsurprisingly, relative performance tracked the earlier-mentioned dynamics – underperformance during January and outperformance in February and March.
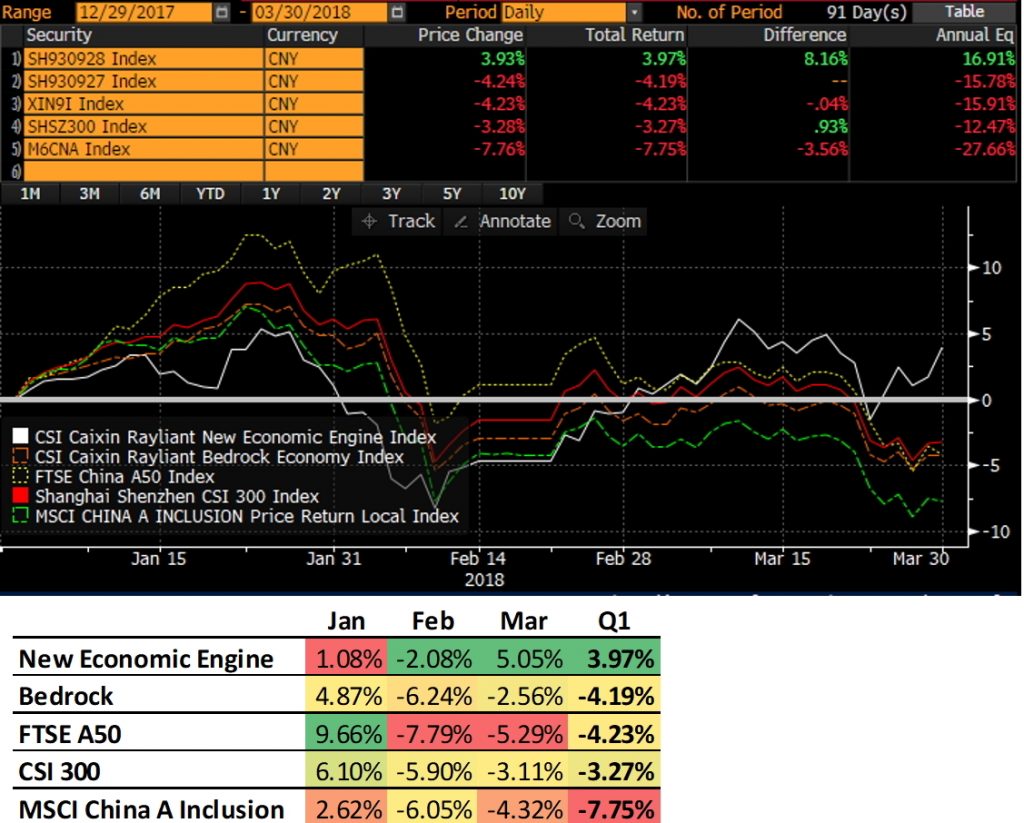
Source: Bloomberg, as of 2 April 2018
3173 HK Performance Drivers – 2 things dominated returns: strong performance from its key sector exposures and its overall exposure to smaller stocks given its all-cap universe. Below is a Bloomberg attribution of returns for 3173 HK over 1Q18.
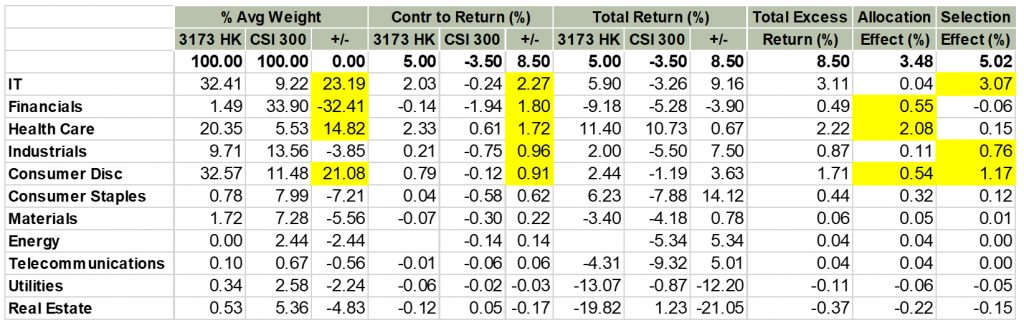
Source: Bloomberg, as of 11 April 2018
The single biggest contributor was selection within the tech sector. Note that even though the overweight was high, it wasn’t the allocation to the sector that drove returns, but the selection of stocks, i.e. both our smart beta application and our all-cap approach (tech stocks not available in CSI 300). The financials underweight and healthcare overweight benefited performance, though selection from both sectors had a muted impact. Lastly, the consumer discretionary overweight and selection also contributed to returns.
2803 HK Performance Drivers – the story is quite different for 2803. It underperformed slightly vs CSI 300 during the quarter, but the drivers were quite widespread. The average over/under-weight for each sector was ~2%, which resulted in minimal performance impact from allocation. Security selection in real estate, healthcare and consumer discretionary, however, hurt returns. A stronger impact from selection makes sense for 2803, given its active share of 48% vs CSI 300 and only 154 stock overlap.
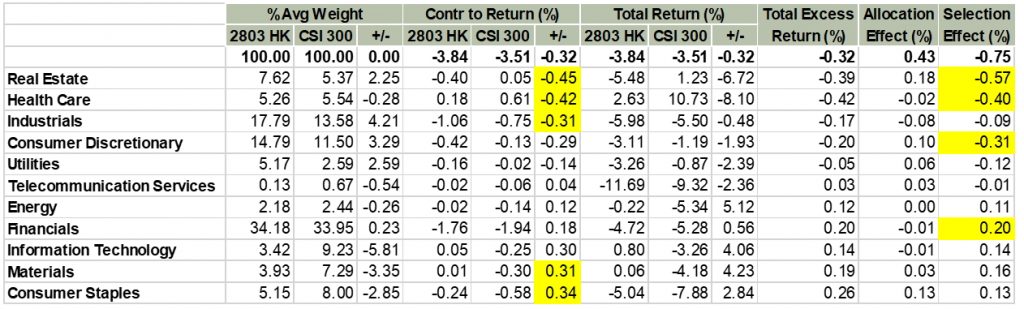
Source: Bloomberg, as of 11 April 2018
*********
Apologies for the long read. This was our first quarterly update and we’ll get better at them. Hopefully it was useful, and as always, should you have any questions, don’t hesitate to ask.
