What do you think about the COVID recovery in China? Is the growth trajectory still intact? Do COVID or the US-China tension change anything?
China is among the first batch of countries that got hit by the coronavirus in early this year. An immediate nationwide lockdown with strict social distancing measures eventually helped stop the spreading subsequently. While the rest of the world is still fighting the virus at the moment, China is already showing a solid recovery in macro economy as shown by most indicators including PMI, industrial output, power consumption and data traffic. No one has the crystal ball to tell the future, say whether the virus will mutate and come back with more harms, but everyone can agree that China has been doing relatively well in handling the COVID effectively and rapidly.
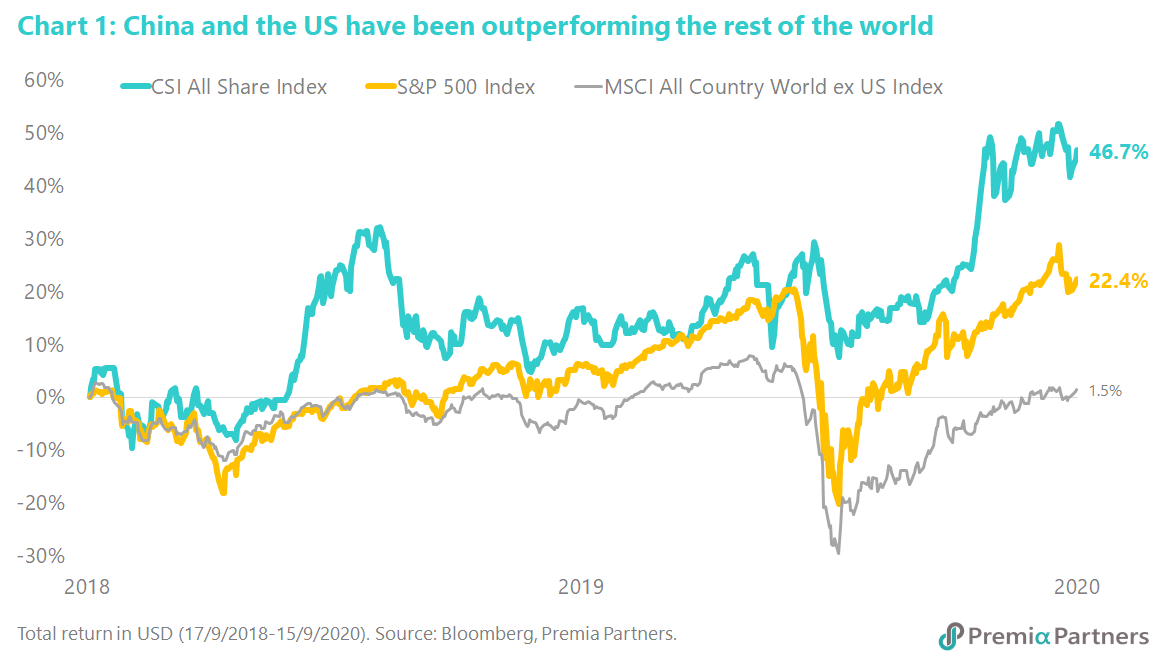
Both COVID and US China tension have been two major concerns for global investors so far this year, creating substantial volatility in the past few months. Judged by the sharp rebound in global equities, market seems to look beyond the infection and starts to factor in the potential launch of vaccine in the next 12 months. On August 16th, Chinese authorities have granted the first invention patent to a domestically developed COVID-19 vaccine candidate, which is co-developed by Chinese biopharmaceutical firm CanSino Biologics and Chinese military infectious disease expert. While it will take time for the successful vaccine to materialize, this can boost up market confidence that China is building an edge on the vaccine developments. For the US-China tension, investors may have to differentiate the noise from the elements driving the market as both China and the US markets are the ones outperforming the rest of the world, represented by MSCI AC World ex-US Index, since the beginning of the trade war two years ago (Chart 1). Something good for news headline may not necessarily be relevant to the capital market in a medium term.
Would Tik Tok, WeChat and the heightened US-China tension pose much higher risk for China investing going forward? Is the tech sector particularly at risk?
Certainly, it is a pity that Chinese social media firms are not able to further develop their business in the US markets in near-term. The new rule, however, will not create much damage to these listed companies’ earnings. For example, both Tencent and NetEase have only 2% of revenue coming from the US. Besides, no investor would have expected these companies will generate substantial business in the US given the increasing tension between the two largest economies. With the US presidential election getting closer, it is probable to see more conflicts between China and the US in various aspects including technology transfer. That said, investors should not forget that most Chinese technology companies are serving the domestic market. Besides, Chinese government has been adopting different policies to support further development of the technology industry, including semiconductor, software, artificial intelligence, and robotics and automation. With or without the disturbance from President Trump or his cabinet, China is emerging with strong macro growth whilst Chinese equities are getting more interests globally. Investors may consider any sudden sell-off driven by market sentiment as the opportunity to buy on dip.
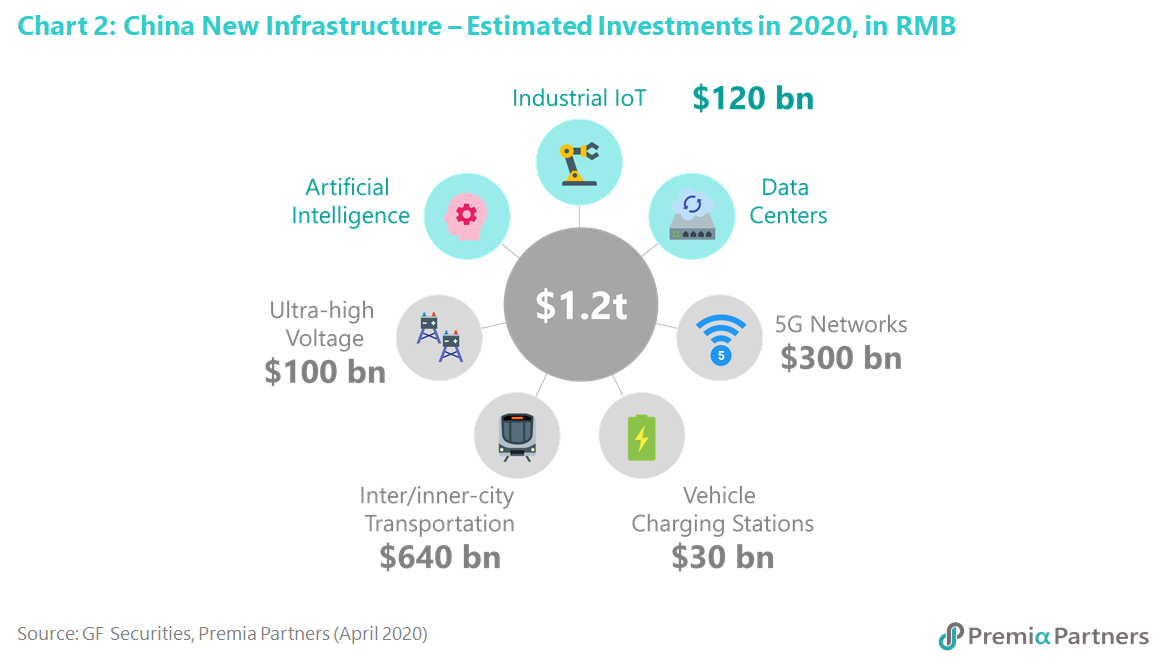
We should bear in mind that US Presidential election will take place in November although it is hard to predict whether the uncertainties will ease or not after the elections. But from another perspective, the heightened US-China tension is something pushing the Chinese authority to foster the development of home-grown tech companies. Currently, the Chinese government is especially supportive on New Infrastructure, which is part of China’s stimulus package to restore the economy growth from the pandemic (Chart 2). With emphasis on 5G network, data centers, IoT and cloud computing, this will definitely brighten up the domestic economy. It will also speed up development of the software and EV battery-related industry.
What do you think of supply chain reconfiguration? Do you worry about manufacturers moving out of China? Are ASEAN, Vietnam and China complementary or either-or option for Asia growth allocation?
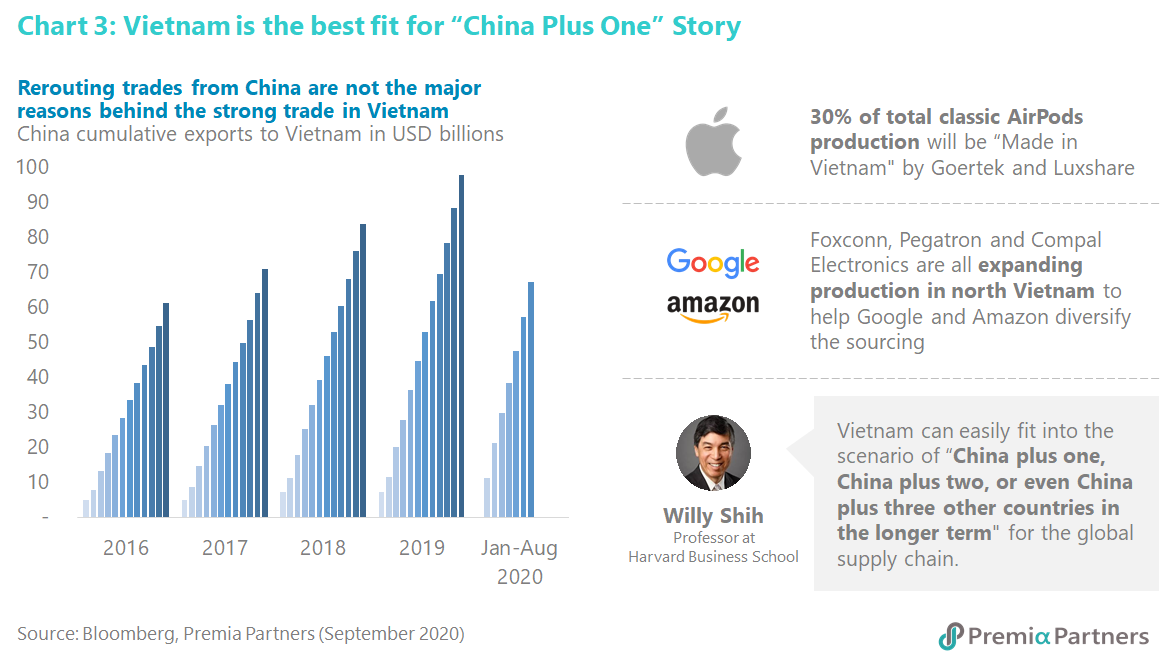
China has become one of the most important manufacturing hubs globally since joining the WTO in 2001. It is rational to see the role of China as a low-cost world factory will change with increasing labour cost, rising land price, environmental concern, needs of economic transformation, etc. That said, the efficient infrastructure, diligent and knowledgeable workforce, pro-business government policies, and effective supply chains are still well in place in China. All of these will need decades of time and resources to build and cannot be replaced by other smaller economies immediately. For the supply chain reconfiguration, it is more likely to be a “China plus” model going forward, referring to a complementary model that China can co-exist with other production bases. China will climb up the ladder to produce more value-added products in future, while countries in ASEAN and particularly Vietnam will take over the low-cost manufacturing from China. In fact, Vietnam is one of the fastest growing Asia economies, alongside with incentives such as tax breaks, CPTPP, and free trade agreements, it has truly fostered a foreign firm-friendly business environment (Chart 3). For investors wanting to take advantage of this secular change, an allocation in ASEAN and Vietnam alongside China would be the right exposure.
What past period will the next cycle look like?
In terms of business cycle and the impact on returns, it is certainly true that almost mechanically YoY GDP growth next year has to be exceptionally strong if only because it is exceptionally weak this year. However, there are a couple of points that would suggest that this is priced. The first is that valuations are high — at least in the US with the S&P 500 at 29 P/E. (Of course, China and emerging markets in general are far cheaper.) Second, the relationship with per capita GDP growth and stock returns is weak in both time series and cross-sectionally (Dimson, Marsh, and Staunton 2013), though population growth interestingly has a strong positive relationship with stock returns over long periods of time. With respect to GDP growth, it appears that stock returns lead GDP growth and not the other way round. Moreover, there is no contemporaneous relationship between GDP growth and stock returns. We confirmed DMS’s findings at Research Affiliates about 7 years ago. More importantly, we found that this disconnect seems to arise from a disconnect between GDP growth and corporate earnings growth. That is, GDP growth and the earnings growth of public companies do not co-move particularly strongly.
That is not to say that we expect the market to fall. It is just that we have found the link between economic growth and stock returns to be sufficiently weak that even with foreknowledge of strong contemporaneous GDP growth, it would not drastically affect our investment decisions.
Is the value factor dead?
Value factor is inherently cyclical and tends to perform worst during economic slowdowns and contraction, which is now. Having said that, valuation spread is also the largest for 20 years +, and in the U.S., the level is even higher than that of the 2000 Dot Com bubble period. Although it is hard to time the exact come back of value factor, undervalued stocks with strong fundamentals will definitely benefit once the narrowing of valuation spread takes place.
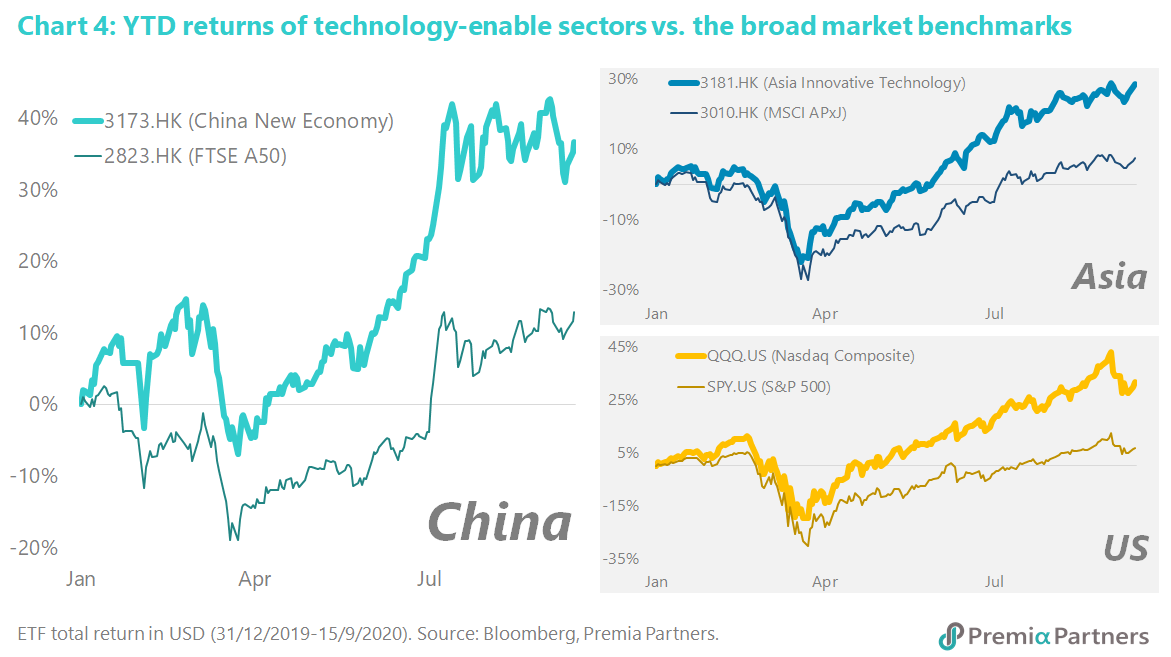
Would China new economy and Asia innovative tech be too expensive now, since they have already gone up quite a lot since last year?
Growth opportunities are getting scarce even in the pre-coronavirus era. With the virus spreading globally, it becomes more challenging to capture the growth in the market, explaining the premium that the market is willing to pay for the companies who manage to expand in the difficult times. New economy and innovative technology firms do not only grow faster with their original business with the lockdown, but also develop new revenue streams with changing user behaviour. The premium is justified with the strong growth prospects. Besides, this phenomenon is not limited to China or Asia as Nasdaq Composite also outperformed S&P 500 by a large margin this year.
Moreover, under the current low yield environment, allocations from fixed income are likely to be switched into equity, and the COVID situation actually accelerates digitalization and automation in both the DM and EM countries. Thus, New Economy and innovation-focused businesses will further benefit, and hence further upside.
Chart 4 shows the YTD performance comparison of the following ETFs: 3173 (China New Economy) vs 2823 (FTSE A50) in China, 3181 (Asia Innovative Technology) vs 3010 (MSCI APxJ) in Asia, and QQQ (Nasdaq Composite) vs SPY (S&P 500).
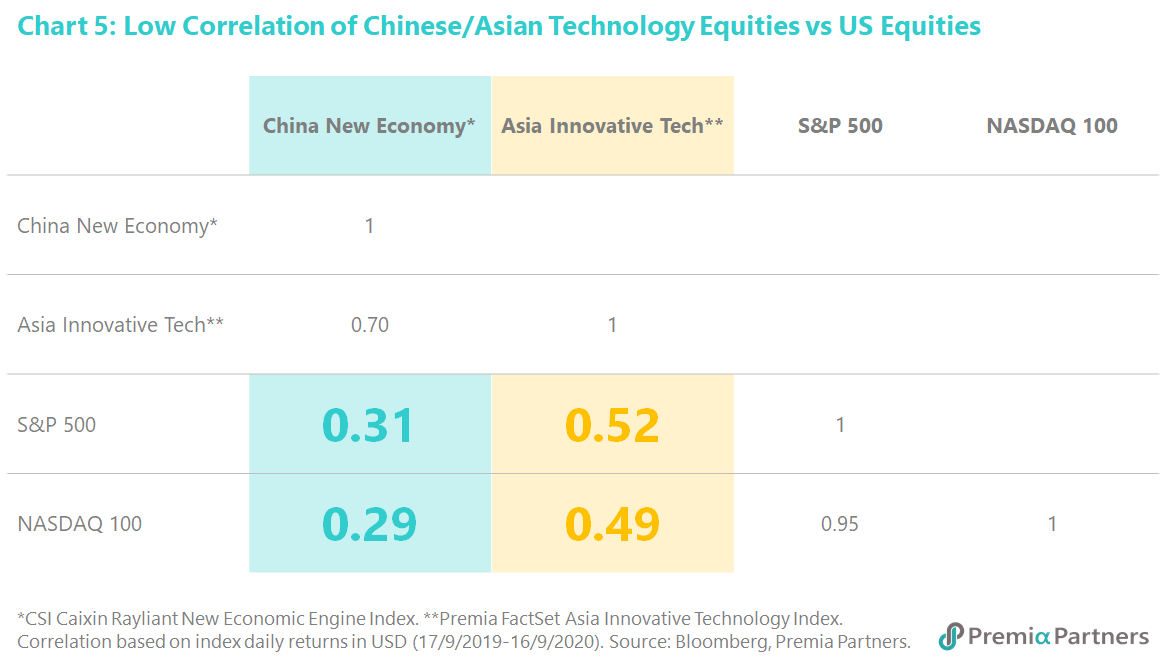
What is the correlation like between China new economy and Asia innovative tech, with S&P and NASDAQ? Is there diversification benefit?
China New Economy has a correlation of around 0.3 with S&P 500 and Nasdaq 100 while Asia Innovative Technology has a correlation of around 0.5 (Chart 5). Given that both correlation figures are below 1 quite substantially, combining them into a pure US exposure portfolio could bring the overall volatility down.
Do you worry about the retail traders in China? Is there a bubble brewing like in 2015?
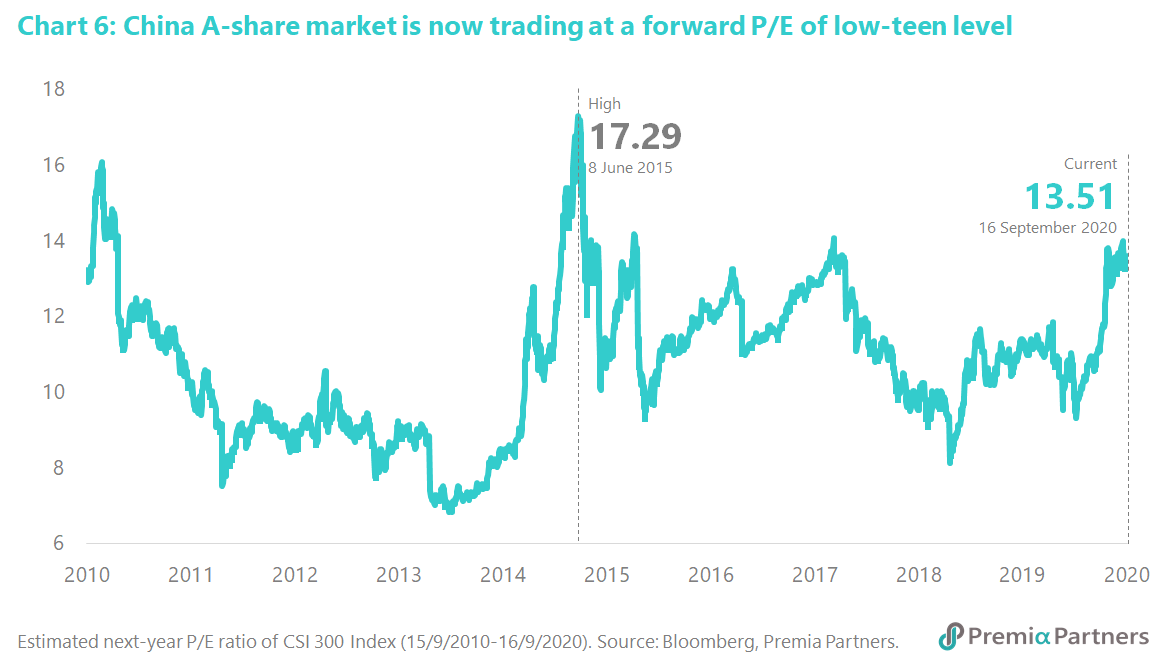
Unlike the case of Robinhood in the US, China A-share market is always consisting of a large amount of domestic individual investors. One may suggest it can contribute to a higher volatility in the market. Every coin has two sides though. Dr. Jason Hsu, our Senior Advisor, and his team also found out that the higher involvement of non-sophisticated investors may provide more opportunities for institutions to capture the alpha in the market. Compared with the boom-and-bust cycle in 2015, there are a few major difference this time including: (1) the government’s proactive measures to reduce the liquidity as shown from the PBOC’s operation and credit numbers; (2) the regulators’ control in taking down illegal margin financing to prevent excessive flows into the stock market; (3) the authorities not limiting the supply of equity this time versus an official IPO freeze in 2015; (4) no ban of short-selling unlike what happened in 2015 leading to artificial inflatable share prices; (5) smooth trading with neither voluntarily suspension from the listed firms nor introducing circuit-break mechanism. (6) In July, the state-owned China Securities Journal emphasized the importance to foster a “healthy bull market”, warning the public about the stock markets getting overheated. (7) The increase and total amount of margin loan is still below 2015’s level. Last but not least, the following valuation chart shows the overall A-share market is trading at a forward P/E of low-teen which is hard to qualify as a bubbly level (Chart 6).
Can you comment on the potential delisting of Chinese ADRs listed in the US, and the homecoming of Chinese tech companies?
Recently, a group of U.S. regulators said stock exchanges should set new rules that may trigger the delisting of Chinese companies, adding to concern that investors are being exposed to fraud. Similar criticism has been floating in the market for a few months. That explained why some US-listed Chinese ADRs have already begun to arrange secondary listing either in Shanghai or Hong Kong. Indeed, a few of them such as Meituan and JD.com were successful to get listed in Hong Kong earlier this year. More Chinese firms are expected to come back for listing in this region, which is positive news for investors located in Asia as they can do the trading in the same time zone going forward. China A and Hong Kong markets will have increasingly more leading quality tech names to get listed and, which we believe these are opportunities that global investors do not want to miss! In a short-term, China A-share new economy would be the optimal exposure as these firms are immune from the delisting uncertainly in the onshore market whilst benefitting from the structural change of the economic model, which is emphasized by President Xi in the dual-circulation direction.
Between A shares, H shares and US ADRs – what would you prefer as allocation for China?
China A-shares would look more interesting because (1) it offers a lot of unique exposure such as advanced manufacturing, artificial intelligence, smart home appliance, robotics & automation that are not available in H-shares and US ADRs; (2) it is immune from the delisting risks of US ADRs; (3) there are increasing volatility and uncertainty in Hong Kong listed H shares as a result of the mounting tension between China and US; (4) it is not subject to the redemption risk of any global risk-off when investors sell emerging market funds or offshore China funds since A-shares is dominated by domestic flows; (5) policy supports a healthy bull market onshore; (6) it is relatively under-research and under-owned by international investors; and (7) it is likely to see further inclusion of A-shares into global indices in medium-term.
Should I invest in Premia CSI Caixin China Bedrock Economy ETF (2803.HK) or Premia CSI Caixin China New Economy ETF (3173.HK) now if I am positive on the outlook of China A-share market?
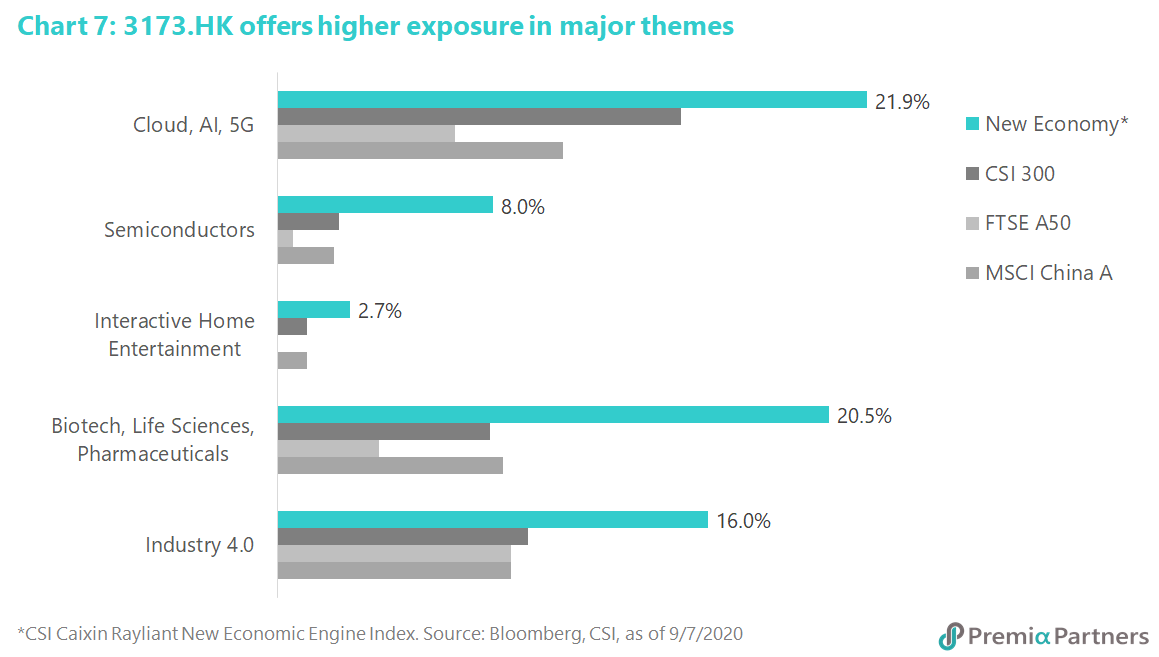
Both Premia China ETFs would be the appropriate investment vehicles for China A-share market. 2803 is aiming to capture the broad market exposure through a multi-factor approach with value, size, quality and low-volatility, while 3173 is leaning towards the new economy segments with a tilt to the exposure with light asset business models, stronger financials and growth prospects. Given the current market condition with the backdrop of US-China tension and the impact of COVID, 3173 may catch more attention from the market as it will benefit from the government policies emphasizing the domestic market, home-grown technology, robotics and automation, and biotech, etc (Chart 7). This secular trend is no different from the international markets where most investors are actively hunting for exposure that offers growth in the challenging environment.
[3173.HK] How could you identify growth potential if using historical information?
The CSI Caixin Rayliant New Economic Engine Index starts with a screening of “new economy industries” which are defined under CSRC Industry Standards in correspondence to the “China New Economy” concept first raised by Premier Li Keqiang in Feb 2016. This leads to the creation of sister economic index for Caixin Manufacturing PMI, the Mastercard Caixin BBD New Economy Index and later the investable version in partnership with Caixin (a leading financial media company in China) and our Senior Advisor Dr. Jason Hsu and his team at Rayliant.
This investable index that our ETF tracks is an all-cap strategy that intends to capture the new economy beneficiaries listed on China A shares. On top of the new economy universe, the index methodology then applied fundamental factors based on RAFI co-founder Dr. Jason Hsu’s research across to further screen with “light asset” and “financial health” criteria. With the fundamental screening, we reach a basket of quality growth new economy exposure – a sound set of new economy sector leaders that also have robust fundamental to keep up with the growth and structural changes of Chinese economy.
The reason why we use historical information instead of more dynamic unstructured data was because for prudence we have more confidence in the audited financials than unaudited company reports which could be subject to manipulation, or simply big data yet to establish robust causality with return and might be temporary noise instead. From growth and liquidity factor perspectives, we also can get forward-looking signals from pricing information and R&D expenses, which are covered in the final screens for growth and liquidity. That said, big data is used in monitoring and identifying new economy sectors, and might be augmented to historical data in index calibration at some point when we have more robust justification and alternative data set available.
[3173.HK] What does it mean by weighted by potential growth?
The weighting of the final constituents can be considered as starting from all equal-weighted and then adjusted by a Weight Factor between 0 and 1. This Weight Factor is determined based on each eligible holding’s growth score and liquidity score, which are calculated as follows:
o The Growth score is calculated as the simple average of the stock’s percentile rank on each of the following five items: (1) gross profitability, (2) operating profitability, (3) growth in total assets, (4) growth in book equity, and (5) R&D expense.
o The Liquidity score is calculated as the simple average of the stock’s percentile rank on the following two items: (1) daily average trading value and (2) daily average total market capitalization.
So, unlike a traditional market-cap based strategy, our new economy strategy is weighted based on capacity and growth.
[3173.HK] I found you have some exposure in Utilities and Energy sectors, while in the definition of your new economies also include light assets? How do these sectors fit this criteria? (or do you just have exposure in renewable energy?)
The initial “new economy industries” screen as described above does include eligibility of a subsect of utility and energy sector – namely those relevant to new energy (water, wind, heat, etc, as opposed to coal) and those relevant to environmental businesses. After the initial industry screen, the qualified companies then still need to pass the later screens of light asset (non-fixed asset scoring) and financial health, in order to reach the final eligible basket. The overall exposure in these two sectors are relatively low as you would expect. For instance, one with the highest relative weight (0.32%) is SPIC Dongfang New Energy, which is a new energy subsidiary of China’s State Power Investment Corporation. The new energy company announced earlier this year that it has received clearance to build a 400-MW wind park off the north-east coast of China in Dalian.
As renewable energy is an emerging industry, we have also found that some renewable energy players are often labelled as other industry sectors like industrial or semiconductor rather than energy – e.g. CATL which is the leading EV battery manufacturer and Longi Green Technology which is the leading solar panel manufacturer are both top holdings of 3173 that are not under the traditional GICS energy sector definition. Using only the GICS energy sector to screen Stocks often would miss the leading renewable energy players as it is more old energy oriented.
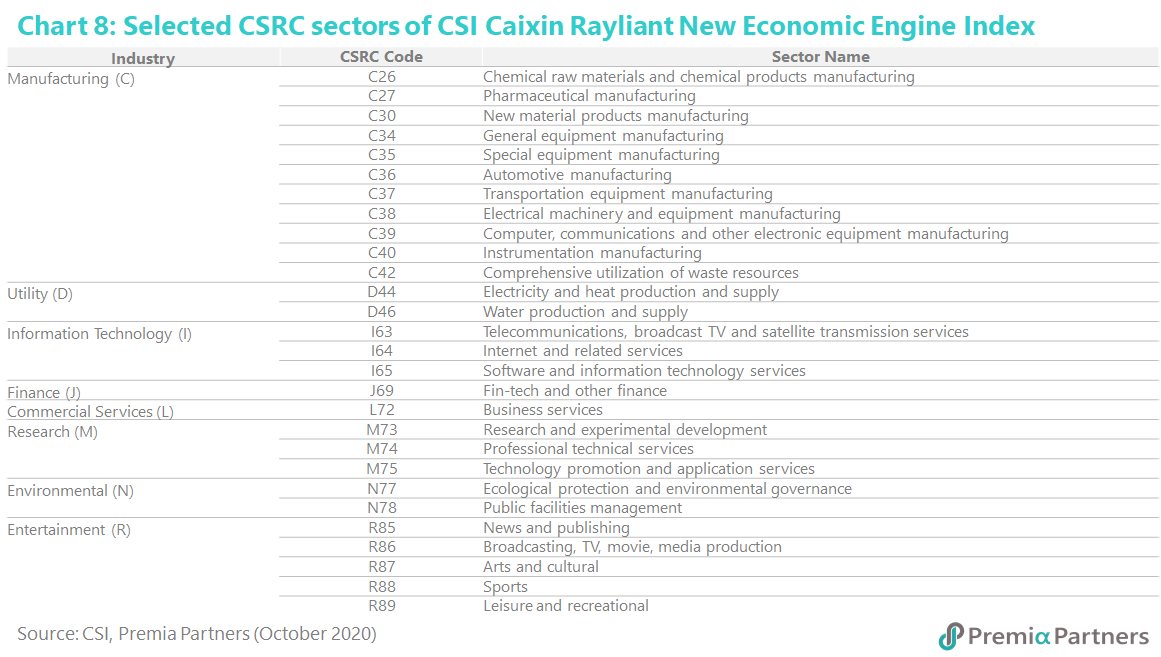
CSI Caixin Rayliant New Economic Engine Index, the underlying index of 3173.HK, screens the stocks based on CSRC Industry Classification Standard. Stocks whose CSRC Secondary Industry Codes are among the following eligible list or other new economy industries are selected (Chart 8):
[3173.HK] How many stocks you normally held? (is that 300?)
In principle, yes, the index methodology would select 300 eligible companies. However, typically the bottom 20 stocks would have 0.00% weight in the final index at rebalancing despite their index eligibility, and therefore would not be included in the ETF basket when we make the rebalancing accordingly. In addition, while our strategy intends to achieve full replication, our ETF invests into China A shares via the Stock-Connect scheme.
From time to time there may be index constituents that are not eligible for the Stock Connect Scheme either due to low liquidity or market cap reasons, our ETF therefore would not hold the company in the basket to avoid liquidity drag, and would instead use the optimisation approach to ensure we maintain low tracking error notwithstanding not having 100% full replication. The liquidity score mentioned above in fact serves well in excluding companies that are not eligible for Stock Connect.
As of September 30th, we have 31 stocks / 9.4% weight that is in the index but not invested by the ETF. With effective optimized replication, 3173.HK’s 1-year tracking error is at only 0.9%, lower than its competitor 2823.HK/2822.HK/3188.HK’s 1.2%/1.7%/1.9% respectively.
[3173.HK] You have said your average market cap was 39B vs 129B of CSI300. Does it mean that your benchmark should be CSI500?
Not necessarily, or it depends. The CSI 300 / 500 terminology is purely market-cap based, but our China New Economy ETF is an all cap strategy intended to capture the quality growth opportunities from new economy industries in China. In fact, most of our institutional investors and clients consider our 3173 ETF as a replacement for strategies tracking the broad CSI 300 or A50 (the most traditional ways of capturing broad market China A) as there’s increasing shift and demand to capture the broad China new economy vs. the old economy (i.e. mostly Financials), or the recognition that the mega-caps can no longer represent the Chinese economy or its growth.
While the new economy strategy does not explicitly have large-cap criteria, we do believe the current average market cap of 39B would be more representative of China’s economic growth and provide a better proxy for the sectors and companies that grow at a fast pace as we see China transform into more of a consumption-led, technology-prioritized economy. On the other hand, we do have investors asking about the small-size exposure compared to the broad market CSI 300, and whether that is a factor creating factor premium to the strategy. While the liquidity screen at the end helps mitigate the small cap illiquidity, we run rigorous factor researches here at Premia Partners and small size has not been a key contributor to the strategy’s outperformance versus the peer strategies based on our findings.
In fact, the factors driving most outperformance of the New Economy strategy vs. the CSI 300 or the broad new economy universe is in fact the Quality factors in place. Especially in recovery times like post-COVID, that’s also why we emphasize much on Quality Growth to investors looking for growth opportunities.
[3173.HK] ChiNext tracker (3147.HK) and some China sector ETFs (launched by Global X) have been doing well this year. How would 3173 look like if comparing with them?
ChiNext tracker is investing in a basket of stocks listed in ChiNext board whilst some China sector ETFs may provide narrowed exposure in a single industry. They are all using a market-cap weighted approach, subject to higher volatility, lower quality, and inflated valuation multiples potentially. 3173 is adopting a multi-factor approach for stock selection and weighting, resulting in a well-diversified exposure in the new economy segments riding on the key megatrends such as urbanization, consumption upgrade, technological advancement, aging population and life & health science. Instead of focusing on a single industry, 3173 holdings sit across information technology, healthcare, consumer discretionary, industrials, and materials. This is particularly a useful instrument for investors who like to capture different growth elements in China market. Besides, the portfolio construction goes through a robust screening process, avoiding the excessive overvalued stocks without supporting fundamentals. That differentiates 3173 to be a more sophisticated and low-cost investment tool when comparing with other simple beta/thematic index trackers.
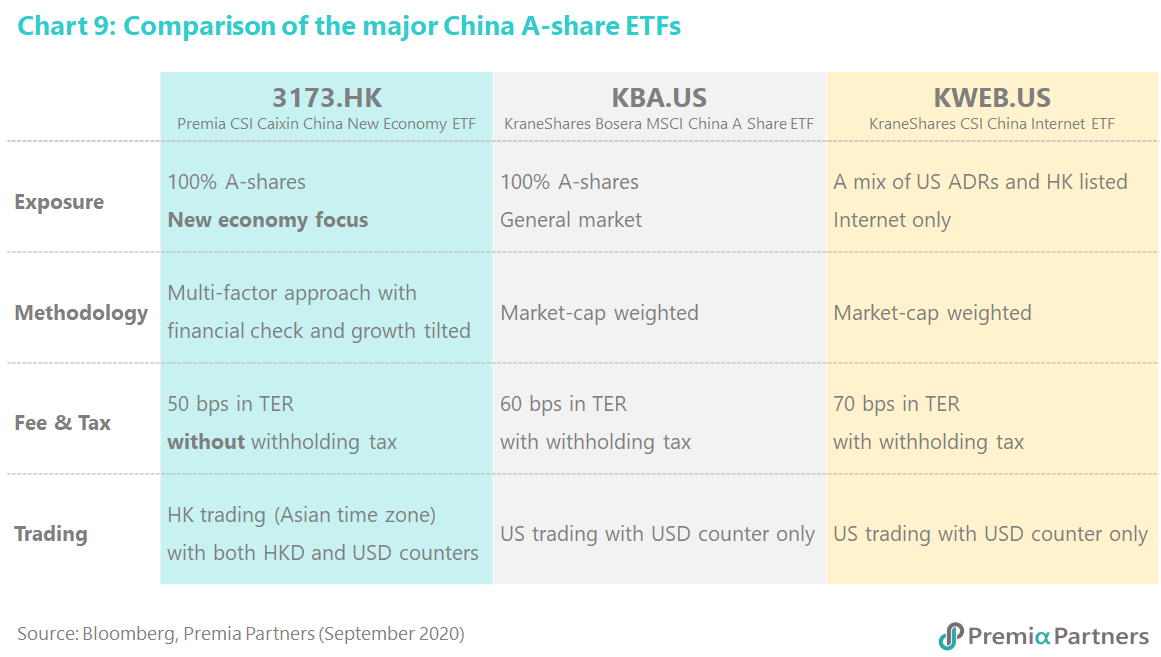
[3173.HK] For investors interested in China new economy, what do you think are the major differences between 3173 and KBA/ KWEB which investors in EMEA may be more familiar with?
The key differences are shown in the following Chart 9:
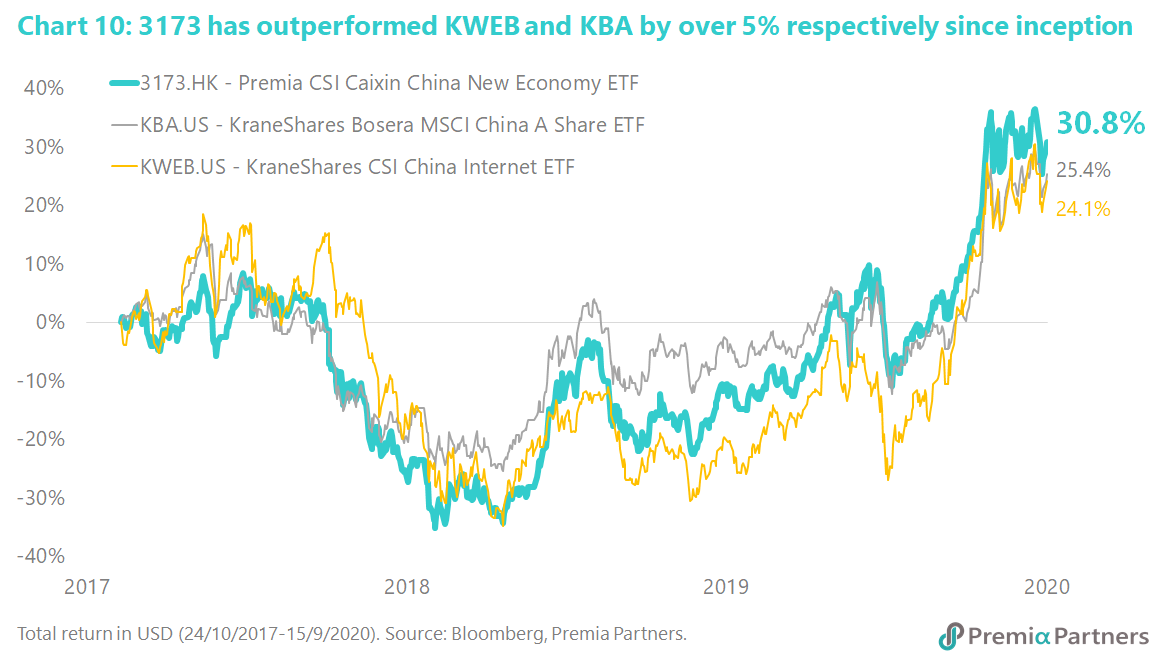
Ever since launch, 3173 HK has outperformed KWEB and KBA by over 5% respectively (Chart 10).
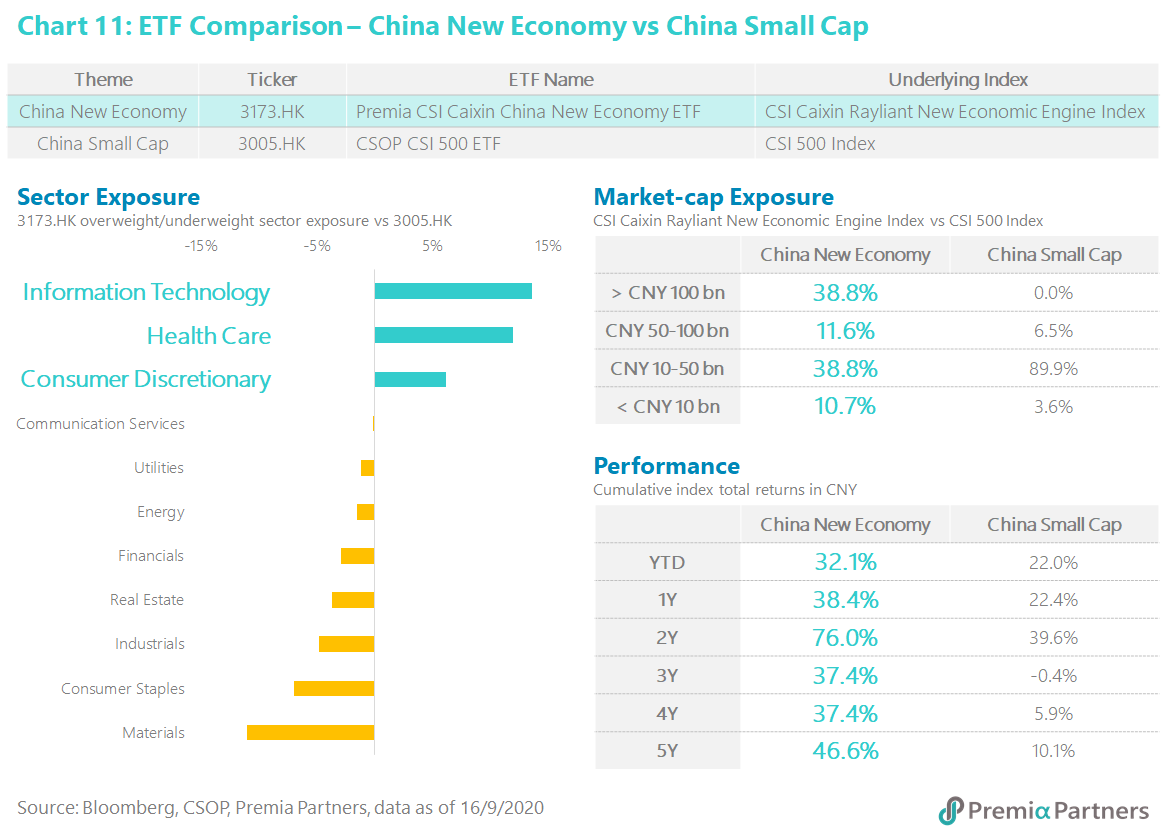
[3173.HK] Can you compare CSI 500 tracker to 3173?
The major differences are in the following aspects:
o Sector exposure: 3173.HK over-weights the New Economy-related sectors and under-weights the more traditional sectors;
o Market-cap exposure: CSI Caixin Rayliant New Economic Engine Index has a greater exposure in larger cap as some leading growth companies have grown into large cap, such as Hengrui Medicine, Gree Electrics and CATL. At the same time, the Index tried to capture the potential growth of those new economy stocks which are still small cap as New Economy has more weightings in companies below 10 billion CNY.
o Performance: CSI Caixin Rayliant New Economic Engine Index has outperformed CSI 500 in different time horizons, such as YTD, 1Y, 2Y, 3Y, 4Y and 5Y.
If I am employing some quant strategies, how can I make use of Premia ETFs?
Investors may treat our ETFs as another stock, fitting into their quant strategies to see if any alpha can be generated. Also, investors can try different combinations of their existing strategies and our ETFs (e.g. 60% strategies, 40% ETF) and see if the mix can improve their risk-adjusted returns.
Is there stamp duty or any tax to trade your ETFs?
ETFs traded in Hong Kong Stock Exchange are not subject to Stamp duty (Please refer to the Announcement on HKEx website).
On the ETF level, investors are not subject to withholding tax on interests, dividend and capital gains. On the underlying level of the ETF, the fund might have to pay tax on interests, dividends and capital gains under the local market’s tax system, but that will be taken care of by the trustee. Details please refer to Hong Kong ETF Taxation Report for Investors 2019 by HKEx.
Who are your PDs and market makers?
Our PDs include some international brokers, such as Goldman Sachs, Citigroup, and Merrill Lynch. The full list can be found at the corresponding product page in our website.
Are your ETFs UCITS or UCITS equivalent?
Whilst our funds cannot by legal definition be classified as UCITS, we have structured them to be compliant with the UCITS directive where possible and restrict investments only to assets that are eligible under the UCITS regime. Investment limits and hard restrictions have also been incorporated to take into account both UCITS and Hong Kong Code on Unit Trusts and Mutual Funds. Where they differ, our funds adopt the more restrictive restriction to satisfy both regimes.
Do you have USD trading counters or USD share class for your ETF?
Yes, all our ETFs have USD trading counters for exchange trading in addition to HKD counter, but not all of them have USD as base currency for primary creation/redemption. Premia CSI Caixin China Bedrock Economy ETF (2803.HK) and Premia CSI Caixin China New Economy ETF (3173.HK) are using RMB as base currency while the others are using USD.