premia-parnters logo
End of Negative Yielding Bonds – What Lies Beyond
2023/1/17
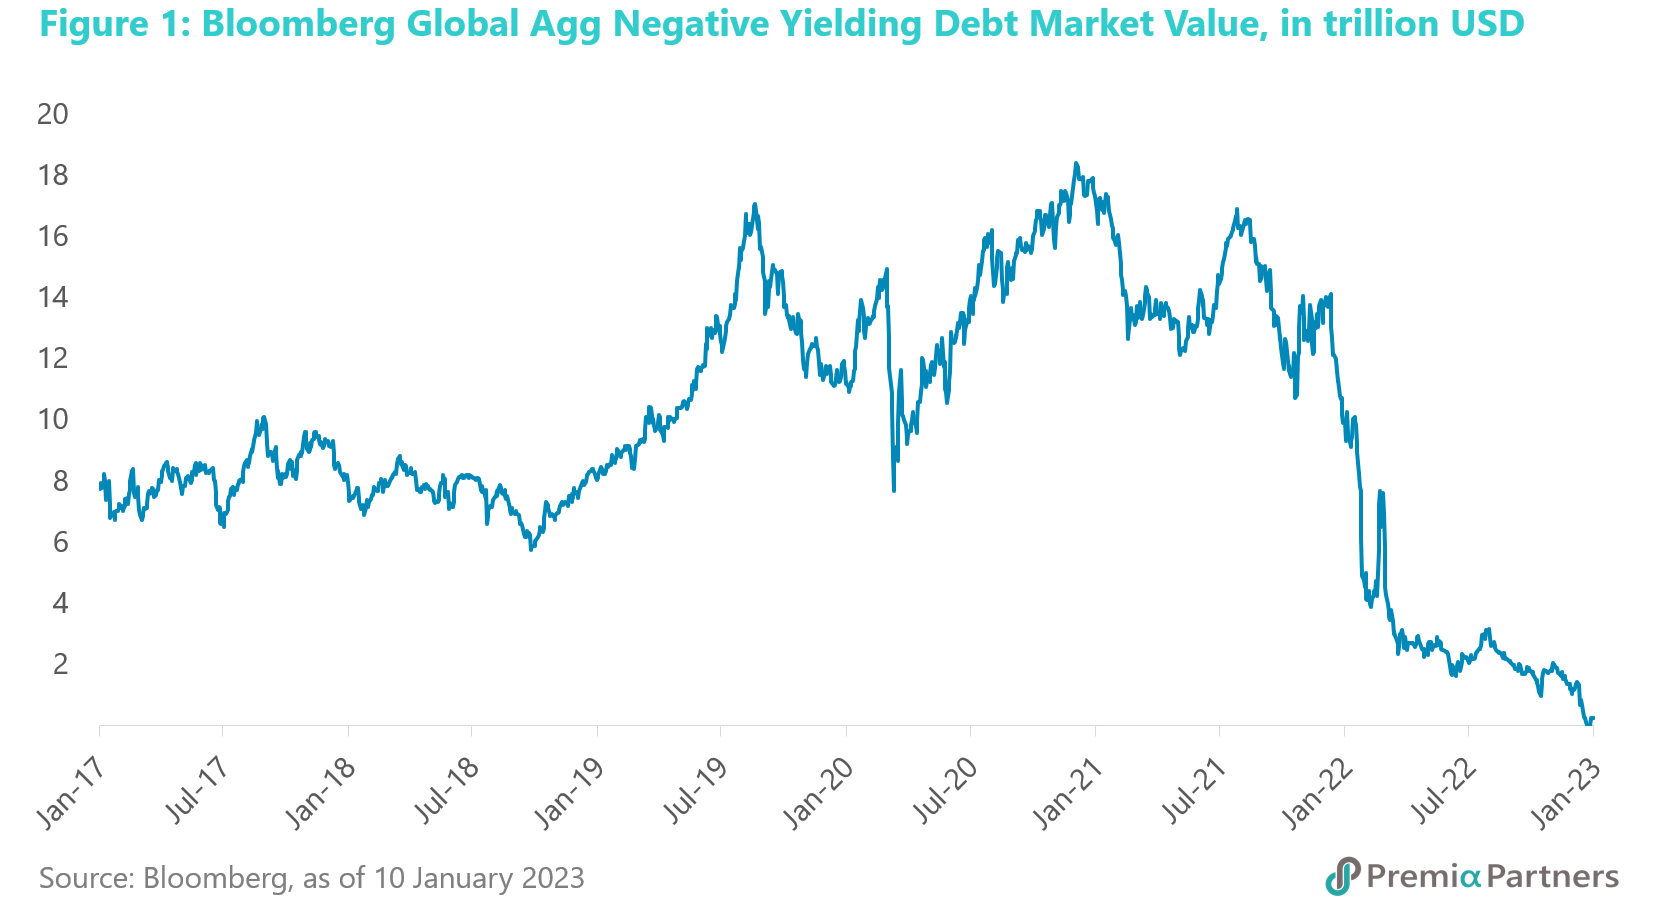
Big, long-term trends could drive Developed Market bond yields much higher than the cyclical peaks that the market is currently pricing in. There are cycles and there are secular trends. If the super cycle of rates and yields has turned – off deep negative inflation-adjusted levels – then the lesser cycles could mean- revert a lot higher around long-term uptrends. And we are at this juncture at the moment, as the negative yielding bonds have literally disappeared - the global stock of negative yielding bonds had gone from a peak of US$18.4 trillion late in 2020 to zero recently. What are the true implications behind this abrupt turn of tides? In this article, our Senior Advisor Say Boon Lim discusses the big drivers for potentially much higher rates and yields for this year, and areas we are spending a lot more time monitoring, as the longer-term outlook could be far worse than just a mean reversion in nominal rates and yields as we may also be in the midst of a secular mean reversion in real government bond yields and corporate credit yields.

Negative yielding bonds have literally disappeared. The global stock of negative yielding bonds had gone from a peak of US$18.4 trillion late in 2020 to zero recently. It has since bounced back a little bit, but the stock of negative yielding bonds is negligible.
The longer-term outlook could be far worse than just a mean reversion in nominal rates and yields. We may also be in the midst of a secular mean reversion in real government bond yields and corporate credit yields – at a time when inflation is at around four-decade highs. Real yields had fallen so deeply negative that it is hard to see where nominal yields can go but up.

The market may be underestimating the rates/yields risk over two different time frames. 1) Over the next 12 months: The dominant view on the Fed funds futures market is that the Fed funds target rate range will peak at 4.75%-5.00% this year, and then ease late in the year to 4.50%-4.75%. This is more dovish than what the Fed is signalling. FOMC members’ median view is 5.10%, which suggests a target range of 5.00%-5.25%. 2) Beyond 2023: The preceding addresses the cyclical risk. But there is a more serious, secular risk. The market assumption of rate cuts starting late this year is driven in large part by the median view of FOMC members’ projections which suggests 4.10% by end of 2024.

Underlying the FOMC’s rates projections is an assumption that the US economy returns to business cycles as usual after this. The FOMC is predicting 2% long-term PCE inflation and hence a long-term Fed rate of 2.5%. There are reasons to suspect the Fed’s assumption could be wrong.  

The US rates cycle has a secular dimension. By the end of 2021, it looked as if US rates were a bubble that would never pop. But what if 2022 was not just a cyclical upturn in US rates but the beginning of a long-term uptrend? By March of 2022, the inflation-adjusted Fed rate (Fed Funds Effective Rate minus the US CPI y/y inflation rate) hit its lowest since the 1950s, and it has been rising since.
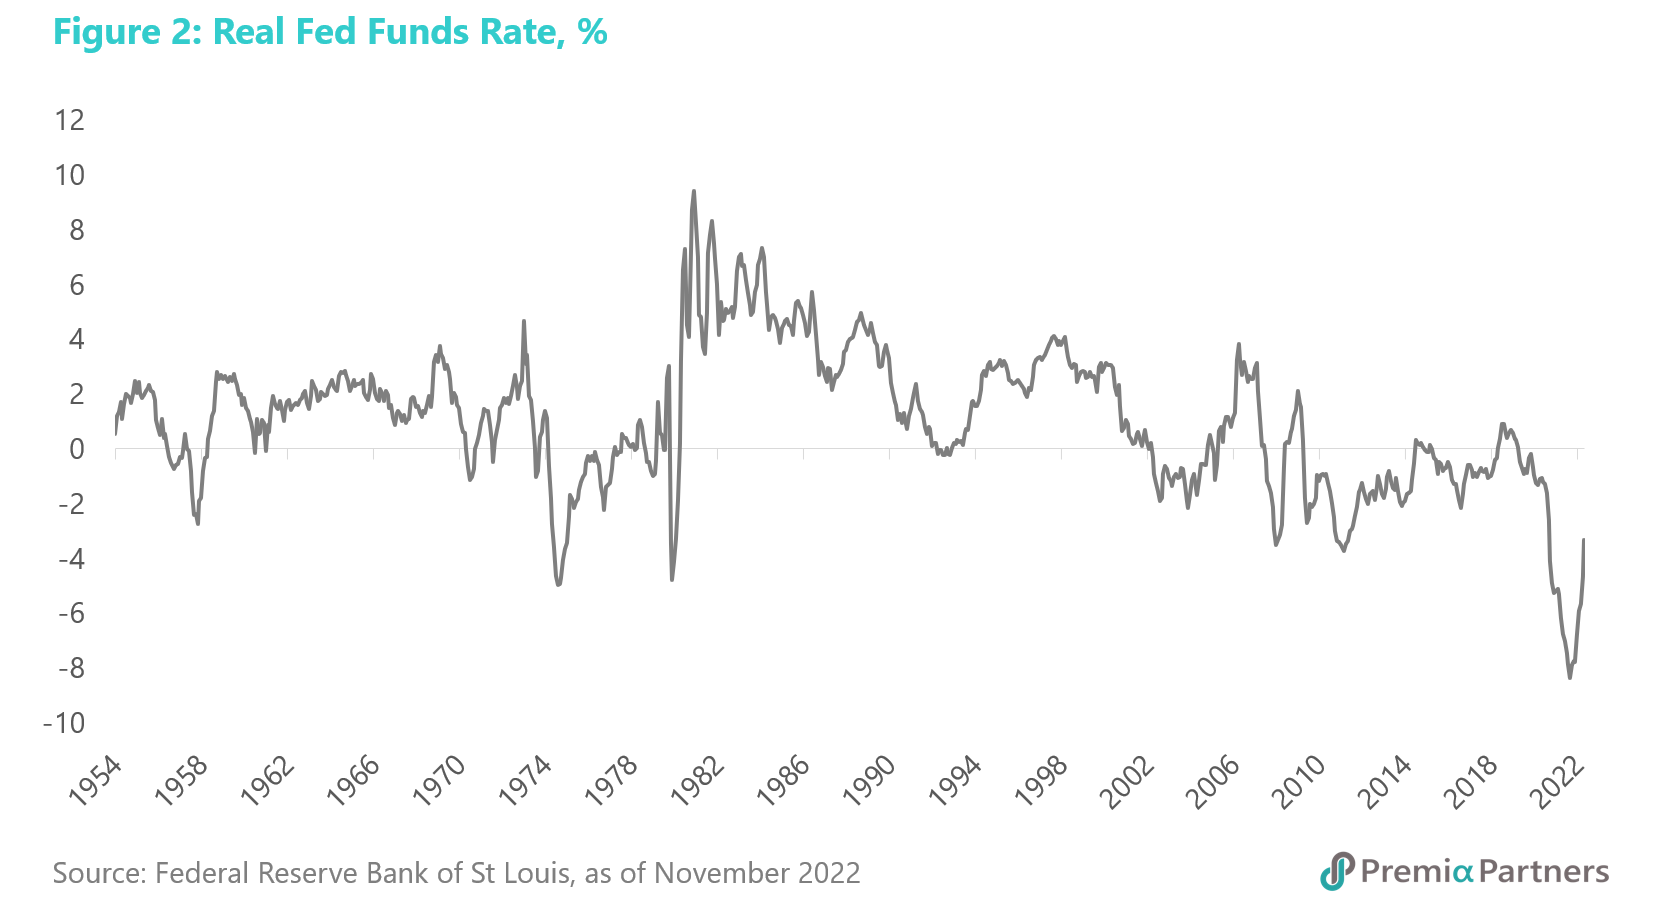
If there is secular mean reversion at work, US rates could rise more, over a longer period, than what the market is currently expecting.

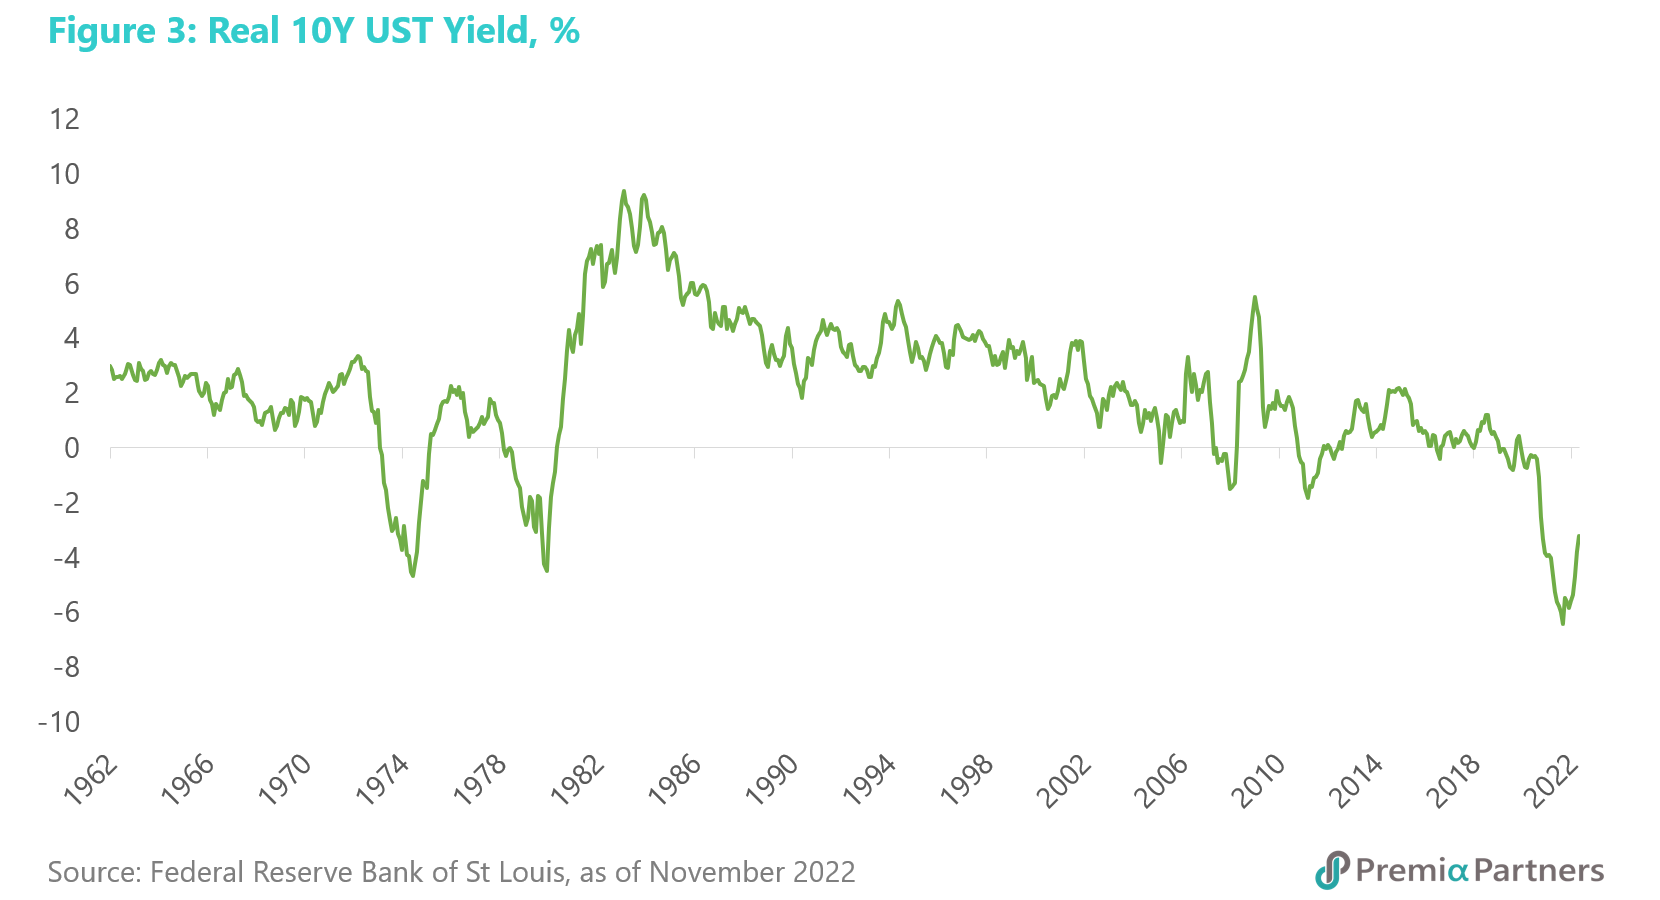
US Treasuries were another bubble that seemed like it would never pop either – what if it has just popped? The pandemic saw zero yields for the 10-year US Treasury between mid-2020 and early-2022. That’s another super cycle low. It seemed as if the world would forever fund the US economy’s overspending. But if US rates are on a secular mean reversion, US government debt yields should run up in tandem. That’s just nominal yields. In inflation-adjusted terms, the outlook could be even worse. The real yield for the 10-year UST is currently around negative 3.4%. Note that in March of 2022, the real yield was negative 6.4%, and it now appears to be mean reverting as well.
The US triggered the reversal in rates but Japan could worsen it. The forces that could drive a secular uptrend in Developed Market rates are not just limited to the US. The Bank of Japan is now struggling to hold down the 10-year JGB yield amidst rising inflation and a much-weakened Yen. Japan’s debt to GDP has plateaued over recent years. Of course, it could pick up again after a hiatus. But that is likely to require higher government bond yields, particularly if US rates and yields march upwards.

From globalisation to geopolitical strategic competition. The election of Donald Trump – more specifically, the emergence of protectionism and nationalism that found expression in Trumpism – marked a plateauing in the rapid rise of globalisation from around 1991 to 2018, This is neatly captured by the KOF Swiss Economic Institute’s Globalisation Index.
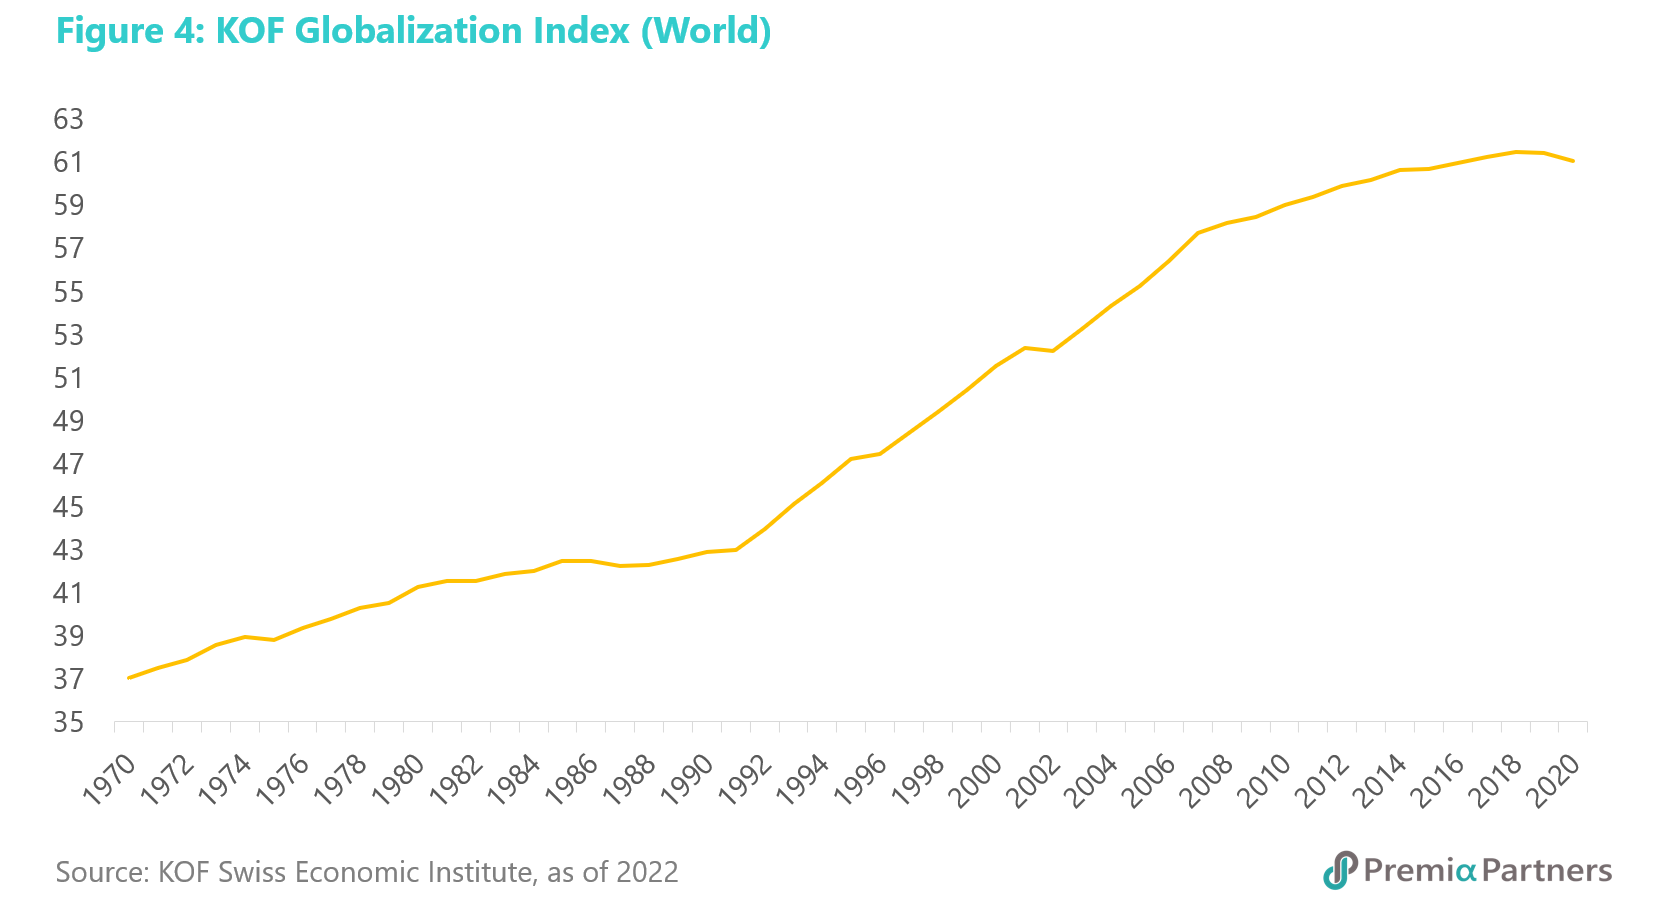
The plateauing observed in the KOF GI – for which the latest year was 2020 – would almost certainly have continued since then, given the impact of the pandemic and the escalation of global geopolitical antagonisms. Indeed, it would be interesting to see if surveys for 2021 and 2022 see reversals, rather than just a plateauing of globalisation. This has obvious implications for costs and inflation. Globalisation was a force for disinflation, indeed at certain points, deflation. The reverse could mean a new era of inflation.

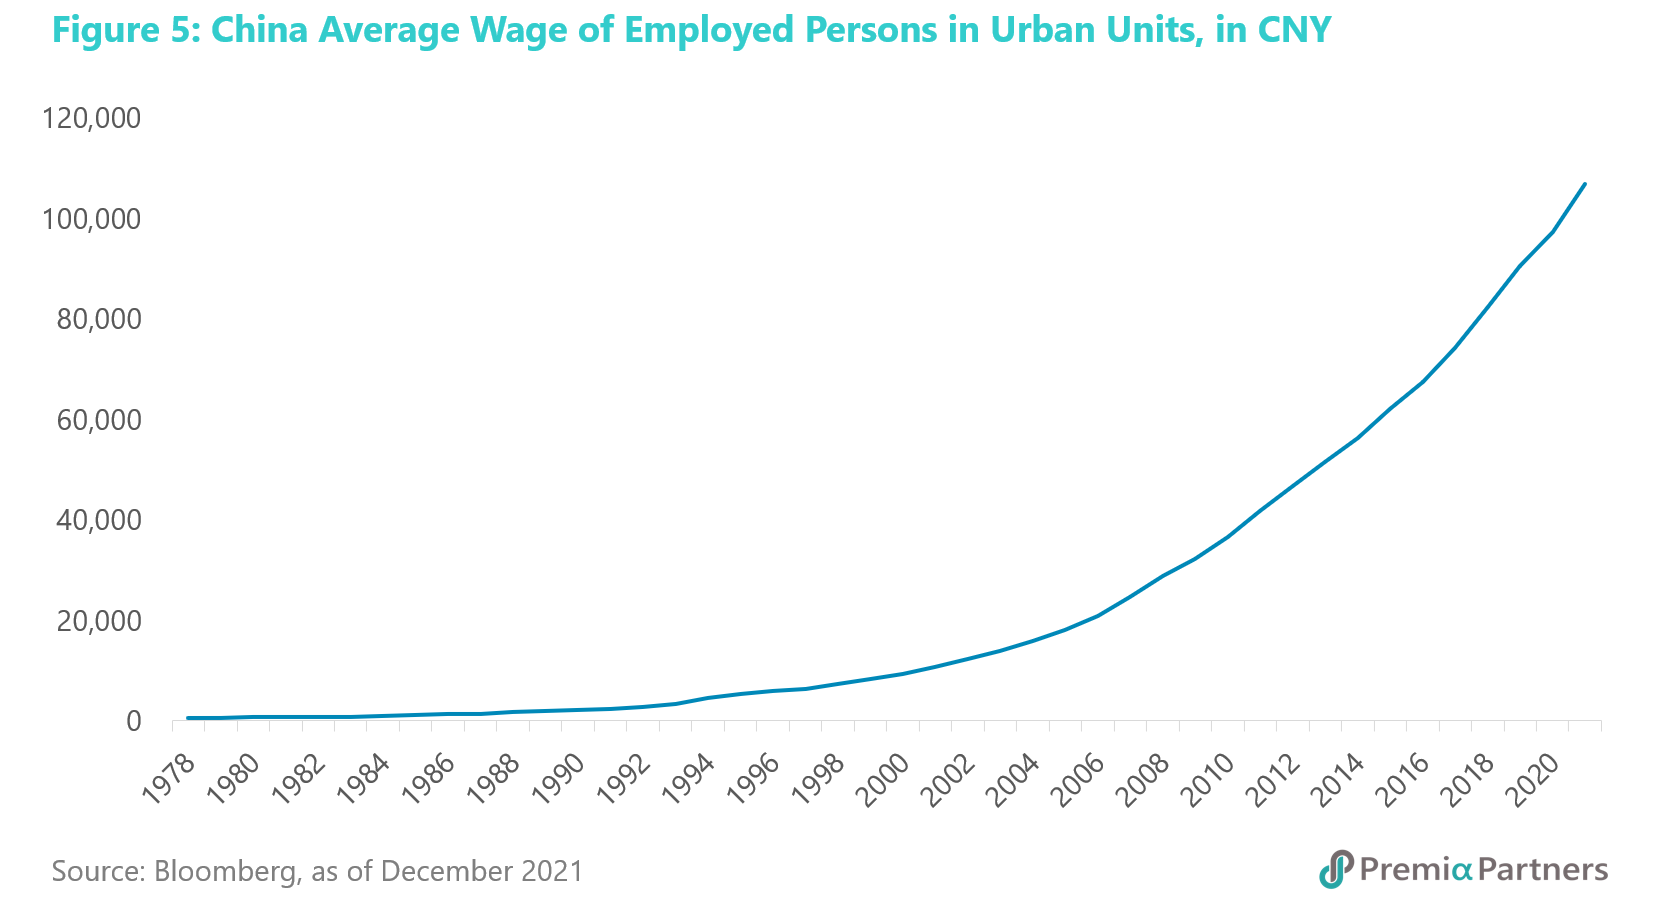
The era of China as a source of cheap manufactured goods is over. China had contributed greatly to disinflation and deflation over the past four decades by being the “factory of the world”. But demographics are changing, indeed gradually ageing. Wages are rising to boost domestic consumption, and China is in the midst of a massive drive to lift the value-add – and prices – of its products.
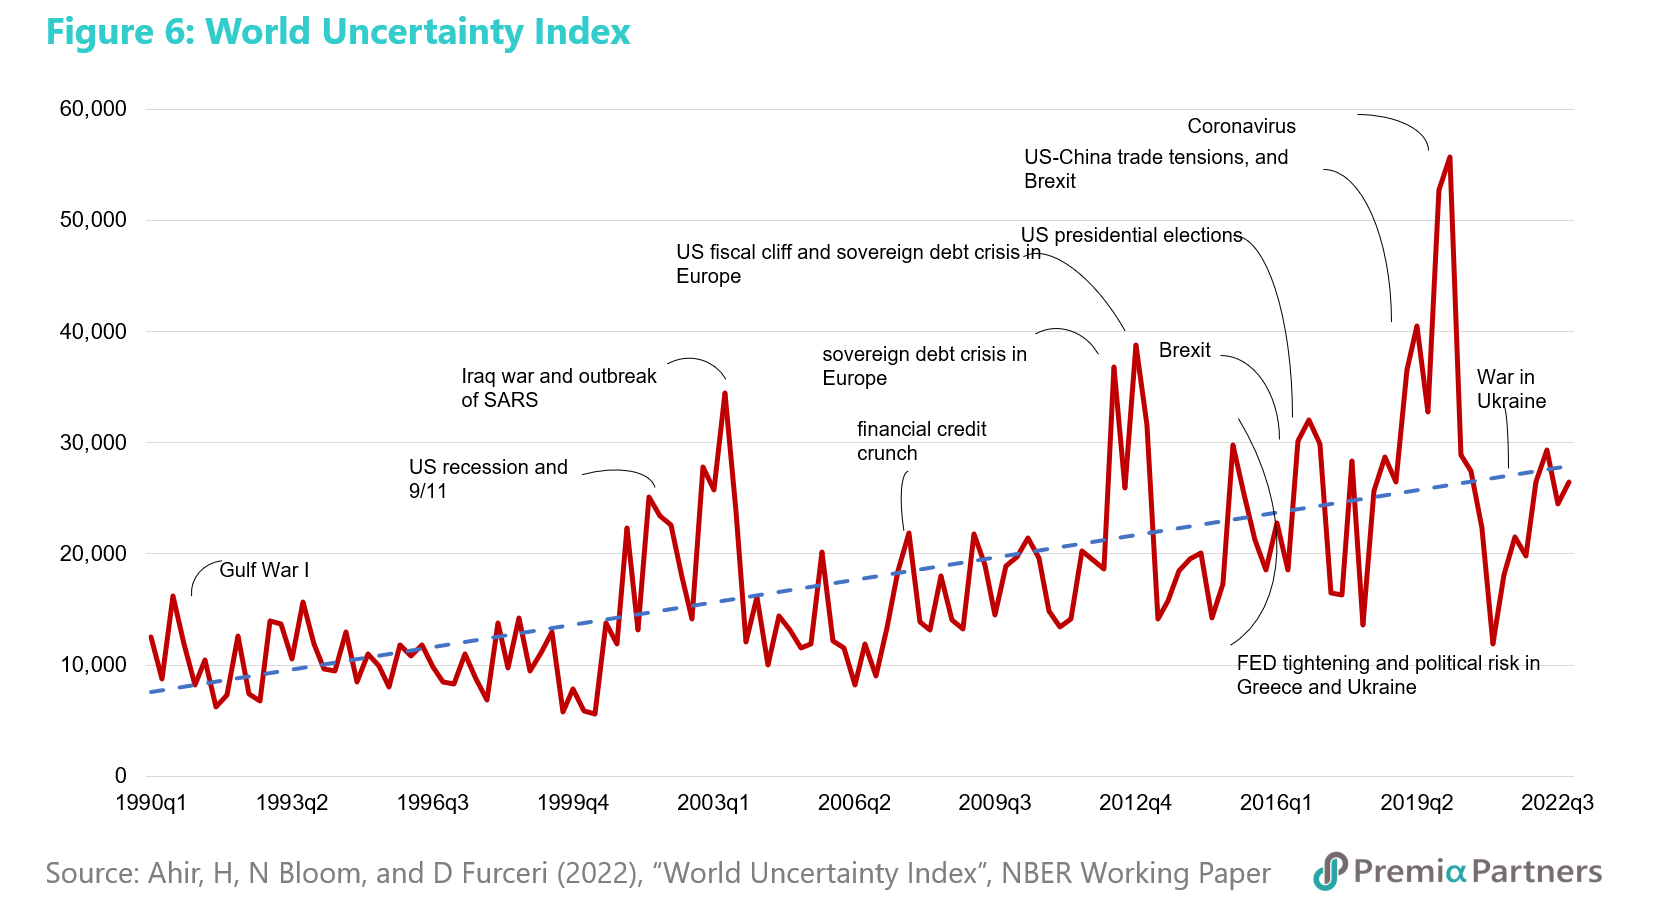
Governments are spending a lot more on the military. The plateauing of globalisation around 2018 also coincided with the prior low in geopolitical tensions. This is something widely acknowledged. But the Blackrock Investment Institute’s Geopolitical Risk Indicator captures this more precisely, with a rise in the index off a low of minus 0.57 in February 2018 to a high of positive 2.18 in October last year. (Lower values indicate low risk and vice-versa.) Overlaid against that, there is also a long-term uptrend in global “uncertainty”, captured in the World Uncertainty Index, which is compiled from data mining the Economist Intelligence Unit’s country reports.
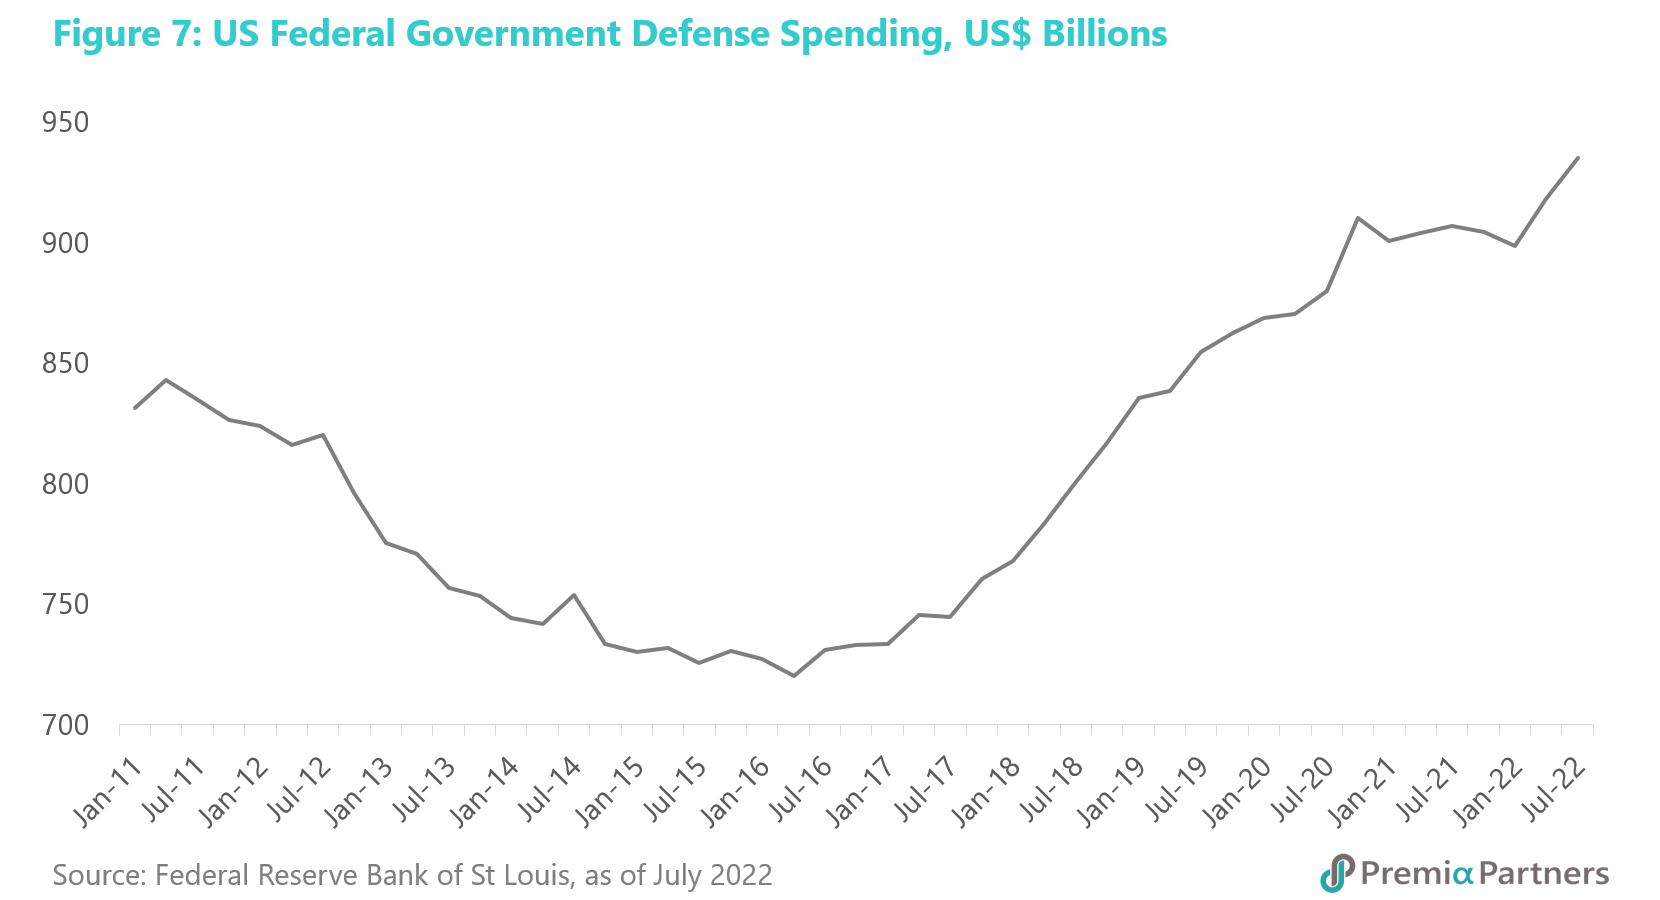
Not coincidentally, after a 5-year decline from 2011-2016 (during President Obama’s term), US defense spending has been rising again. US annual defense expenditure by late last year was around 30% higher than what it was at its cyclical low in 2016.
Meanwhile, Japan has just announced a 20% increase in its defense budget for 2023 – quite a jump in just one year. Defense spending in the European Union, which started rising in 2021, looks set to go even higher as a result of the war in Ukraine.

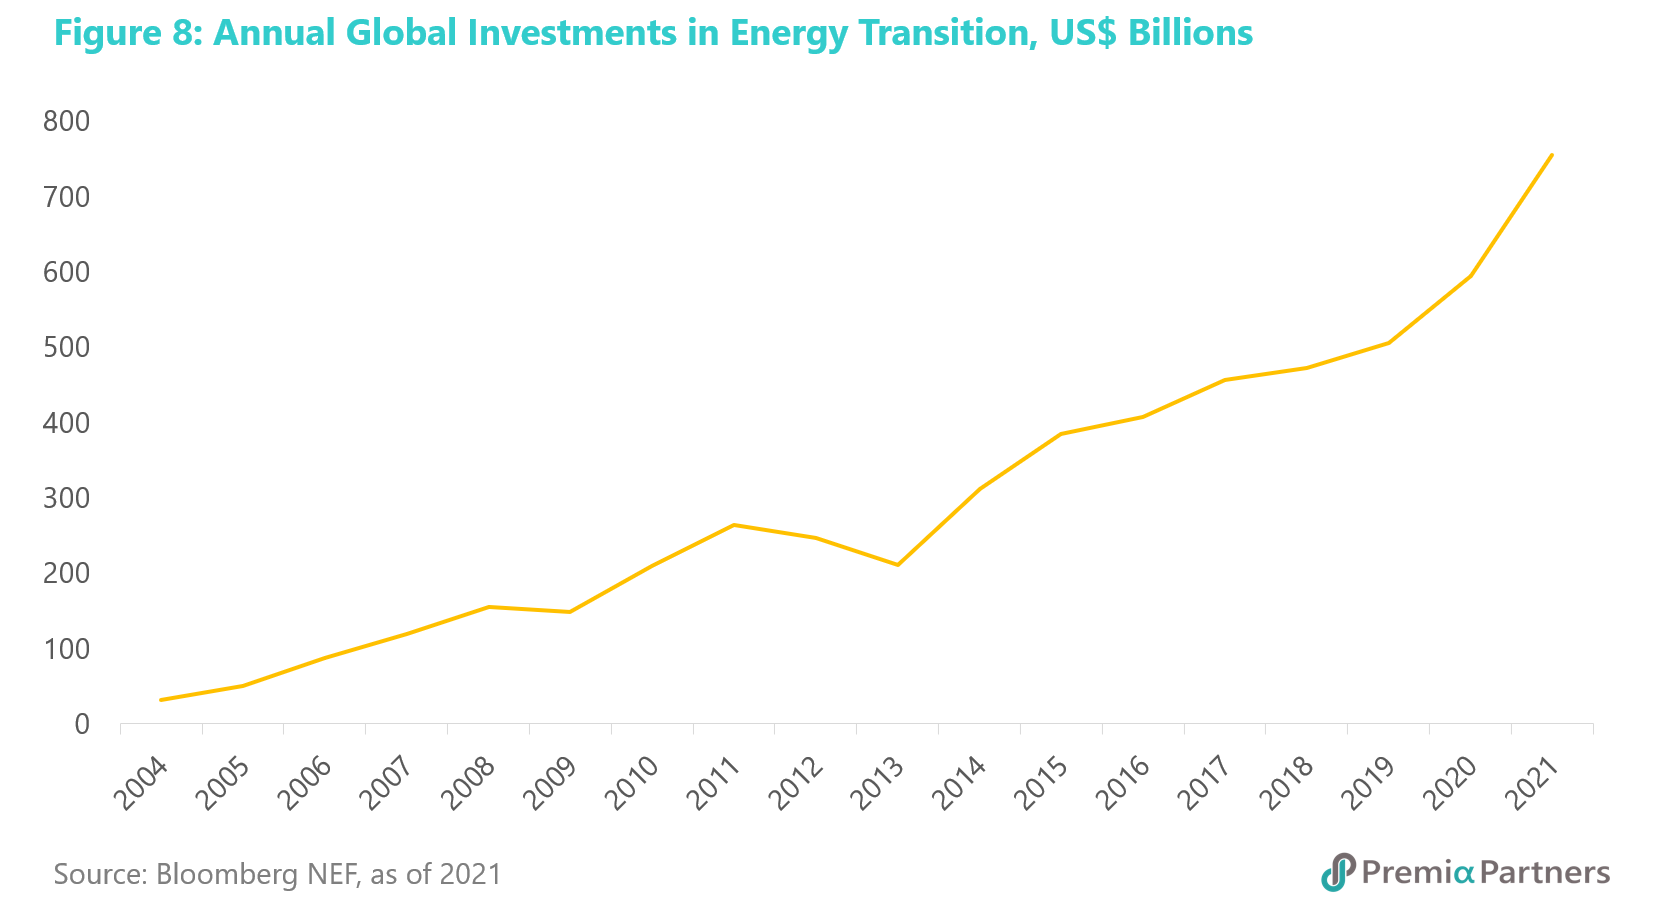
Climate change: The global surge in investments for energy transition, and the rising cost of climate catastrophes. The growth in investments towards energy transition is accelerating.  According to data from Bloomberg New Energy Finance (Bloomberg NEF), there was a 27% rise in global investments in energy transition in 2021 over 2020. This is a parabolic rise from 7% in 2019 and 18% in 2020.
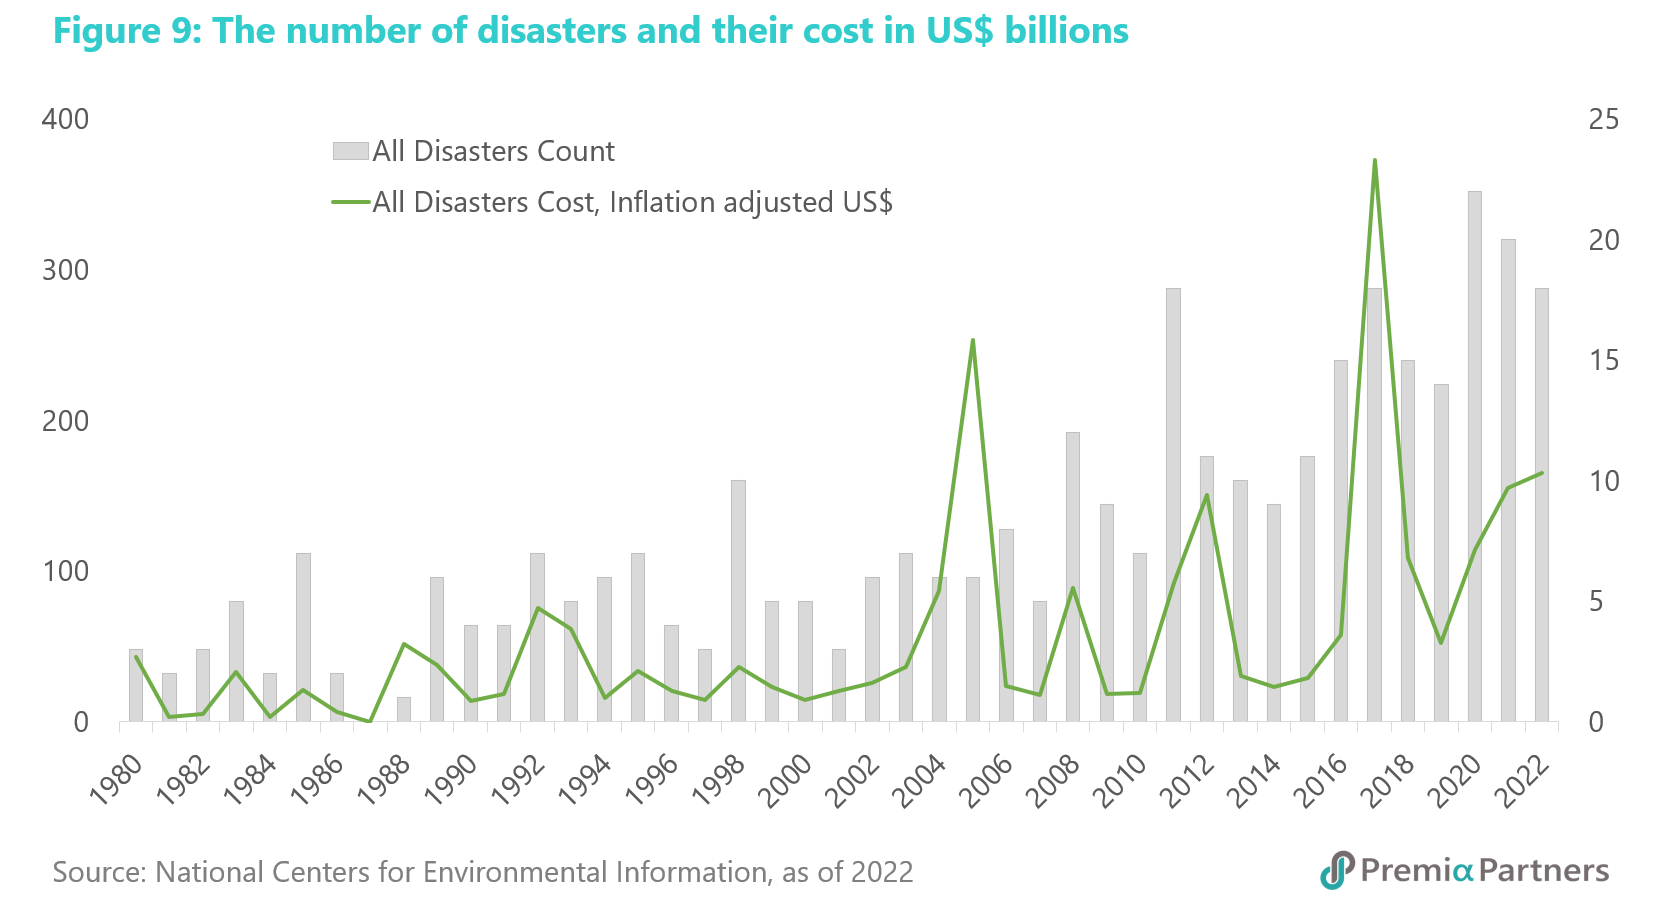
Related to this is the likely growing cost of climate catastrophes, already reflected in the sharp rises in the returns demanded of catastrophe bonds over the course of 2022. The uptrend in major weather-related disasters – both count and costs – is likely to get worse.
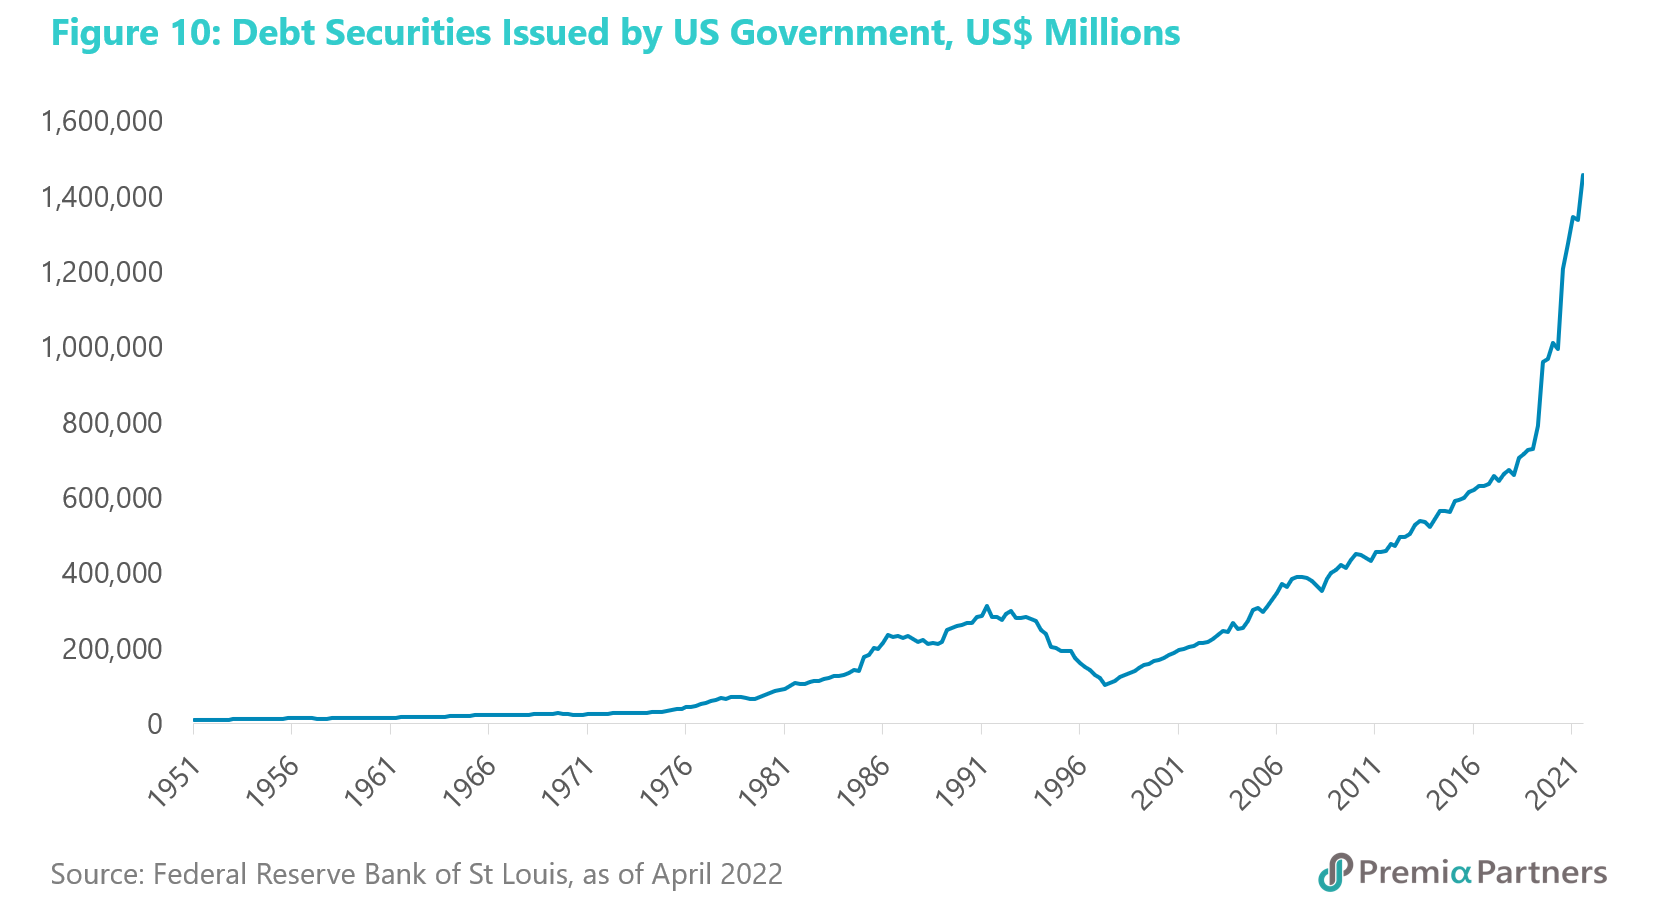
Watch the declining appetite for US Treasuries. There has been a surge since 1998 in the amount of US government debt paper being pumped out year after year. But that rise went vertical from the start of 2020. The value of gross US government debt now stands at around US$31 trillion. That’s 135% of the nominal GDP last year.
But the two biggest holders of US Treasuries, Japan and China, have been selling over the past year. US commercial banks have also been selling. And yes, the Fed is also selling as it withdraws money supply from the system to try to tame inflation. The very strong likelihood of another nasty debt ceiling battle later this year – which means politicking to the brink of debt default – is another reason to be wary of US government debt and mindful of the risk of further rises in yields.

US term premiums may have put in a long-term bottom – the risk is now of a secular uptrend. We may have seen in 2020 a long-term bottom for US Treasury term premiums – that is, the compensation for taking the duration risk in US government bonds. This could have huge implications beyond US Treasuries given that Developed Market term premiums tend to be correlated. Owing to the economic uncertainties caused by huge government debts, big calls on capital in coming years, and the possibility of structurally higher inflation, there are good reasons to be wary this could be the early stage of a secular uptrend in term premiums.  

  • 林哲文
    林哲文

    資深指導顧問

以下翻譯結果由阿里雲機器翻譯引擎生成,僅供參考。 睿亞資產對內容的準確性或適當性不承擔任何責任,如與英文原文含義不同,以原文為準。

Big, long-term trends could drive Developed Market bond yields much higher than the cyclical peaks that the market is currently pricing in. There are cycles and there are secular trends. If the super cycle of rates and yields has turned – off deep negative inflation-adjusted levels – then the lesser cycles could mean- revert a lot higher around long-term uptrends. And we are at this juncture at the moment, as the negative yielding bonds have literally disappeared - the global stock of negative yielding bonds had gone from a peak of US$18.4 trillion late in 2020 to zero recently. What are the true implications behind this abrupt turn of tides? In this article, our Senior Advisor Say Boon Lim discusses the big drivers for potentially much higher rates and yields for this year, and areas we are spending a lot more time monitoring, as the longer-term outlook could be far worse than just a mean reversion in nominal rates and yields as we may also be in the midst of a secular mean reversion in real government bond yields and corporate credit yields.

Negative yielding bonds have literally disappeared. The global stock of negative yielding bonds had gone from a peak of US$18.4 trillion late in 2020 to zero recently. It has since bounced back a little bit, but the stock of negative yielding bonds is negligible.

The longer-term outlook could be far worse than just a mean reversion in nominal rates and yields. We may also be in the midst of a secular mean reversion in real government bond yields and corporate credit yields – at a time when inflation is at around four-decade highs. Real yields had fallen so deeply negative that it is hard to see where nominal yields can go but up.

The market may be underestimating the rates/yields risk over two different time frames. 1) Over the next 12 months: The dominant view on the Fed funds futures market is that the Fed funds target rate range will peak at 4.75%-5.00% this year, and then ease late in the year to 4.50%-4.75%. This is more dovish than what the Fed is signalling. FOMC members’ median view is 5.10%, which suggests a target range of 5.00%-5.25%. 2) Beyond 2023: The preceding addresses the cyclical risk. But there is a more serious, secular risk. The market assumption of rate cuts starting late this year is driven in large part by the median view of FOMC members’ projections which suggests 4.10% by end of 2024.

Underlying the FOMC’s rates projections is an assumption that the US economy returns to business cycles as usual after this. The FOMC is predicting 2% long-term PCE inflation and hence a long-term Fed rate of 2.5%. There are reasons to suspect the Fed’s assumption could be wrong.  

The US rates cycle has a secular dimension. By the end of 2021, it looked as if US rates were a bubble that would never pop. But what if 2022 was not just a cyclical upturn in US rates but the beginning of a long-term uptrend? By March of 2022, the inflation-adjusted Fed rate (Fed Funds Effective Rate minus the US CPI y/y inflation rate) hit its lowest since the 1950s, and it has been rising since.

If there is secular mean reversion at work, US rates could rise more, over a longer period, than what the market is currently expecting.

US Treasuries were another bubble that seemed like it would never pop either – what if it has just popped? The pandemic saw zero yields for the 10-year US Treasury between mid-2020 and early-2022. That’s another super cycle low. It seemed as if the world would forever fund the US economy’s overspending. But if US rates are on a secular mean reversion, US government debt yields should run up in tandem. That’s just nominal yields. In inflation-adjusted terms, the outlook could be even worse. The real yield for the 10-year UST is currently around negative 3.4%. Note that in March of 2022, the real yield was negative 6.4%, and it now appears to be mean reverting as well.

The US triggered the reversal in rates but Japan could worsen it. The forces that could drive a secular uptrend in Developed Market rates are not just limited to the US. The Bank of Japan is now struggling to hold down the 10-year JGB yield amidst rising inflation and a much-weakened Yen. Japan’s debt to GDP has plateaued over recent years. Of course, it could pick up again after a hiatus. But that is likely to require higher government bond yields, particularly if US rates and yields march upwards.

From globalisation to geopolitical strategic competition. The election of Donald Trump – more specifically, the emergence of protectionism and nationalism that found expression in Trumpism – marked a plateauing in the rapid rise of globalisation from around 1991 to 2018, This is neatly captured by the KOF Swiss Economic Institute’s Globalisation Index.

The plateauing observed in the KOF GI – for which the latest year was 2020 – would almost certainly have continued since then, given the impact of the pandemic and the escalation of global geopolitical antagonisms. Indeed, it would be interesting to see if surveys for 2021 and 2022 see reversals, rather than just a plateauing of globalisation. This has obvious implications for costs and inflation. Globalisation was a force for disinflation, indeed at certain points, deflation. The reverse could mean a new era of inflation.

The era of China as a source of cheap manufactured goods is over. China had contributed greatly to disinflation and deflation over the past four decades by being the “factory of the world”. But demographics are changing, indeed gradually ageing. Wages are rising to boost domestic consumption, and China is in the midst of a massive drive to lift the value-add – and prices – of its products.

Governments are spending a lot more on the military. The plateauing of globalisation around 2018 also coincided with the prior low in geopolitical tensions. This is something widely acknowledged. But the Blackrock Investment Institute’s Geopolitical Risk Indicator captures this more precisely, with a rise in the index off a low of minus 0.57 in February 2018 to a high of positive 2.18 in October last year. (Lower values indicate low risk and vice-versa.) Overlaid against that, there is also a long-term uptrend in global “uncertainty”, captured in the World Uncertainty Index, which is compiled from data mining the Economist Intelligence Unit’s country reports.

Not coincidentally, after a 5-year decline from 2011-2016 (during President Obama’s term), US defense spending has been rising again. US annual defense expenditure by late last year was around 30% higher than what it was at its cyclical low in 2016.

Meanwhile, Japan has just announced a 20% increase in its defense budget for 2023 – quite a jump in just one year. Defense spending in the European Union, which started rising in 2021, looks set to go even higher as a result of the war in Ukraine.

Climate change: The global surge in investments for energy transition, and the rising cost of climate catastrophes. The growth in investments towards energy transition is accelerating.  According to data from Bloomberg New Energy Finance (Bloomberg NEF), there was a 27% rise in global investments in energy transition in 2021 over 2020. This is a parabolic rise from 7% in 2019 and 18% in 2020.

Related to this is the likely growing cost of climate catastrophes, already reflected in the sharp rises in the returns demanded of catastrophe bonds over the course of 2022. The uptrend in major weather-related disasters – both count and costs – is likely to get worse.

Watch the declining appetite for US Treasuries. There has been a surge since 1998 in the amount of US government debt paper being pumped out year after year. But that rise went vertical from the start of 2020. The value of gross US government debt now stands at around US$31 trillion. That’s 135% of the nominal GDP last year.

But the two biggest holders of US Treasuries, Japan and China, have been selling over the past year. US commercial banks have also been selling. And yes, the Fed is also selling as it withdraws money supply from the system to try to tame inflation. The very strong likelihood of another nasty debt ceiling battle later this year – which means politicking to the brink of debt default – is another reason to be wary of US government debt and mindful of the risk of further rises in yields.

US term premiums may have put in a long-term bottom – the risk is now of a secular uptrend. We may have seen in 2020 a long-term bottom for US Treasury term premiums – that is, the compensation for taking the duration risk in US government bonds. This could have huge implications beyond US Treasuries given that Developed Market term premiums tend to be correlated. Owing to the economic uncertainties caused by huge government debts, big calls on capital in coming years, and the possibility of structurally higher inflation, there are good reasons to be wary this could be the early stage of a secular uptrend in term premiums.