The recent regulatory crackdowns and power suspension in China have unnerved many international investors. How to configure for China opportunities under the lens of common prosperity and commitment for carbon neutrality by 2060 is what we and many investors reflect upon a lot these days.
As investors adjust exposure towards tailwind sectors under the 14th Five Year Plans, there is also increasing need for building blocks for the onshore A shares markets where a lot of leaders in hardcore technology and strategic new economy sectors sit. In this article, we would like to compare our Premia China STAR50 ETF (3151.HK) and Premia CSI Caixin China New Economy ETF (3173.HK) that may look similar at first glance as both of them invest in China A-shares related to new economy sectors. In fact, they are rather unique and could be complementary to each other as there is not much overlap between their holdings. By taking an in-depth analysis into the strategies and highlighting the differences, we hope that investors would have better ideas in deciding which ETF may align better with their investment objectives.
Top holdings and concentration
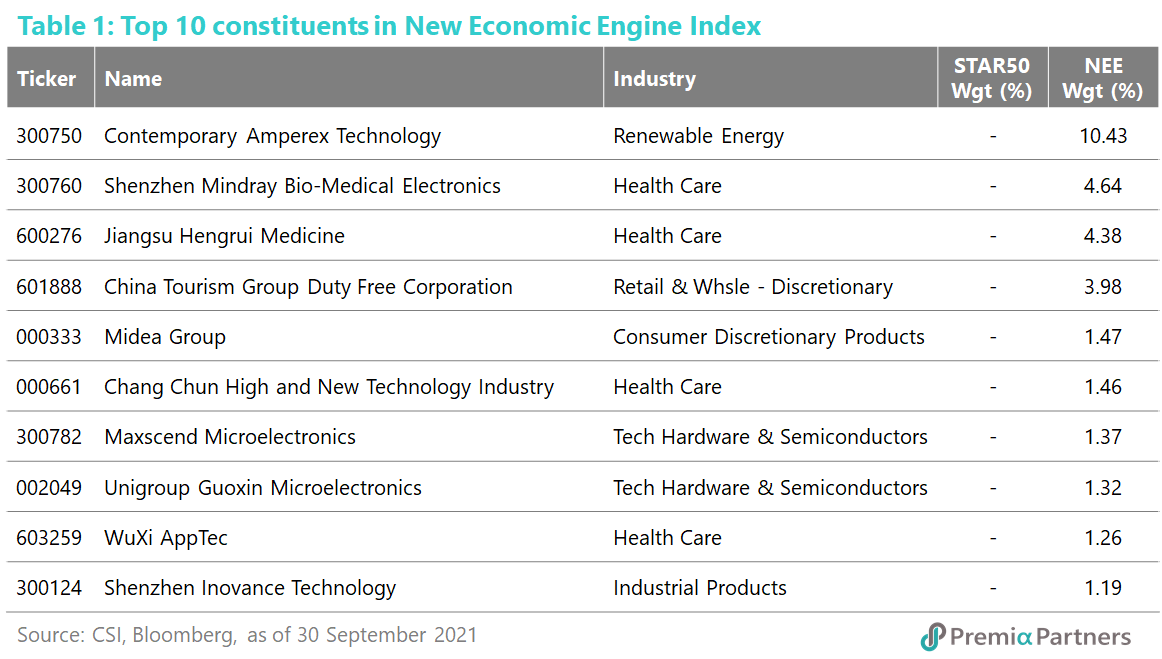
Before looking for differences, let’s get familiar with the two underlying indexes, SSE Science and Technology Innovation Board 50 Index (STAR50 index) and CSI Caixin Rayliant New Economic Engine Index (NEE index), by going through their top index constituents. Referring to the tables below, one may notice that there is no STAR company among the top 10 stocks of the NEE index. The NEE index is indeed an all-rounded benchmark covering stocks listed in the main boards in both Shanghai and Shenzhen, ChiNext board and STAR board. Currently there are 39 STAR companies in the NEE index with a total weight of 8.6%, just that none of them could make into the top 10 positions.
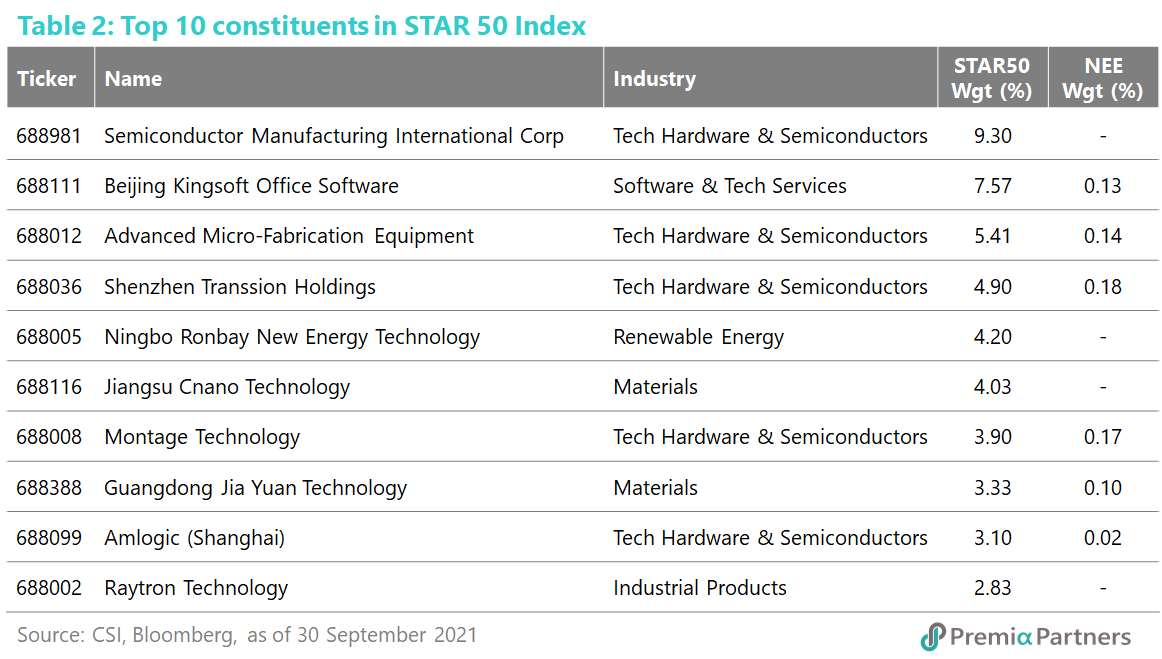
Among the top 10 stocks of the STAR50 index, it is noticeable that some of them are also the constituents of the NEE index. Interestingly, the weights these STAR companies carried in the NEE index are not necessarily in proportion to their market caps. For example, Beijing Kingsoft Office is the second largest holding in STAR50 index but its weight in the NEE index is smaller than the ones represented by the third and fourth largest holdings in STAR50 index. This is due to the different weighting methodology used by the indexes, in which we would explain it in detail later.
In terms of concentration, the NEE index is more diversified with the top 10 stocks accounting for 31.5% in weighting because there are total 300 constituents. In comparison, the STAR50 index is cohesive with only 50 constituents, in which the top 10 stocks accounted for 48.6%. Looking forward, the concentration of the STAR50 index may likely improve with more potential listings waiting in the pipeline.
Sector exposure
The tables also illustrate that the STAR50 and NEE indexes could be quite different in industry exposure: the STAR 50 index’s top 10 are mostly companies operating in Tech Hardware & Semiconductors and Materials while the NEE index’s top 10 are more mixed in business nature with companies in Renewable Energy, Health Care, Consumption, Tech Hardware & Semiconductors. The same holds true if expanding into the full holdings. This time, the difference is due to the stock selection methods adopted by the indexes, in which we will go through it soon.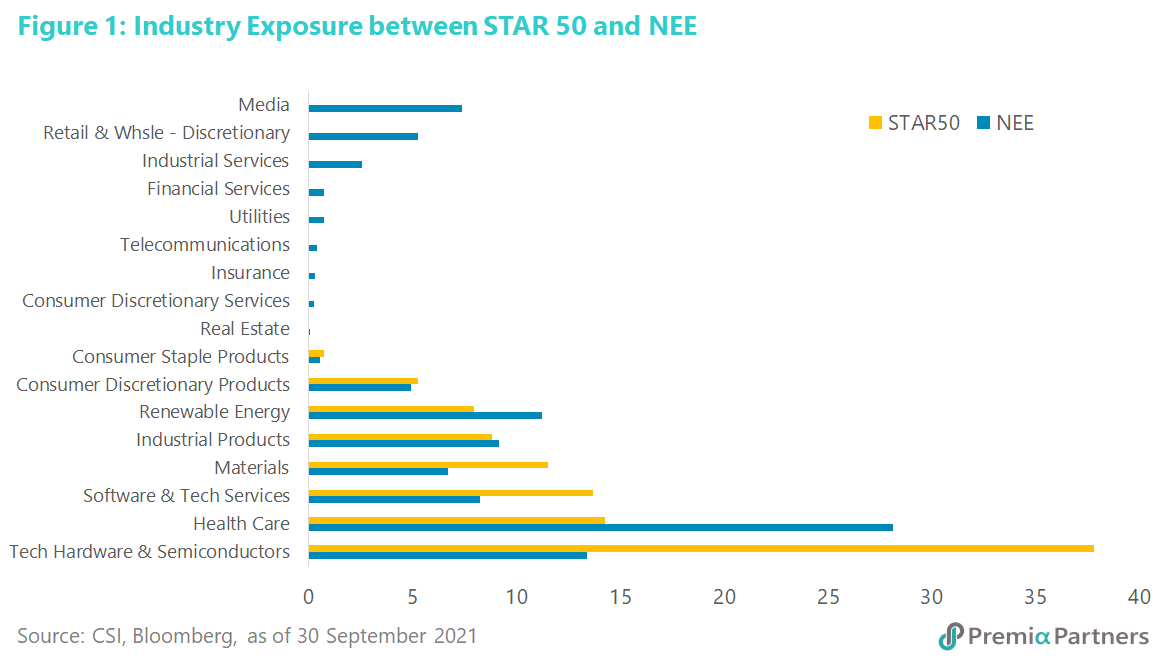
Weighting methodology
While the STAR50 index is calculated based on the free-float market cap only, the NEE index would look at growth factors and liquidity factors. Market cap is only one of the elements considered among the liquidity factors at the NEE index. The other major considerations among the growth factors include gross profitability, operating profitability, growth in total assets (reversal), growth in book equity (reversal) and R&D expense ratio. Taking Beijing Kingsoft Office as an example, its final weight in the index turns out to be lower as some of the other factors may not be as strong as other stocks with smaller market caps.
Stock selection methodology
Before carrying out the aforementioned weightings scheme, the NEE index has to select 300 stocks out of the A-shares universe based on their market cap, industry, non-fixed asset score and financial health score. Since profitability is not a mandatory requirement for the STAR board listing, some companies in the STAR50 index may not be profitable yet, which results in a lower debt coverage ratio and a relatively low financial health score. In addition, some STAR companies are belonging to capital intensive industries such as semiconductor foundry and robot manufacturer, which usually lead to more fixed asset and liabilities in their balance sheets, and hence lowering their non-fixed asset and financial health scores. That partly explains why STAR50 would have higher exposure in Tech Hardware & Semiconductors and Materials, while NEE would have higher exposure in Health Care. Certainly, the purpose of the STAR board in grooming innovative leaders in the hardcore technology also contributes to its focused sector exposure.
Stocks in the NEE index but not the STAR50 index
It may be counter intuitive that the NEE index contains STAR companies that are not in the STAR50 index, but that shows the straightforward nature of any market cap weighted indexes: they pick stocks mainly based on their market caps. Currently there are 12 STAR companies that are in the NEE index, but not in the STAR 50. In general, these companies have better non-fixed asset and financial health scores than the companies in the STAR50 index. Most of them are Health Care companies, including Biotech, pharmaceutical products and medical devices. Among them, Shanghai Medicilon, a contract research organization which provides drug exploration, research and pre-clinical study, is one of the best performers in the STAR board year-to-date. Its share price is ~CNY 750 and is the second largest one following Kweichow Moutai.
Performance year-to-date
Finally, let’s look at how STAR50 and NEE indexes fare so far this year. As both of them are investing in new economy stocks, it is not surprising to see they have similar returns and characteristics with the NEE index showing slightly lower volatility. The NEE index, with a greater number of stocks and is less concentrated in industries, showed its steadiness when the market sentiment turned south. That said, the STAR50 index did enjoy a sharper rally whenever the market preferred growth and emphasized the government’s supportive policies.
For most of the investors monitoring Chinese equities, it would be relevant to compare their performance with two other indexes, Hang Seng Tech Index and NASDAQ Golden Dragon China Index, which have a focus on new economy stocks but invested in offshore listed companies. At the beginning of this year, the offshore indexes had a better run until SEC rolled out new rules targeted at delisting Chinese companies which failed to comply with U.S. auditing standards. That brought all the indexes back to around the same level. However, starting from July, the two offshore indexes tanked further after Beijing tightened controls on the education and internet platform companies which are mostly listed in the US or Hong Kong. Both STAR50 and NEE indexes showed their resilience by returning some of their previous gains only during the same period of time.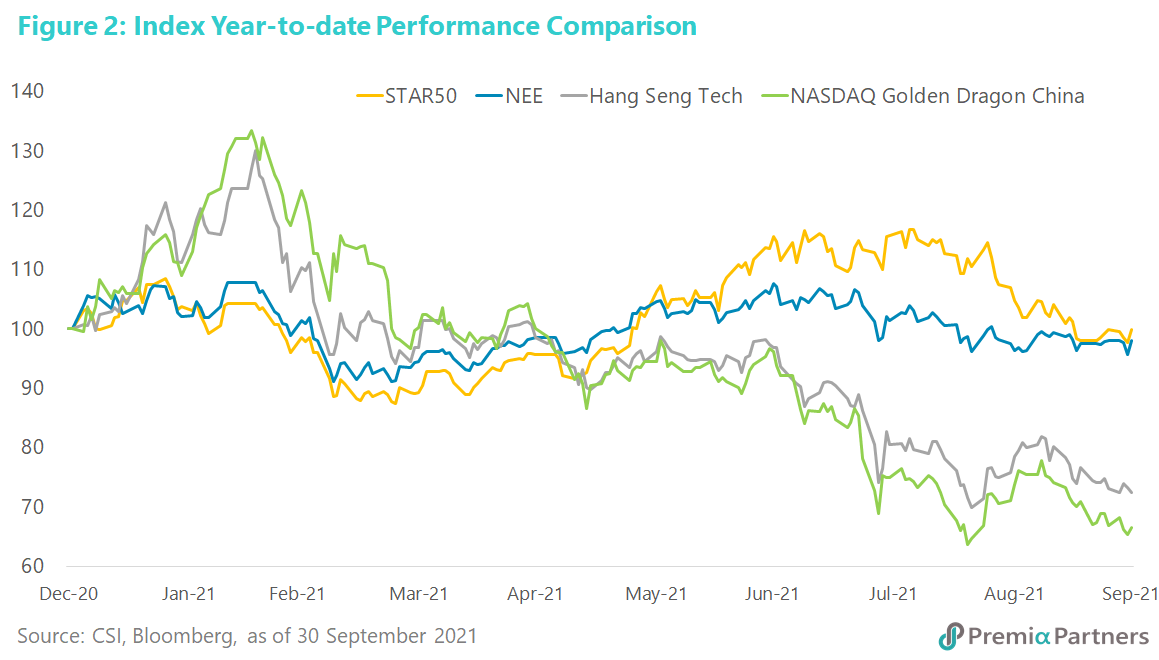
Conclusion
Given the uncertainty on the regulations from both the US and China, investors may remain cautious on the offshore new economy companies and pay more attention on the onshore sector leaders instead. Premia STAR50 ETF (3151.HK) will give investors a more concentrated and focused exposure in hardcore technology and aligns with the national strategic capabilities China aims to develop under the 14th Five Year Plan. Given the earlier stage of both the companies and the sectors, the volatility may be higher also as STAR board allows an intraday movement of any individual stocks up to 20% versus the main board’s 10%. Premia China New Economy ETF (3173.HK) on the other hand provide a more diversified portfolio of more established leaders across wider range of new economy sectors, and aims to capture various megatrends currently happening in China including urbanization, consumption upgrade, aging population, technological advancement and more. As both ETF strategies cover different segments and focuses of the A shares markets, they would be very complimentary to each other, and would act as convenient portfolio completion tool also to conventional China strategies which tend to underweight these emerging opportunities compared to traditional internet focused technology and consumer staple names.
We hope they would be useful building blocks for your China allocation. As always if there is anything we can assist, please do feel free to let us know.