
This is probably the most frequent question we get asked when describing our fundamental approach to index construction. For those of you we’ve met, this post will be a bit of refresher with some new data. For the rest, we thought we’d tackle the question head on so you don’t have to ask us!
Before I proceed, a quick word of thanks to our friends at Rayliant Global Advisors, who’ve spent countless hours studying A-shares, researching answers to these questions and educating us on why things work. If you’re interested in their research, we would be happy to put you in touch directly.
As a reminder, we do not rely on market cap for our A-shares ETFs because of 3 main reasons:
Market cap includes multiples (investor assumptions for growth), which results in buying more of high multiple firms and less of low multiple firms, i.e. buy high and sell low. We prefer to do the opposite – buy low and sell high.
We estimate that over 90% of trading in Shanghai and Shenzhen is driven by retail investors. Note the brokerage account growth in recent years in the chart below. In the US, the ratio is reversed with nearly 85% of trading driven by professionals and institutions. It’s the retail investors, not professional investors, who set prices in A-shares. Relative to other markets, we expect to see more noise and volatility, as well as more alpha potential vs market cap as a result.
Finally, market cap in China makes it impossible to get away from financials and SOEs given their valuations. While we are not against those 2 areas of the market per se, we do not want to default to them without quality control and fundamental review.
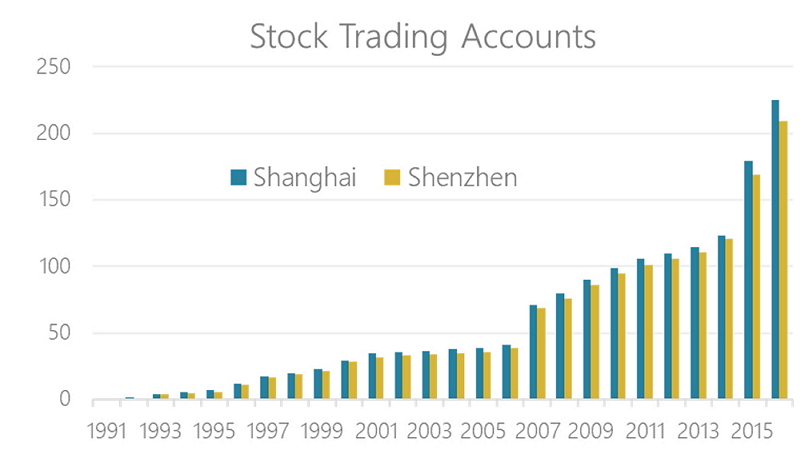
Source: Shanghai and Shenzhen Exchanges, as of Dec 31, 2017
In summary, we don’t use market cap because we want 1) a buy low, sell high discipline, 2) less noise from retail trading, and 3) more control over our allocations to financials and SOEs. Instead, we follow a fundamental beta approach, relying on audited financial statements from every listed company in Shanghai and Shenzhen. For details on the methodology, click here for our bedrock economy approach and here for our new economy approach.
Since we rely on financial statements, clients frequently ask us whether the numbers are reliable. The prevailing view seems to be that onshore accounting results cannot be trusted and an active approach questioning the financial statements is needed to generate alpha. We take a different view – of course the numbers are not perfectly accurate! But that’s where an alpha opportunity comes from and you don’t need to be an active bottom-up researcher to capture it. It’s precisely because the issue is so prevalent that we can generate alpha systematically.
Is this only a China problem?
First, let’s be clear. This is not a China only problem. Below is a chart from Rayliant Global Advisors, showing a histogram of annual ROEs in the US since 1963. The distribution is largely normal and on average positive. But look at the 0 mark. When American management teams have a slightly negative year, they pull some earnings forward and adjust the numbers a bit to make them slightly positive. That’s the big kink, or step, around the 0 mark.
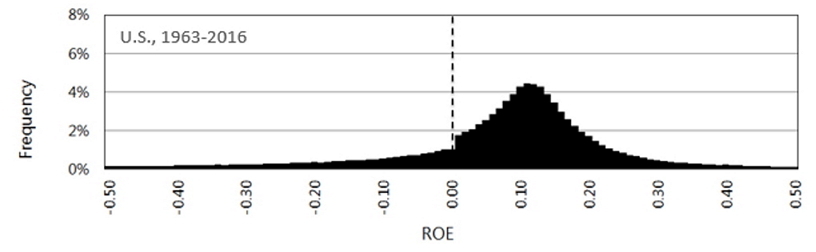
Source: Rayliant Global Advisors, as of May 31, 2017
Now let’s look at the same chart for China. The size of the problem is much greater, but the concept is effectively the same. In fact, unintended consequences of regulation are partially responsible for the greater impact here. Some of you may have heard of ST, or Special Treatment, stocks. If a stock has 2 annual losses in a row, it becomes an ST stock, which means it exits CSI indices and institutional mandates, resulting in a liquidity drop. 3 consecutive losses result in a suspension and 4 in delisting. Those are strong incentives to avoid 2 negative years in a row, which at least partially explains the strong earnings management we see below.
Source: Rayliant Global Advisors, as of May 31, 2017
How do we generate alpha from signals on earnings manipulation?
If most investors are retail, they most likely take the numbers at face value and do not study/adjust balance sheets. Active managers, of course, adjust the numbers where they believe they are not accurate. So do our ETFs, to some extent. The easiest portion of earnings to adjust is the non-cash items. Cash balances at banks are hard to manipulate so most of the adjustments happen in accruals – items like accounts receivables, interest receivables and unbilled fees, etc. Similarly, on the expenses side, accruals include liabilities not yet paid, such as salaries, bills due next year, etc.
As these are the most commonly adjusted items, they are the least stable and most mean reverting. Therefore, they are the items we deprioritize. A key part of our index methodology for both 2803 HK and 3173 HK is a Financial Health score. Each stock is ranked on five factors, two of which are borrowed from forensic accounting literature – last year’s accruals and net operating assets (NOA, i.e. cumulative accruals). Companies with low accruals and net operating assets, i.e. a small difference between cash and accounting earnings, are more conservative with their accounting and get higher weights. Companies with large accruals and NOA get deprioritized. This doesn’t capture every instance of fraud or earnings manipulation, but it does focus the portfolio on those companies where earnings manipulation is much less likely because the results are mainly driven by actual cashflows.
Theory is nice, but does it work?
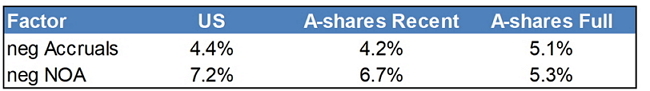
It sure does. Remember, this is not only a China problem, so we can look at US results for comparison as well. Borrowing again from Rayliant, we see positive returns from the accounting conservatism factors in both US (over ~50 years) and A-shares (~8 years and ~20 years).
Source: Rayliant Global Advisors, as of 05/31/2017; USsample: 1965-2016; A-Shares full sample: 1995-2016; A-shares recent sample: 2008-2016
For those interested, the test is constructed via a very simple market neutral portfolio, going long the best scoring 10% of stocks and short the worst scoring 10% of stocks. A market neutral return of ~5% per year is nothing to frown at!
Another way to think about accounting conservatism is to test the intuitive thinking behind it. If earnings manipulation is being overlooked by investors, then it will likely persist until an external factor exposes it. It stands to reason then, that accounting conservatism won’t be as effective during up-market periods and will deliver alpha during down-market periods. In theory, market downturns would expose earnings manipulators as it would be increasingly difficult to maintain the accounting numbers as cashflows drop. This is precisely what we see in the data below, though because we’re only going back to 2005 instead of 1965 the upward slow isn’t as clean just yet.
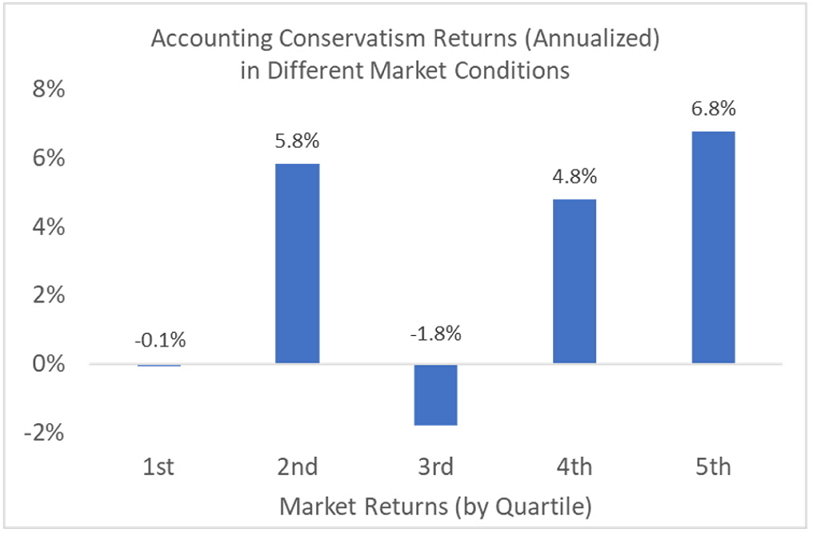
Source: Rayliant Global Advisors, as of Nov 29, 2017
To recap, earnings are managed globally, not just in China. Academic research from as far back as 1996 points to the ability of accruals and NOA to generate alpha in the US. The less sophisticated the investor base, the more earnings management you will see (professional investors aren’t as easily fooled and therefore CEOs do it less often) and the more useful accounting conservatism is as a factor. It’s particularly useful during market downturns, as poor economic performance prevents manipulating firms from keeping up the false veneer of accounting profitability.
Accruals and NOA form a key part of our Financial Health score component in both 2803 HK and 3173 HK. They are a key component of the long-term alpha generation we expect to see from those ETFs.
