
In the sovereign space, the fundamentals underlying DM versus EM government bonds have narrowed. The stereotype of EM government bonds carrying a lot more risk is outdated, as the DM leader, the US, piles on debt at a frenetic pace and undermines the independence of the central bank. There has been a dramatic uptrend in long-term DM government bond yields over the past four years, driving that rise in volatility in DM bonds.
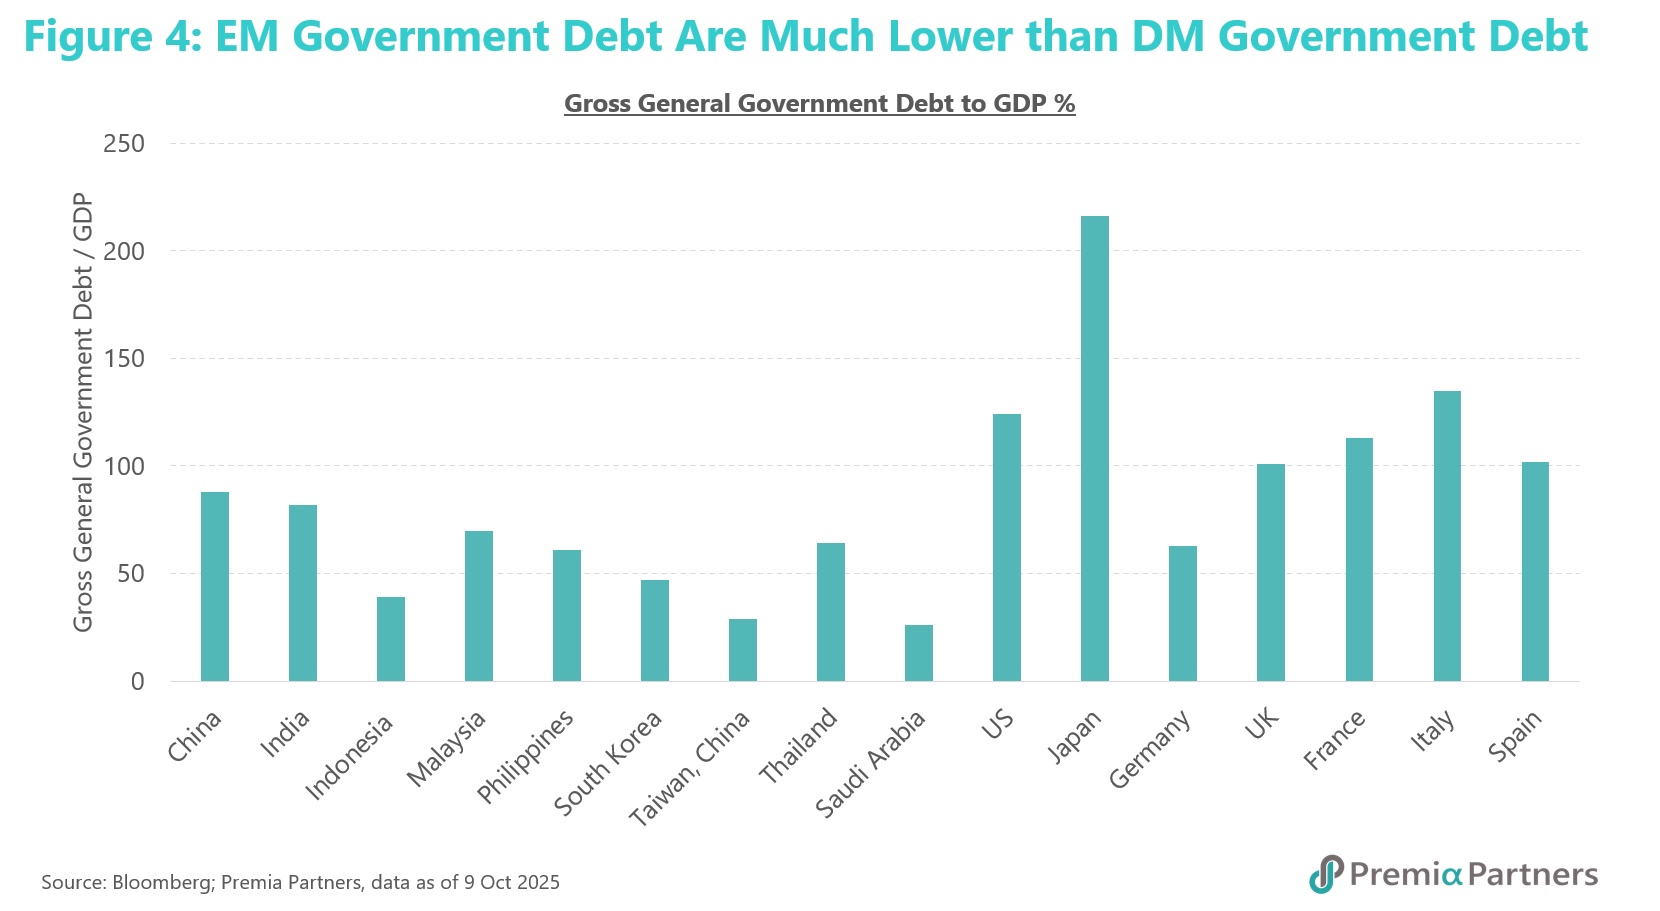
The debt to GDP ratios in EM economies are generally much lower than in DM economies – at 70% in 2024 for EM, compared to 109% for DM. Saudi Arabia’s debt to GDP is even lower at 30%, and the stronger growth potential in Asia ex-Japan and Saudi Arabia suggests much better debt servicing outlooks.
In corporate bonds, Asia ex-Japan USD Investment Grade credits generally offer higher spreads per duration for the same credit ratings compared to DM credits. The risk-adjusted returns from Asia ex-Japan Investment Grade bonds (measured by their Sharpe Ratio) have been superior to those for DM bonds for most of the past decade. Likewise, Saudi Arabia sovereign bonds also compensate investors with higher spreads than a host of other countries with greater duration risk.
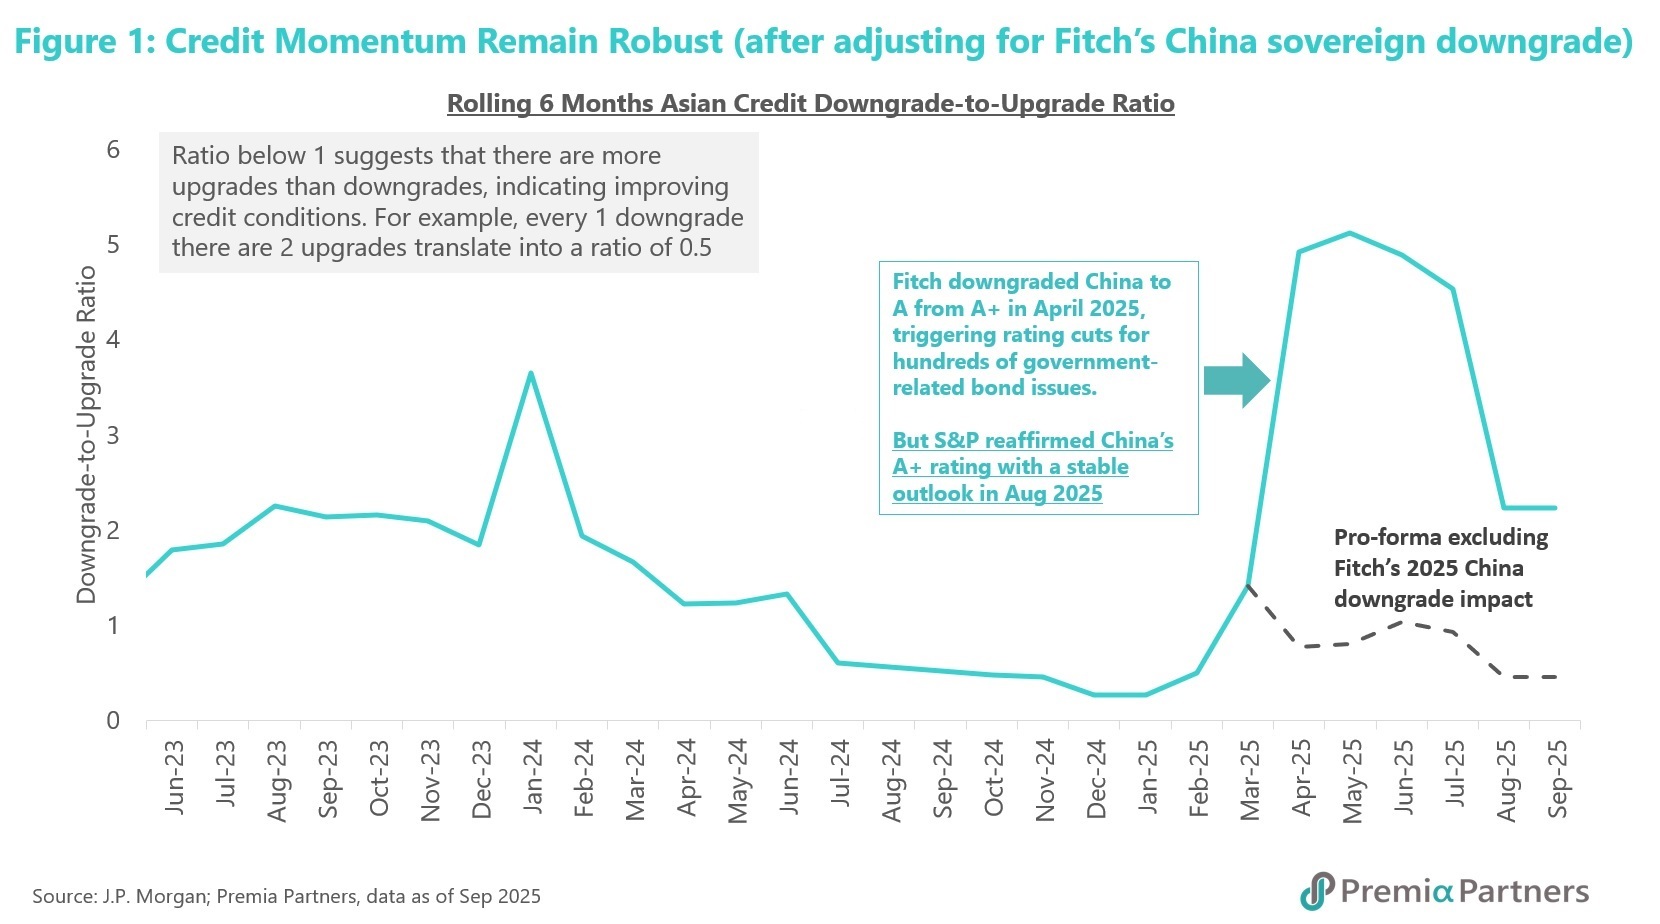
Total returns for Asia ex-Japan investment grade bonds (proxy: JACI IG) have, and continue to, lead the global and US aggregates, with outperformance over most timeframes over the past 10 years. Excluding the impact from Fitch’s China sovereign downgrade, the outlook remains positive as the Asia ex-Japan investment grade USD bonds downgrade/upgrade ratio remains low at 0.46 (figure 1). Also, new issuance in US IG credits continue to outpace growth in new supply in Asia ex-Japan IG bonds.
Along with the rush to issue new bonds, the bubble-like buying of US assets, in part caused by fear of long-term inflation, pushed US credit spreads to cyclical lows in September. They have been rising recently, partly in response to concerns about risks in private credit.
In the search for more reasonable spreads to risk, investors have turned to EM bonds. This is a timely diversification tool, for better risk-adjusted returns with low correlations. This spotlights the opportunities offered by the Premia J.P. Morgan Asia Credit Investment Grade USD Bond ETF and the Premia BOCHK Saudi Arabia Government Sukuk ETF.
DM bond volatility has been surging in line with long-term government bond yields, but EM bond volatility has been stable to lower. DM government bonds may have hit the limit of the market’s tolerance for high debt to GDP ratios, with the debt management outlook dimmed by unorthodox, populist economics. A major factor is the role of the United States, where the trajectory of government debt to GDP looks both ominous and unstoppable – prompting a key Trump Administration economic official to hint at yield curve control (YCC).
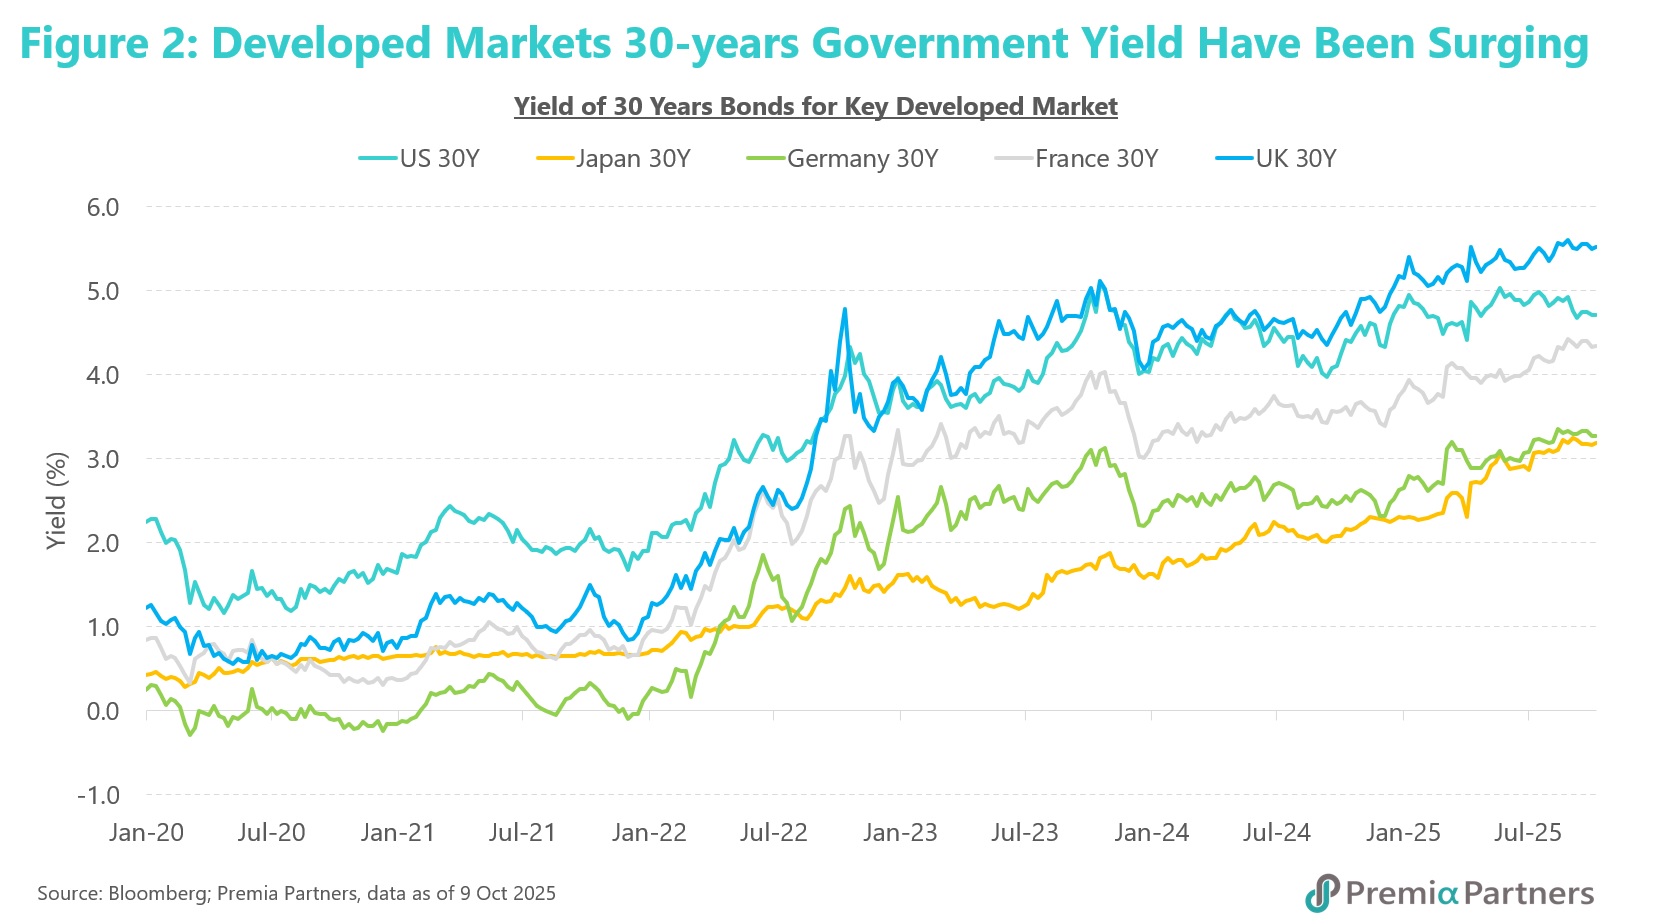
The surge in DM bond volatility coincides with a sharp rise in long-term DM government bond yields. Just about everywhere in the Developed Markets, 30-year government bond yields have been surging over the past four years – in the US, Japan, Germany, France, Canada, and Australia, to name a few – thrashing returns (figure 2).
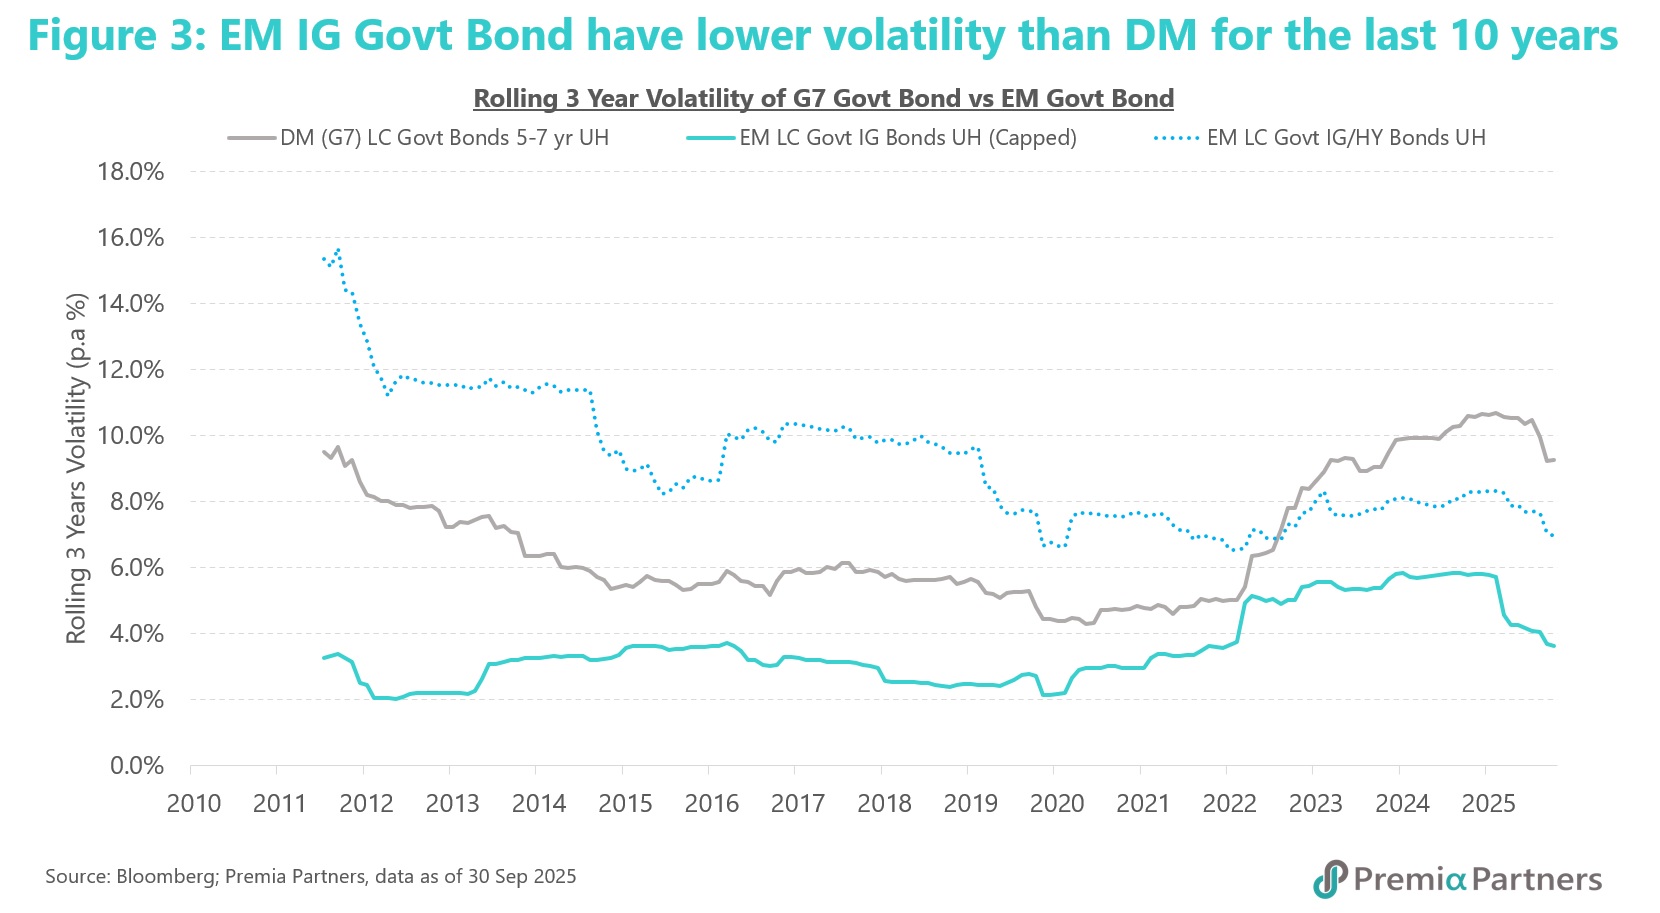
In contrast with rising DM bond volatility, EM bond volatility has been in a stable range over recent years (figure 3).
Financial repression and the mispricing of US fixed income risk. US Treasury yield curve steepening speaks of fear of longer-term inflation while the Federal Reserve suppresses short-term rates. The Trump Administration’s attempts to gain control over the Federal Reserve’s Board of Governors and the recent comment from President Trump’s latest appointment to the Board, Stephen Miran, about the Federal Reserve’s “third mandate” of holding down long-term rates, are now stoking concerns that the US in on the way towards Yield Curve Control. Bank of Japan-style YCC – extreme financial repression – will take the US into uncharted territory. It will misprice US sovereign risk, while debt and Treasury issuance balloons.
In Japan, the rise in the 10-year JGB yield in tandem with the USDJPY, from April of this year, poses challenges to YCC and speaks of the complex and competing pressures posed by fiscal demands on debt, the Yen and Japan’s sovereign debt cost. Financial repression is not without cost and risk. Indeed, the election of Takaichi Sanae as Prime Minister heightens the risk, given her previously stated fiscal and monetary expansionary policies.
Emerging Market debt to GDP ratios are generally much lower than in DM and that has contributed to stable EM bond volatility. Dominated by US and Japan’s government debt, Developed Market government debt to GDP is much higher than the major EM government bond issuers (figure 4). The US government’s interest payment as a percentage of government revenue is the highest among the major economies. It is the kind of figure associated with economies such as Dominican Republic, Jordan and Guinea Bissau. Given the dominance of the US in DM debt, it is worth noting analysis by the US Committee for a Responsible Federal Budget, which estimates the Trump Administration’s latest spending bill, if permanent, would push the budget deficit up to 9.6% of GDP and boost the Government debt to GDP ratio to 191% of GDP.
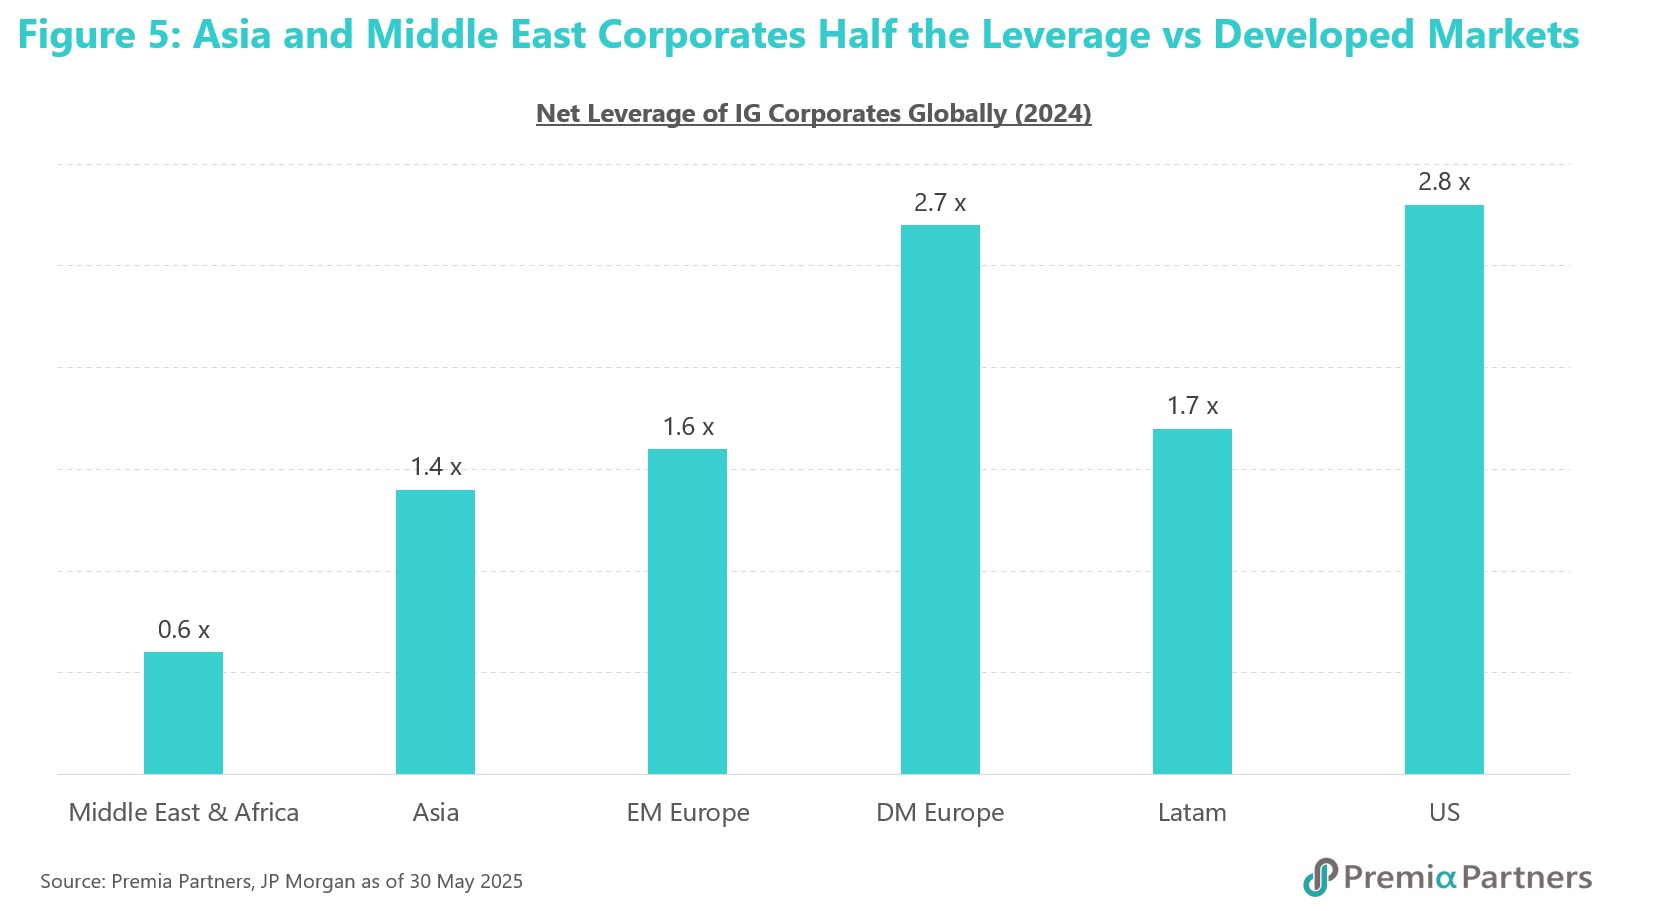
Asian and Middle Eastern Investment Grade issuers can also claim better debt fundamentals. The superior debt fundamentals go beyond sovereigns. Asian and Middle Eastern IG issuers also help lower bond volatility in their regions with their lower net leverage compared to the rest of the world (figure 5).
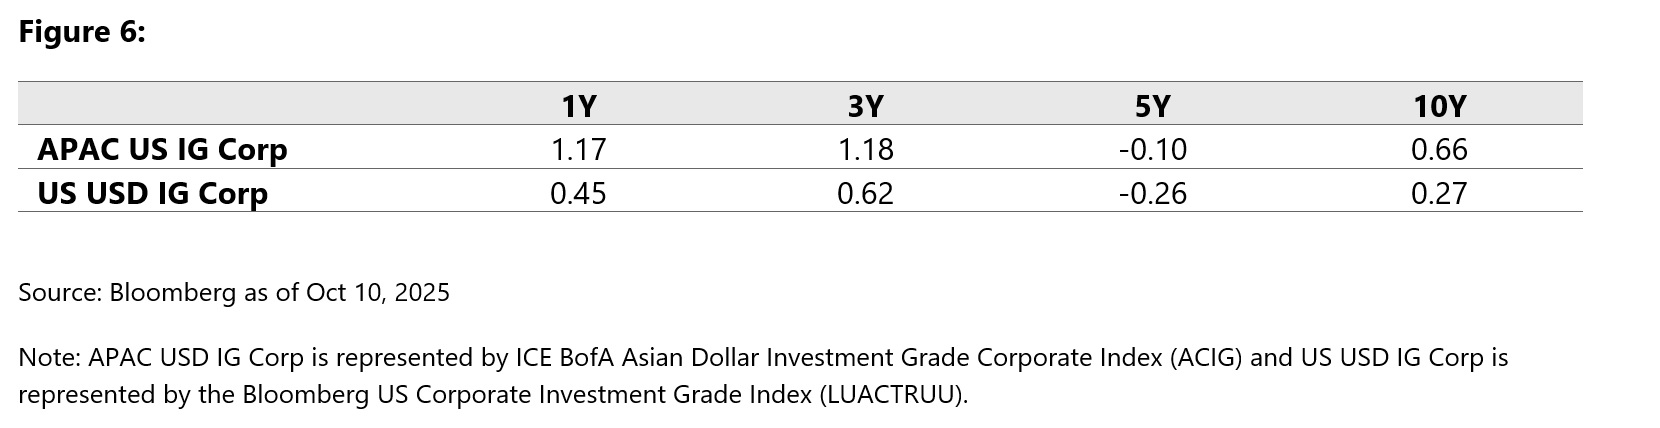
Lower volatility has translated into higher Sharpe Ratios for Asia ex-Japan investment grade corporate bonds, compared to US credits. Drilling down to Asia ex-Japan credits, that lower volatility has helped them achieve higher Sharpe Ratios compared to US corporate bonds over 1-year, 5-years and 10-years (figure 6).
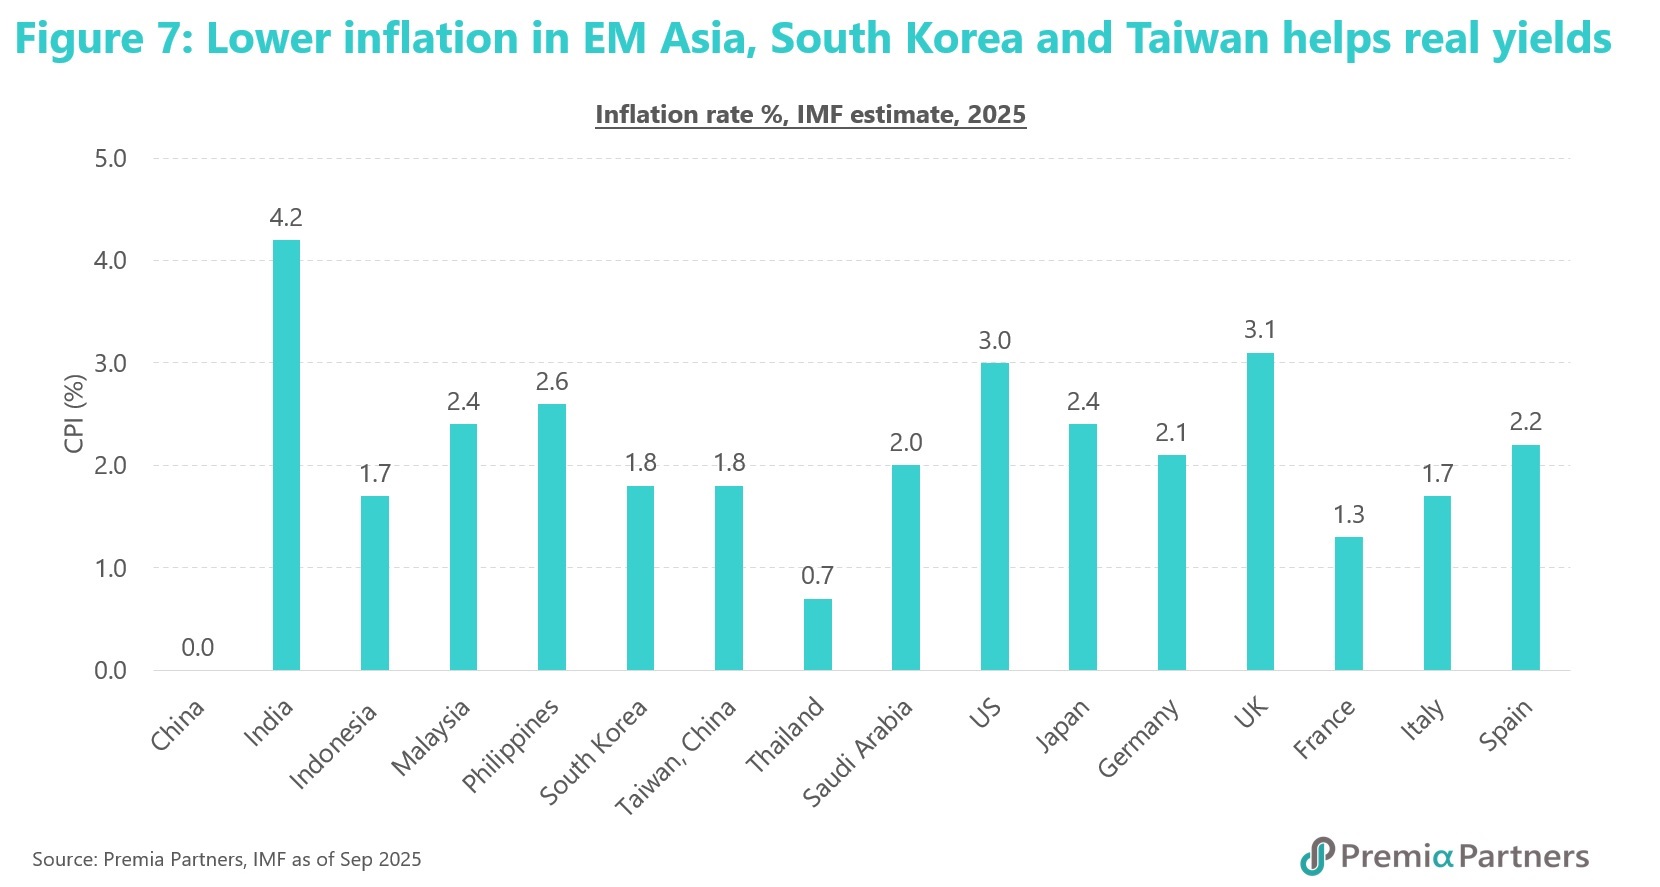
Lower inflation in EM Asia, South Korea and Taiwan helps real yields. The IMF estimates that the Advanced Economies will have an inflation rate in 2025 of 2.5%. The rate for Emerging Asia is estimated at 1.7%, but much lower in markets like Indonesia (1.7%), Thailand (0.7%) and China (0.0%). The generally lower inflation rates help sustain real bond yields compared to those in DM (figure 7).
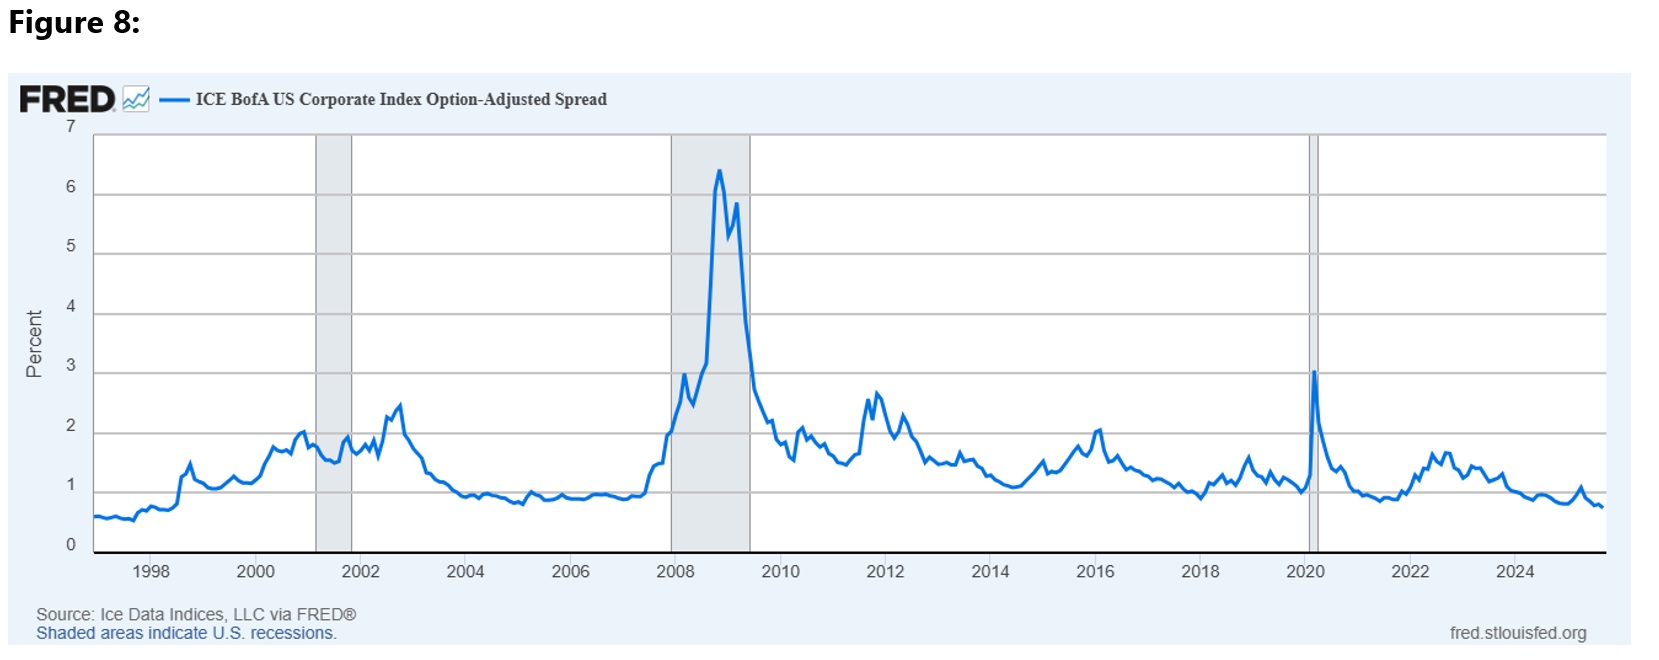
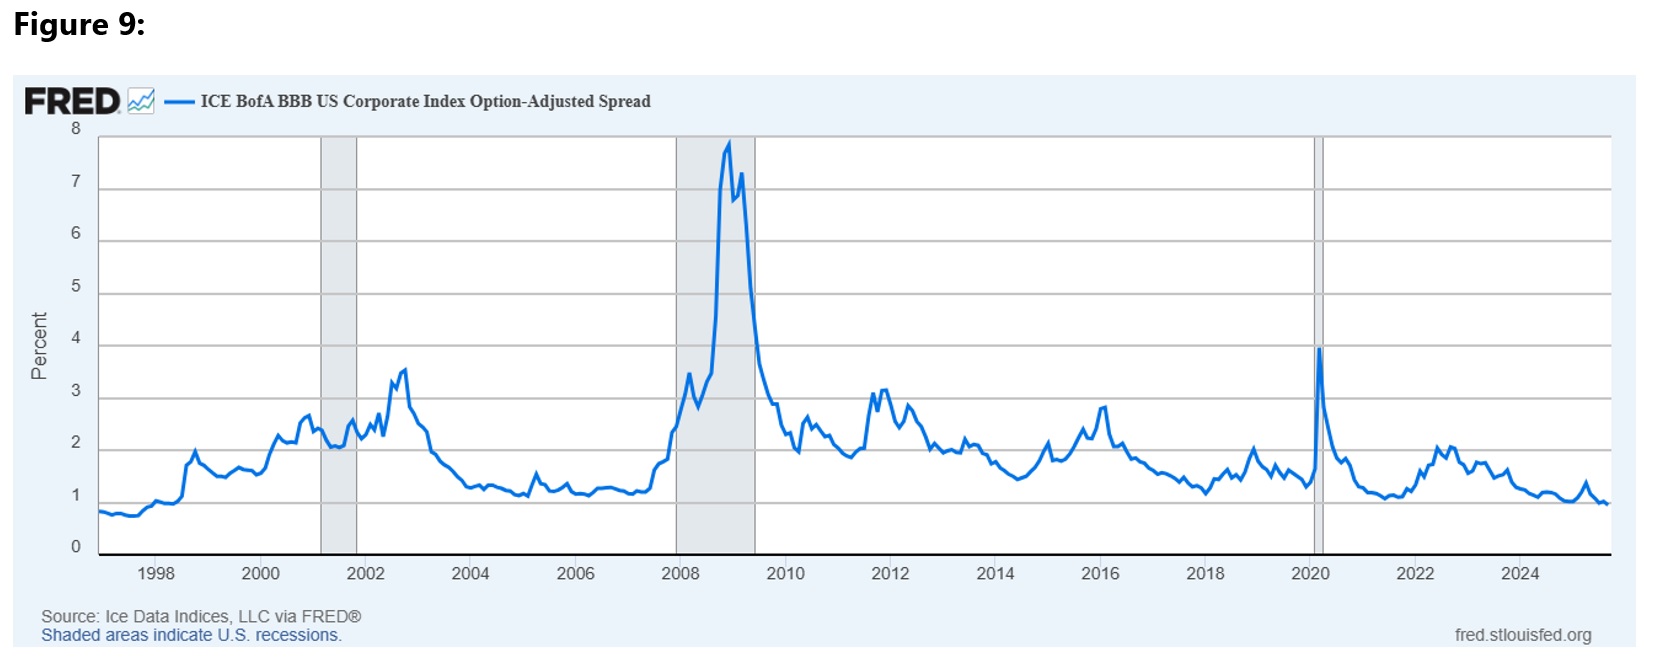
Timely diversification as the US asset pricing approaches extremes. Meanwhile, the bubble-like pursuit of US assets has pushed US credit spreads to either at their tightest or almost at their tightest (depending on the credit quality) since just before the Nasdaq Crash (figures 8, 9).
The Premia J.P. Morgan Asia Credit Investment Grade USD Bond ETF (3411 HK/9411 HK) offers that diversification with a correlation of 0.88 to the Bloomberg Global Aggregate Index and 0.93 to the Bloomberg US Aggregate Index. It offers additional spread against USTs with a duration of only 4.8 years, compared to 6.5 years for Bloomberg Global Aggregate Index and 6.1 years to the Bloomberg US Aggregate Index.
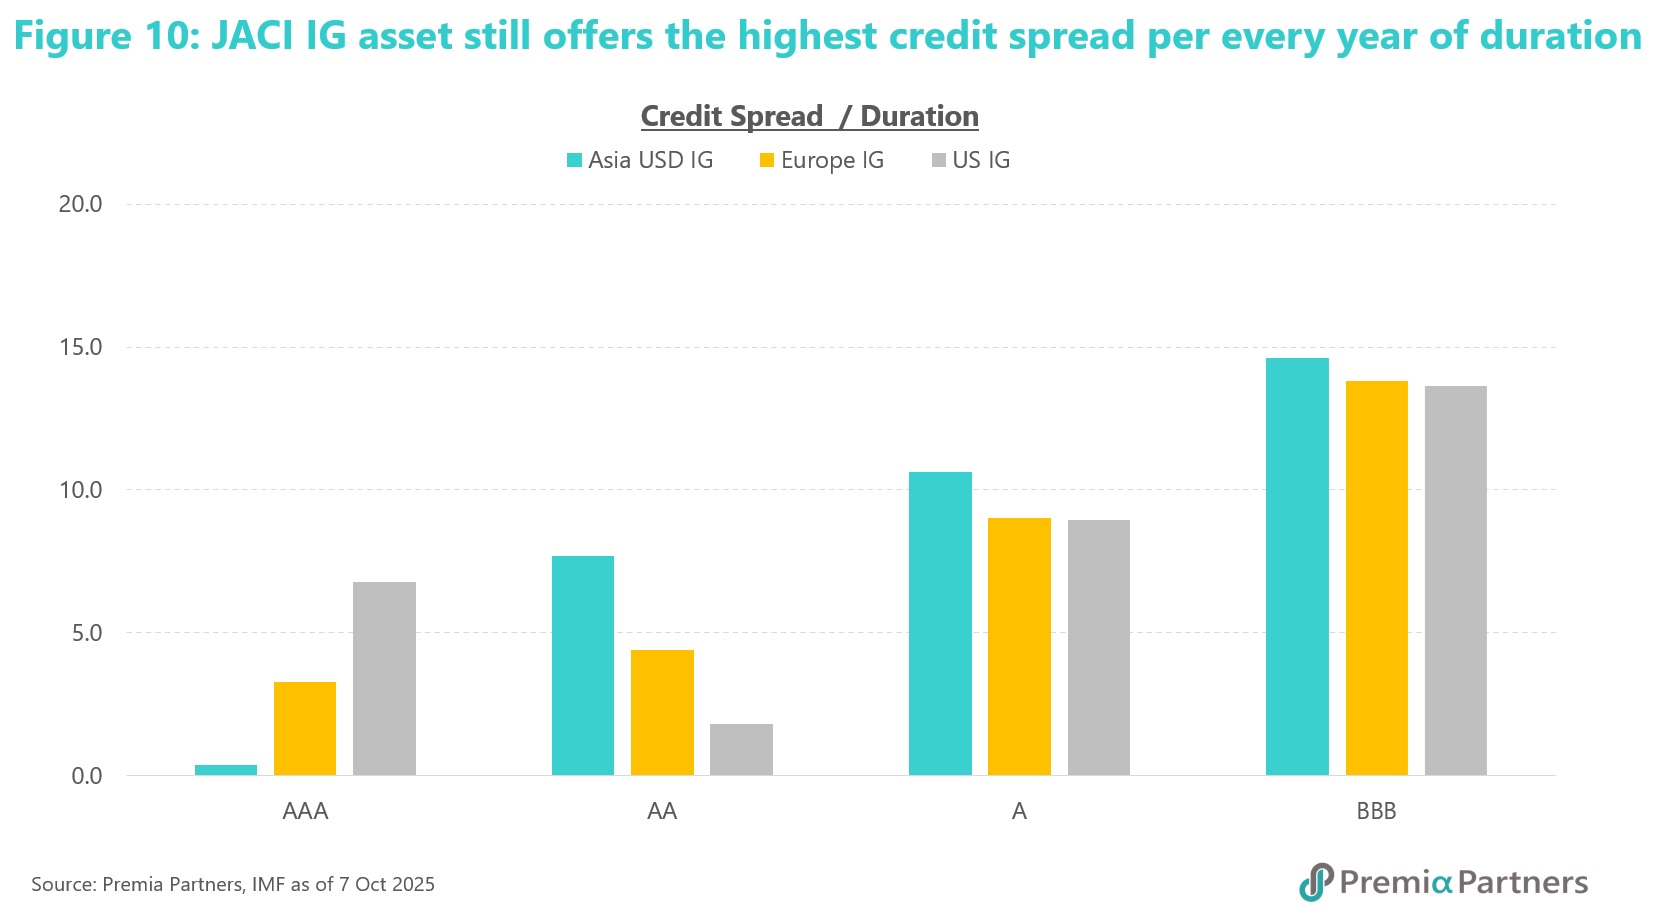
Note that Asia IG bonds offer the highest spreads per duration in most credit quality categories (figure 10).
Similarly, the Saudi Government Sukuk ETF offers valuable portfolio construction benefits, in its low correlation with both equities and other fixed income instruments. The correlation between Saudi government sukuk and broader emerging market bonds is just 0.21. Against US Treasuries, the figure stands at 0.39. And they offer a yield pickup of 70 to 110 basis points against comparable US Treasuries, without compromising quality, given the Saudi Arabia government debt to GDP ratio of only 30% and the Saudi Riyal’s peg to the US Dollar.
As markets redefine risk free assets and investors seek to protect their asset values from threats posed by runaway fiscal deficits, beneath the surface of the short-term volatilities and possibly a longer-term repricing of multiple assets, Asian investment grade bonds and Saudi government sukuks may just be the sweet spots for attractive, uncorrelated and resilient returns regardless which side one is at on the debasement debate.
