
Market and economic cycles are turning.
US economic growth is easing, with indicators suggesting heightened risk of a recession in 2020. US stock valuation, measured by the S&P 500 cyclically-adjusted price to earnings (CAPE) ratio, had hit previous cyclical peaks, is mean reverting and will likely continue doing so. The Chinese economy will continue to slow, with feedback loops for the rest of the world.
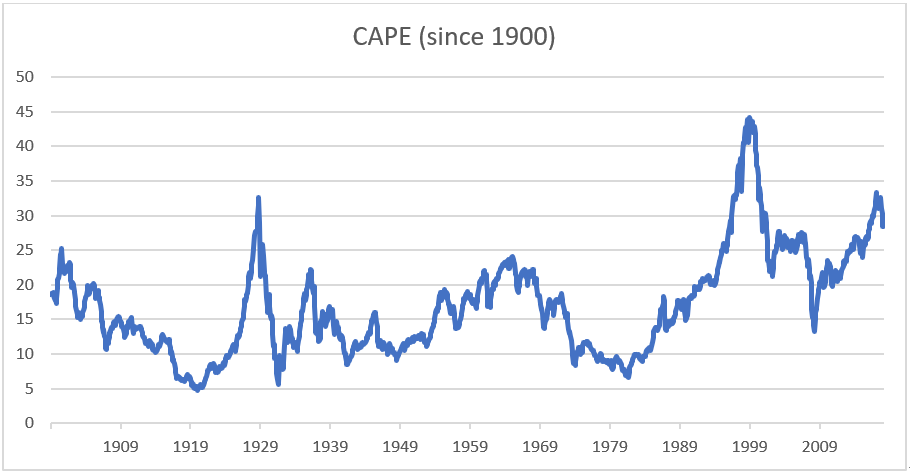
Source: http://www.multpl.com/shiller-pe/, as of 24 Jan 2019
The good news is there are no suggestions at this stage of another financial crisis. So, a 45-50% wipe out such as suffered in the Nasdaq Crash 0f 2000-2002 and the Global Financial Crisis of 2007-2009 is unlikely. But even without the trauma of structural dislocation, there is still a cycle, with implications for investor strategies.
January last year, I wrote in the Straits Times newspaper of Singapore a cautionary piece headlined “2018: Tamper that exuberance”. You can read it here. I cautioned that an “Indian Summer” – an unseasonably warm spell in late autumn – should not be confused with perpetual spring. There is a cycle and we are late in that cycle. Yes, the global economy would continue to grow in 2018. I also agreed an outright bear market was unlikely absent a recession. Nevertheless, risks were rising. And “nothing lasts forever – not bull markets, not bear markets.” That was last year.
The bear in the East
Back to the future: While markets are now rebounding from the late 2018 selloff, I believe we are already in the midst of a slow motion, saw-toothed, global bear market, which started in the East. Most of Asia is already in a bear market. It’s patchy – what with the recent rebounds taking some indices that had entered bear market territory out of the 20% decline threshold. But zooming out for a bigger picture, it’s a bear market in most of Asia ex-Japan, albeit with a lot of noise and movement. That leaves the US, Europe, and Japan, which are all teetering on the edge of bear markets.
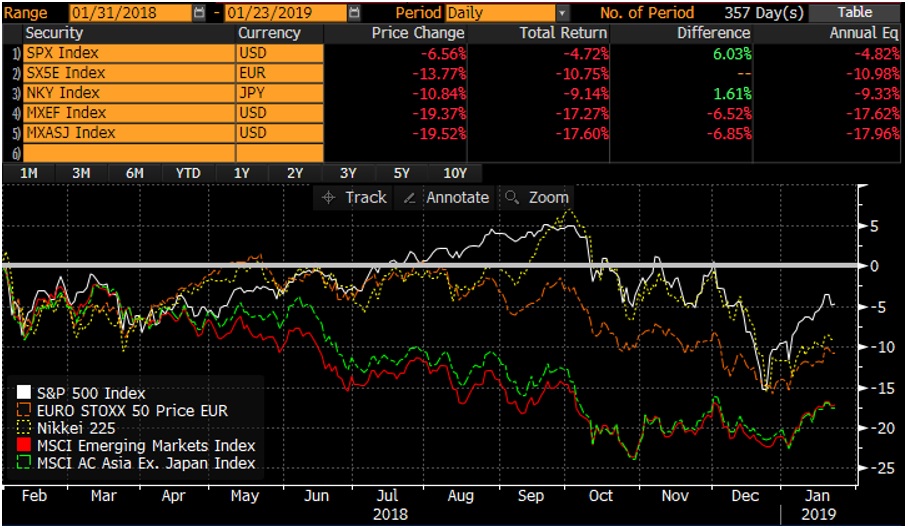
Source: Bloomberg, as of 24 Jan 2019
The economy, East & West
The US economy is at or a little past its prime. The US economy will be coming off the Trump fiscal stimulus of 2018 at a time when borrowing costs have been raised. And this is at a time when the Federal Reserve is low on monetary ammunition and government debt to GDP some 66% higher than before the start of the Global Financial Crisis.
The yield curve is worrying. The spread between the 10-year and the 3-month US Treasury yield is still positive. But at around 38 basis points at time of writing, it’s a pretty flat yield curve. The 10-year minus 2-year is even flatter at 17 basis points. Ditto for the 10-year minus 1-year. On historical averages, it still does not suggest a recession within 4 quarters. On past studies, you would be looking at heightened risk of recession only when the curve inverts.
But these are rapidly changing indicators, with much in the hands of the Fed. If the Fed raises rates by just 25 basis points this year, the picture could change quite quickly. For the record, although it’s quite widely known, a negative 10-year minus 1-year spread successfully predicted recession in 9 out of 10 instances since 1955. The only time it triggered a “false alarm” was in 1966. Even then, it picked out dramatic slowing of economic growth from 6.6% in 1966 to 2.7% in 1967. More importantly, the S&P 500 flatlined between start-1966 and end-1967.
V.I. Lenin famously said: “There are decades where nothing happens and there are weeks where decades happen.” Middle of last year, Fed staff told policymakers that their preferred alternative to the yield curve – the “near-term forward spread” – suggested only 15% chance of a recession. (The near-term forward spread measures the difference between the forward rate implied by Treasury bills six quarters from now and the current three-month yield.) Well, that spread went negative early this year, suggesting a recession in 2020.
The Chinese economy is not going to be much help, as it was during the recovery from the Global Financial Crisis. China’s GDP growth came in at 6.6% for 2018, its slowest since 1990. This is likely to slow further to around 6% for 2019. The official manufacturing PMI fell to 49.4 in December, suggesting contraction. The Caixin Manufacturing PMI confirmed this with a reading of 49.7, the first contraction in 19 months. And while China will stimulate to avoid a precipitous growth decline, it is unlikely to repeat the grand stimulus unveiled in 2008. The high and growing “credit-intensivity” of economic growth in China will set limits. And China’s slowdown has already reverberated around the world.
Germany’s economy – which like much of Europe has strong linkages with China – contracted in 3Q2018 (-0.2%) and may have only narrowly avoided another decline in 4Q2018 (with estimates suggesting +0.1% growth). Eurozone GDP growth for 4Q2018 and 1Q2019 will likely register sluggish growth, marginally above zero. And with Brexit looming, civil disruptions in France, and slowing growth in China, the outlook for the rest of 2019 is unlikely to brighten.
ASEAN’s growth momentum also eased in 2H2018, with the Nikkei ASEAN Manufacturing PMI at 50.3 for December 2018, suggesting activity was flatlining.
Where does it go from here?
My central scenario is the global economy stagnates or goes into a mild recession.
Given only a mild recession, the bull market is likely to end on a whimper rather than a roar – meaning it will likely be painful but not catastrophic. It’s unwise to rule out a financial crisis. But over the past 10 years, the ruthless use of “policy puts” have proved potent in containing potential crises. And I’m not about to guess when markets stop believing. Market confidence is a critical element – the linkages between markets and the economy mean perception can create reality.
The companion to this economic slowdown will be disinflation rather than inflation. Stagflation looks unlikely. China’s producer price inflation rate peaked in June and has declined markedly since. Consumer price inflation has been easing since October. US inflation peaked mid-year and has been declining since. And with the 4Q plunge in oil prices, there will likely be further easing in inflation around the world.
Equities: This is already a desynchronised bear market, with many of Asia’s markets already down more than 20%. Given the gradual and patchy slowing of economic growth, there will likely be more rebounds such as the one that started in January. But a series of lower highs and lower lows is the most likely end result.
The US market - the global leader in stock performance over the past 10 years – is now at an extreme of relative performance against other global markets. US stock valuations are now at a substantial premium over the rest of the world. Given falling US earnings estimates, it may be better to look at the trailing PE ratio. It’s 18 times for the S&P 500, compared to 12 times for the MSCI AC Asia Pacific. The price to book for the S&P 500 stands at 3.1 versus 1.4 for MSCI AC Asia Pacific. You get the same picture of high relative valuation for US stocks vis-à-vis other indices, including the Euro Stoxx 50. In Greater China, the relative valuation becomes even more extreme, with the HSCEI at 8 times PE and trading on book value. On the Shiller CAPE, US valuation is almost double that for emerging Asia – at around 29 times versus 15 times for Emerging Asia.
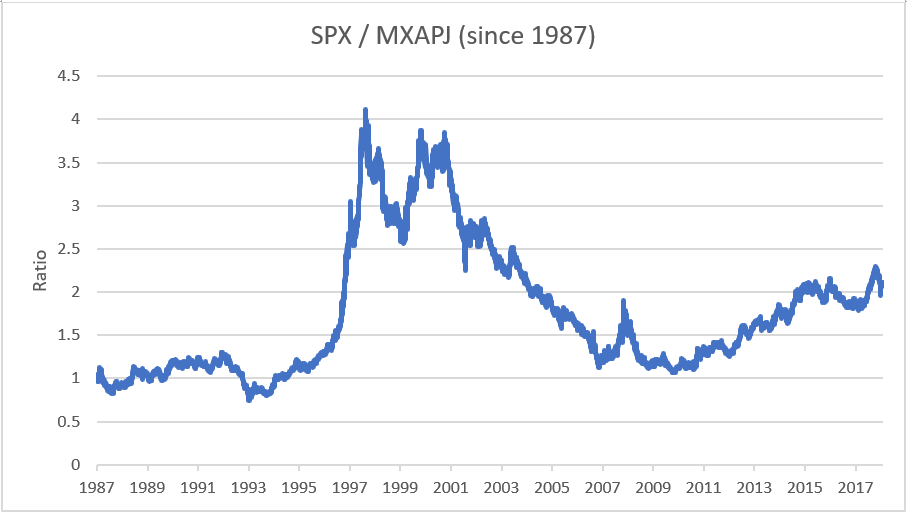
Source: Bloomberg, as of 24 Jan 2019
Of course, I don’t know if this overvaluation is about to end. But here again, I will say “nothing lasts forever.”
That US equities overvaluation was driven by the idea of American “economic exceptionalism”. But if the US economy slows, as I expect it to, that “exceptionalism” may be nothing more than cycle divergence. And markets which have already sold down to factor slower economic growth – that is emerging market Asia – may be better bets as US equities start discounting their coming slowdown. Also, a dovish Fed is bearish for a US Dollar that had seen a rally of almost 6 years, from April 2011 to January 2017. Indeed, flat or even lower US bond yields and a weaker Dollar – which is what I expect – will ease pressures on Emerging Market economies and assets.
This is not to suggest that Asian ex-Japan or Emerging Market equities will be immune to a global recession. But much of the bad news is likely to already be in the price.
With the likely “regime change” in the economy and markets, investors should also consider a style change, from growth to value. And to switch to stocks/sectors with lower GDP-sensitivity – healthcare, consumer staples, telcos, and utilities. In Emerging Asia, the focus might be less on sectors than on quality, as China balances between growth, reform, and the trade war threat. That means stocks with low valuations, strong balance sheets, and defensible earnings.
Bonds: Unloved amidst rising rates in 2018, bonds could see a modest return to favour this year, as the cycle turns and as the Fed loses its appetite for rate hikes.
US Treasury yields have probably seen their peaks at 3.24% for the 10-year and 2.96% for the 2-year. They could trade back up a bit but we are unlikely to see a break above those late-2018 peaks. Indeed, with more downside likely in equities, investors could return to government bonds to stabilise portfolios.
The yield curve has completely flattened as future economic growth prospects dim. Equities have performed poorly in 2018 and are likely to do worse this year. With yield curve inversion – and an
accompanying recession – a possibility, investors could consider increasing the average duration in their bond portfolios.
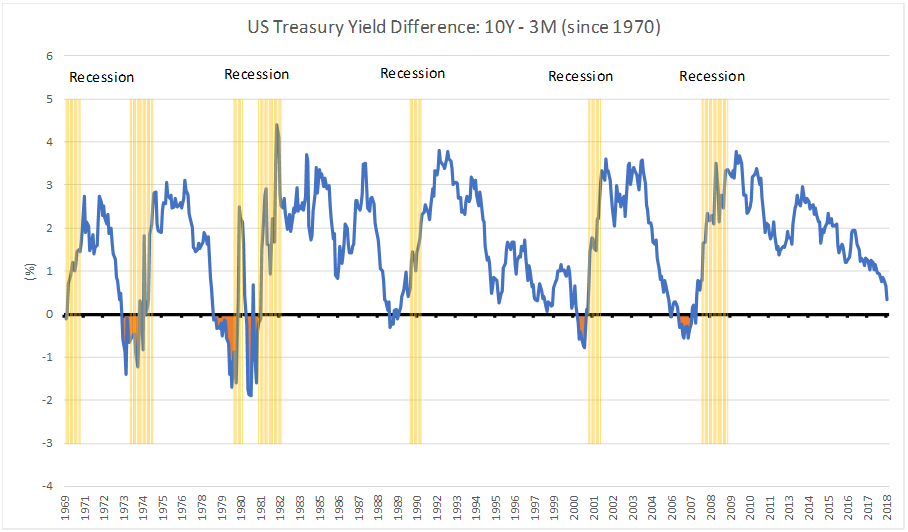
Source: Bloomberg, as of 24 Jan 2019
They should also consider moving up in credit quality as the world economy slows. With deteriorating economic conditions, and likely accompanying pickup in credit defaults, spreads will also likely widen.
Commodities: Crude oil prices could rebound on oversold conditions, but their prospects are unexciting with slowing economic growth. Don’t expect a return above US$70 for WTI. Industrial metals have had a tough year in 2018. But the rolling over of prices from 2018 may not be done yet, as the Chinese economy continues to slow.
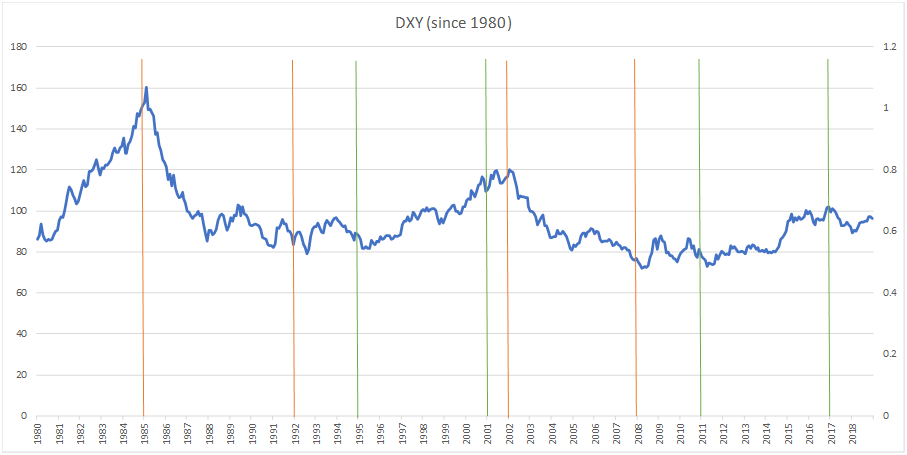
Currencies: The US Dollar bull market from April 2011 is likely over. The peak was probably January 2017. If indeed we have seen the peak of US “economic exceptionalism”, then the DXY (the US Dollar Index) rally from January 2018 is unlikely to break past the prior high of 104. Indeed, the bounce last year may have been a counter-cyclical move within a new Dollar bear market, which could have started early 2017.
The DXY’s recent cycles have lasted around 6-7 years: 1985-1992 (down); 1995-2001 (up); 2002-2008 (down); 2011-2017 (up). The move from April 2011 to January 2017 was close to 6 years. History doesn’t have to repeat itself to satisfy chart symmetry. But there might be limits on how long the US economy can withstand bouts of Dollar strength.
DXY strength since early 2011 had been driven by interest differentials between US and G9 rates, and that relationship is visible using the differential in the 2-year swap rate between the US and the G9 as a proxy. Chances are interest rate differentials will roll over, taking support out from under the Dollar.
Source: Bloomberg, as of 24 Jan 2019
US dollar weakness may be most pronounced against the JPY, as the threat of a US recession and equities weakness see further unwinding of JPY loans.
The International Monetary Fund (IMF) reckons the US Dollar is overvalued against fundamentals, and the Bank of International Settlements says it is overvalued relative to its long-term average.
It has to be said though that speculative bets on continued appreciation of the Dollar are still running very high, continuing the upward swing in sentiment from mid-2018. But that may be a signal that this is a very crowded trade that could unwind later in the year.
I go back to my thinking on these things – there are cycles and nothing lasts forever.
Unless otherwise stated, all data are sourced from Bloomberg as of 21 Jan 2019.
