premia-parnters logo
Nightmare on Wall Street: Why the US Bond and Stock Selloff Is Likely to Get Worse
2023. 10. 19.
From “Goldilocks” to “Nightmare on Wall Street” – the convergence of structural and cyclical forces looks set to inflict a lot more damage on US assets. For some time now, we had been warning about the upside risks to US Treasury yields. That slow, upward creep in US Treasury yields recently turned into a rampage, with nasty implications for both US bonds and equities. Meanwhile structural factors are further feeding the rise in UST yields – more supply, less demand. In this article, our Senior Advisor Say Boon Lim discusses about the great refinancing pressure of US government debt looming, how a lot of stuff could “break” if funding costs keep going up – including US banks – and how things may play out if the structural factors are dominant, a cyclical economic downturn may not necessarily bring down funding costs.

From “Goldilocks” to “Nightmare on Wall Street” – the convergence of structural and cyclical forces looks set to inflict a lot more damage on US assets. For some time now, we had been warning about the upside risks to US Treasury yields. That slow, upward creep in US Treasury yields recently turned into a rampage, with nasty implications for both US bonds and equities. This rout is unlikely to end quickly. There are always rebounds in downtrends and consolidations in uptrends. But cyclical and structural factors are converging to drive both stock and bond prices lower.

  • The US labour market remains tight – this is inconsistent with the disinflation narrative.
  • Holdings of US government securities by the Fed, US commercial banks and foreigners are declining amidst a structural rise in US government debt and in the issuance of US Treasuries.
  • That combination of additional US Federal government debt issuance and lower demand has created – from the start of 2022 to October this year – an additional US$5.36 trillion of US government securities for the private US market to absorb. If the trend continues, we could see the 10-year UST yield above 5.0% next year. Indeed, we had previously noted that the historical spread between the Fed Funds effective rate and the 10-year US Treasury yield suggests a theoretical average 10-year yield of 6.3%.
  • Also, about half the US government’s fixed rate marketable debt matures between 2023 and 2025. That is another almost US$11 trillion to digest.
  • This is the inevitable price of profligacy. Media and finance industry commentators had been flaying China’s policy makers for not firing the metaphorical “Big Bazooka” of monetary expansion for debt-driven fiscal stimulus. Chinese policy makers’ caution has seen the value of China Government Bonds trade in a stable, sideways range around 100. The stark contrast is a collapse in the value of the US Treasury market, which Bank of America analysts have concluded is unprecedented in US history.
  • Meanwhile, the commodity markets are telling us that something in the US economy is going to break. The copper/gold ratio has been falling since mid-2022, while the 10-year yield has been rising. Normally, they move in tandem, and this is the nightmare scenario: The US economy goes into recession, but structural forces override the cyclical to keep UST yields painfully high – that is, a variant of stagflation.
  • US banks are at risk of a re-emergence of a liquidity or even solvency crisis if US Treasury yields keep rising. Note the very significant market underperformance of US banks versus Chinese banks.

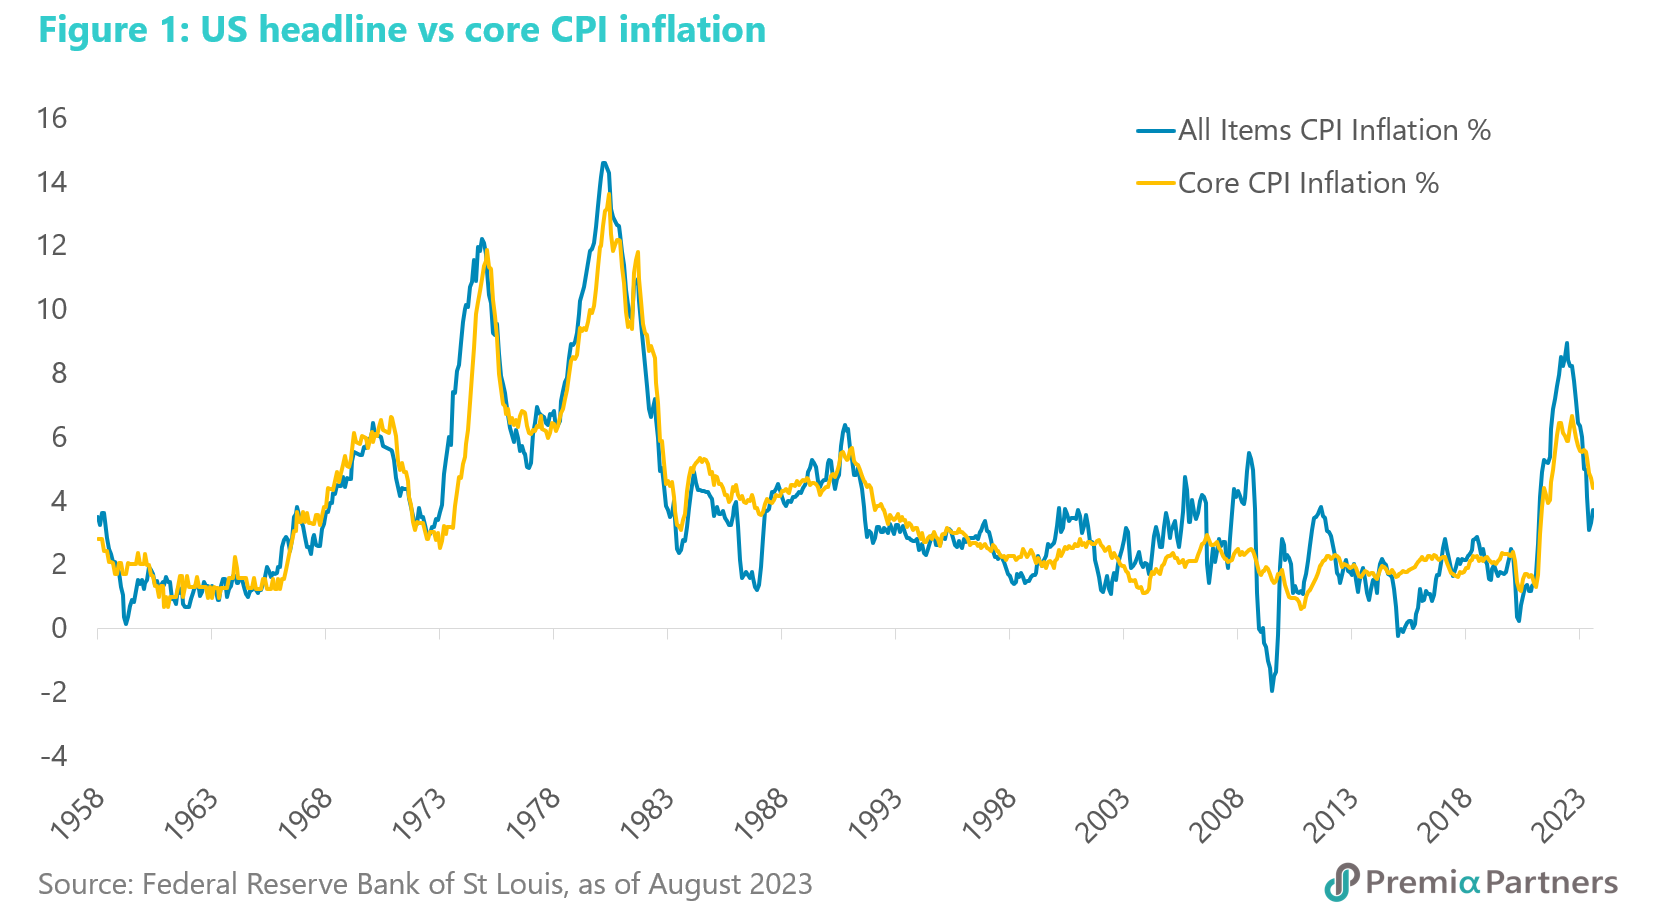
The cyclical battle against inflation continues. Declarations of “the end” of this inflationary episode are premature. The decline in oil prices and the flow-on to lower US gasoline prices contributed much to the disinflation from middle of last year. The upturn in oil prices from the middle of this year, as a result of production cuts, has started to reverse the inflation data, on a m/m basis. The outbreak of war in the Middle East – between Israel and Hamas – threatens resumption of that oil price rally. Speculation that Saudi Arabia might lift oil production and normalise relations with Israel in exchange for defense cooperation with the US had contributed to a decline in oil prices in early October. That is less likely now. 

Meanwhile, the tightness of the US labour market suggests an uptick in headline (all-items) inflation could spill over into core (ex-food and energy) inflation through wage inflation. Typically, where headline inflation goes, core inflation follows, and at this time, the tight labour market makes it all the more likely that workers, under cost-of-living pressures, will get their demands for higher wages.
Structural factors further feeding the rise in UST yields – more supply, less demand.  There are two drivers for the ongoing surge in US Treasury yields. One is inflation and the related Fed rates fears. The other is falling demand for US government securities at a time of surging supply. The former – inflation and rates – could be argued away as “cyclical”. But the latter – demand for and supply of US government securities – is structural.

At the heart of this is the surge in US government spending and debt since the start of the pandemic, which has driven a sharp rise in US government debt from US$23.2 trillion at the start of 2020 to US$33.5 trillion currently. Yet, the Federal Reserve has been running down its holdings of US Treasuries and Agency debt; commercial banks are holding less US Treasury and Agency securities; and the total foreign holdings of US Treasuries has been stagnant.

From the start of 2022 to October this year, the total US public debt outstanding has risen US$3.9 trillion ($29.6 trillion to $33.5 trillion). Yet, we estimate that the combined holdings of US Treasuries and Agency debt by the Fed, US commercial banks and foreigners have fallen around US$1.46 trillion. (Note that the latest foreign holdings data is for July, but given the general trend since January 2022, it would seem reasonable to assume continuation of that sideways drift in the total holdings.)

So that means over that period there was an additional US$5.36 trillion for the rest of the market (ex-Fed, US commercial banks and foreigners) to absorb. 
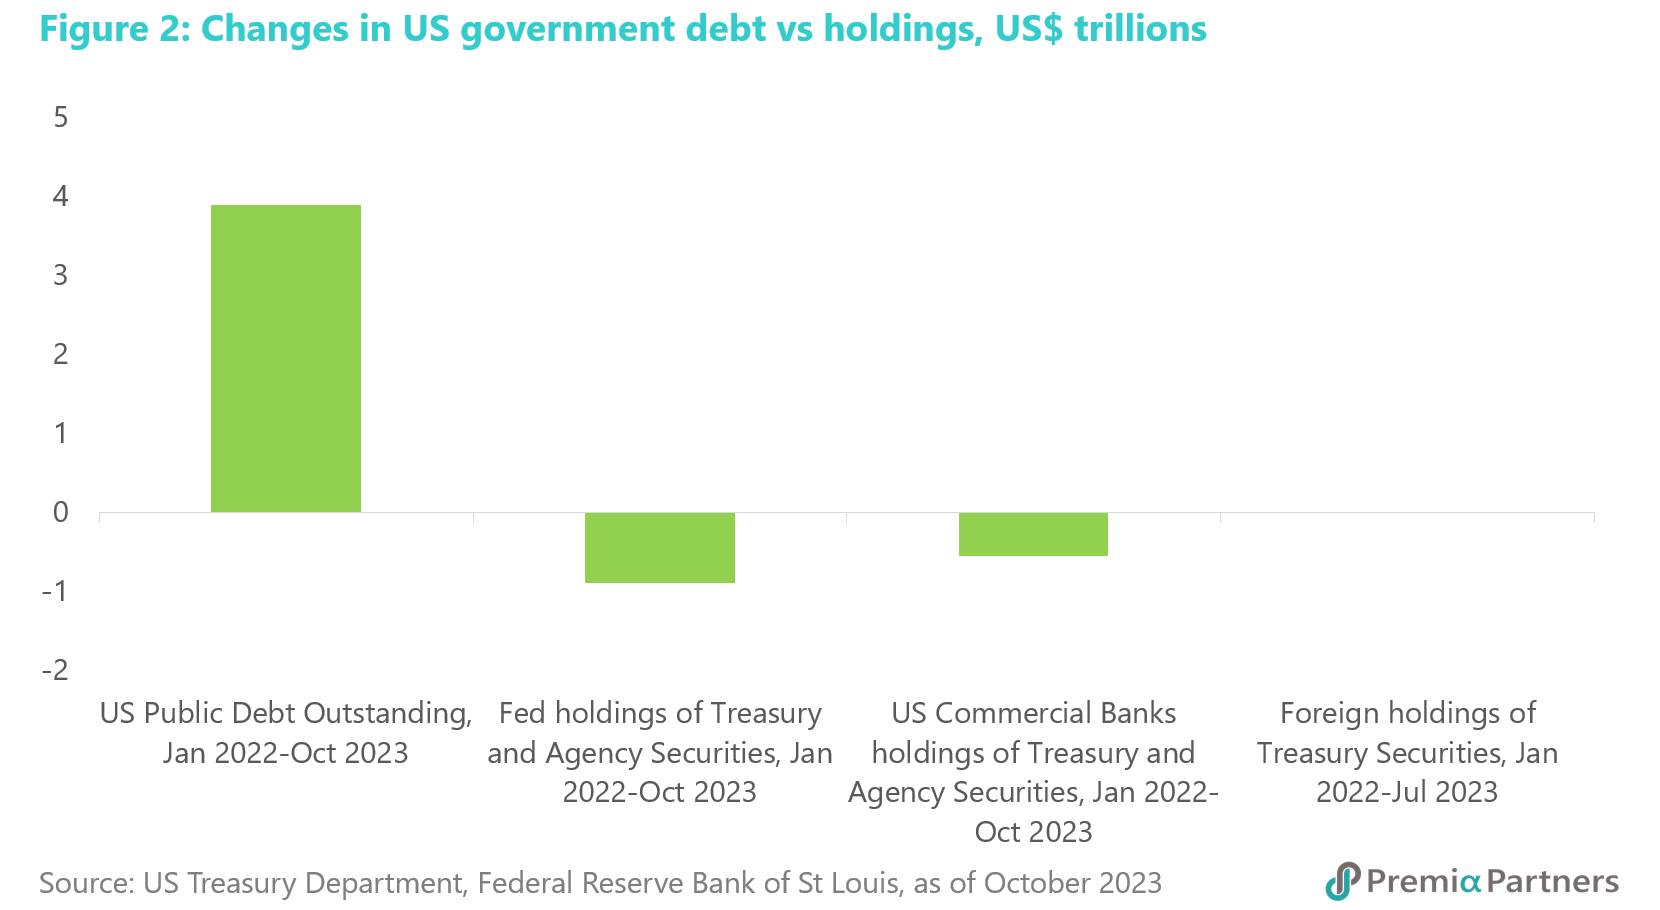
For context, that is almost six years of incremental US federal government debt held by the public, averaged over the ten years (2009 to 2019) before the pandemic. That was a lot to absorb by a combination of private US investors (funds and individual investors) and US state/local governments. If it keeps heading in this direction, we should not be surprised to see the 10-year yield above 5.0% next year.

Structural factors further feeding the rise in UST yields – the Great Refinancing of Government Debt. The Federal Reserve Bank of St Louis published a paper in June which broke down the percentage of the Government’s “fixed rate marketable US Dollar debt” (FRMUSD) that is maturing and in need of refinancing in coming years. Stripping out the non-marketable and variable rate debt, the FRMUSD base is US$21.4 trillion. According to the paper, 51% of that debt matures between 2023 and 2025. That is US$10.9 trillion. Even worse, this figure does not take into account the short-term (1-year) securities yet to be issued, and that could be significant: This refinancing requirement this year was estimated at around US$6.4 trillion. Around US$3.5 trillion to US$3.6 trillion – more than half – is from 1-year debt. These figures are conservative because they were compiled from end-2022 data. So, they would not have captured short-term debt issued in 2023.

The market is now starting to talk about a 6.0% 10-year yield. Media and financial commentators have started saying over the past few weeks that a 6.0% 10-year UST yield is a possibility.

We will only repeat what we wrote in our weekly email newsletter back in August – that 6.3% for the 10-year yield is a historical average given where the Fed Funds effective rate is.

We wrote then that “going back six decades, the average spread between the 10-year UST yield and the Fed Funds Rate is around 100 basis points.” The Fed Funds Effective Rate was then 5.33% and coincidentally, it is still at 5.33% currently. So, add the historical average spread and you have 6.3%. But we also said: “This is not to suggest that the historical average has to suddenly assert itself. It is to suggest that the balance of risk for US Treasury yields continues to be on the upside.”

Copper/gold ratio divergence from the 10Y UST yield is hinting at stagflation. Historically, the 10-year US Treasury yield moves broadly correlated with the copper/gold ratio. What we have been seeing over the past two years is not your normal cycle. The 10-year UST yield has been surging despite the copper/gold ratio declining. 
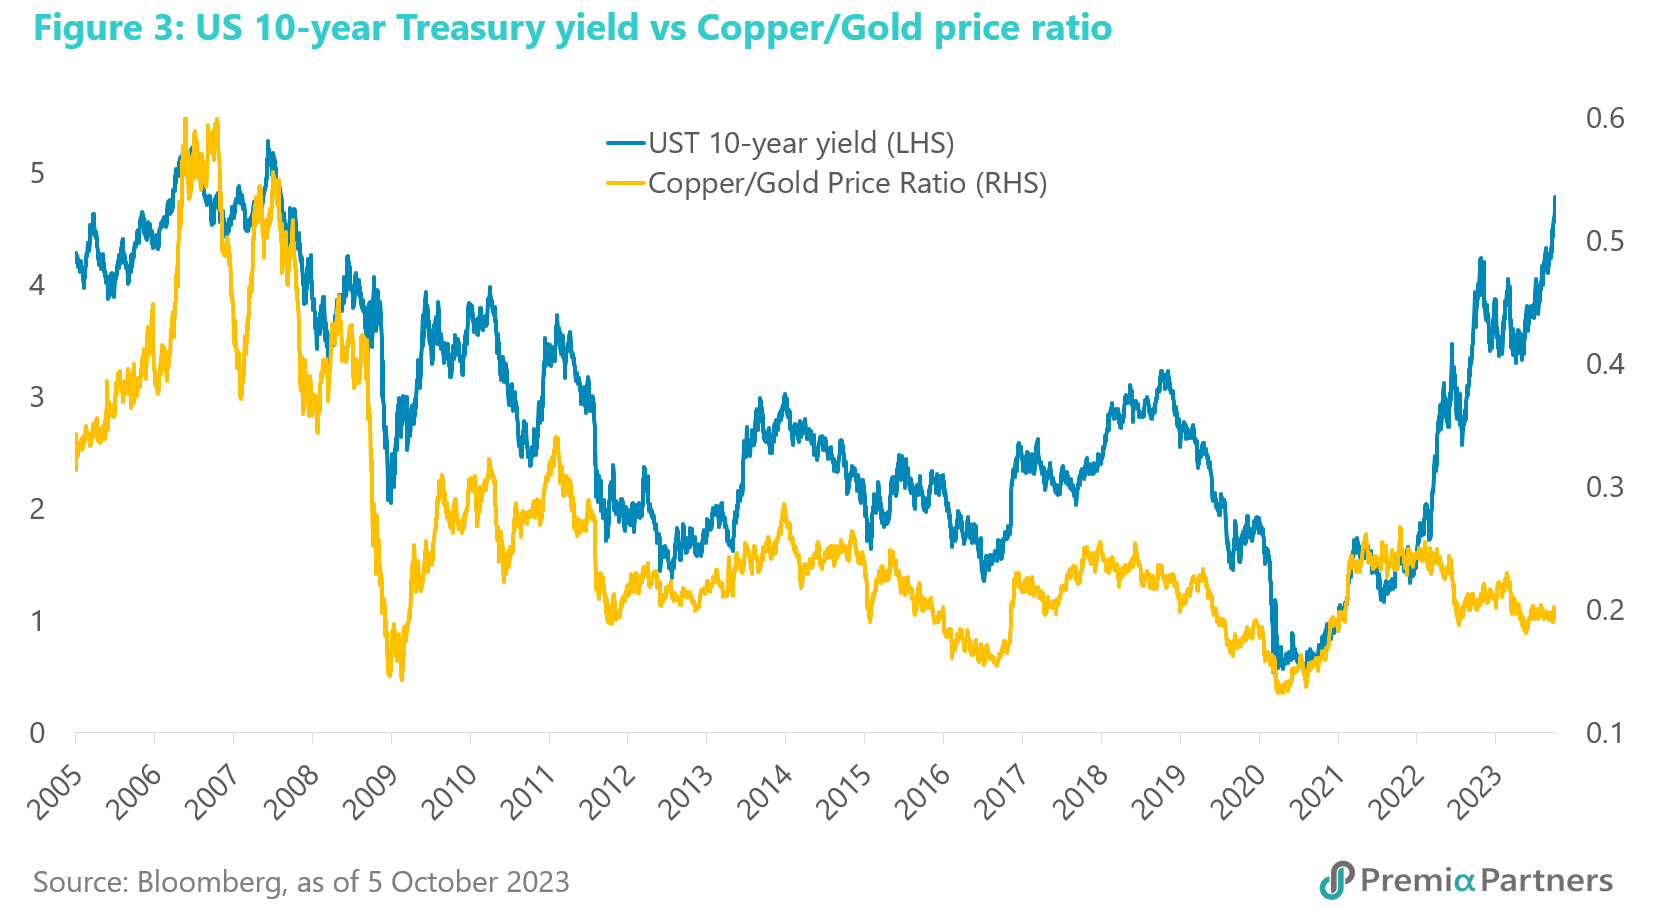
Copper is well known as an economic growth indicator. Gold, as Forbes tell us, tends to do well in recessions, outperforming the S&P 500 in six of the eight recessions between 1973 and 2020.  Therefore, the decline in the copper/gold ratio is consistent with a coming US recession. But then why isn’t the 10-year UST yield declining? We go back to our above point about the structural forces overriding the cyclical. That is, it is possible we could get painfully high UST yields despite a recession. It would be consistent with the future stagflation risk that we wrote about on our website back in 2021. That would be a nightmare for Wall Street.

A lot of stuff could “break” if funding costs keep going up – including US banks. If the structural factors are dominant, a cyclical economic downturn may not necessarily bring down funding costs. US bank stock prices never really recovered from the February-March 2023 mini-crisis. They have been trading sideways since then.

What lies beneath that is even more worrying. The Bank Term Funding Program (BTFP) has been expanding its liquidity support for US banks despite the supposed stability in the sector – from US$76 billion in early May to US$108 billion in early October. The argument that this rise in the BTFP may be caused by “opportunistic money management strategies” is unconvincing, given what S&P Global described as “the potential stigma” of using this programme, and the “exit” difficulties from loans from BTFP, given that collateral pledged at par are already “underwater” right at the outset.

We suspect the recent surge in US Treasury yields could trigger another round of instability in US banks, particularly smaller regional banks, through higher funding costs and the erosion of their capital through losses on their bond portfolios.

Indeed, despite all the negative press about China, the FTSE China A 600 Banks Index has been a whole lot more stable than the US KBW Bank Index. 
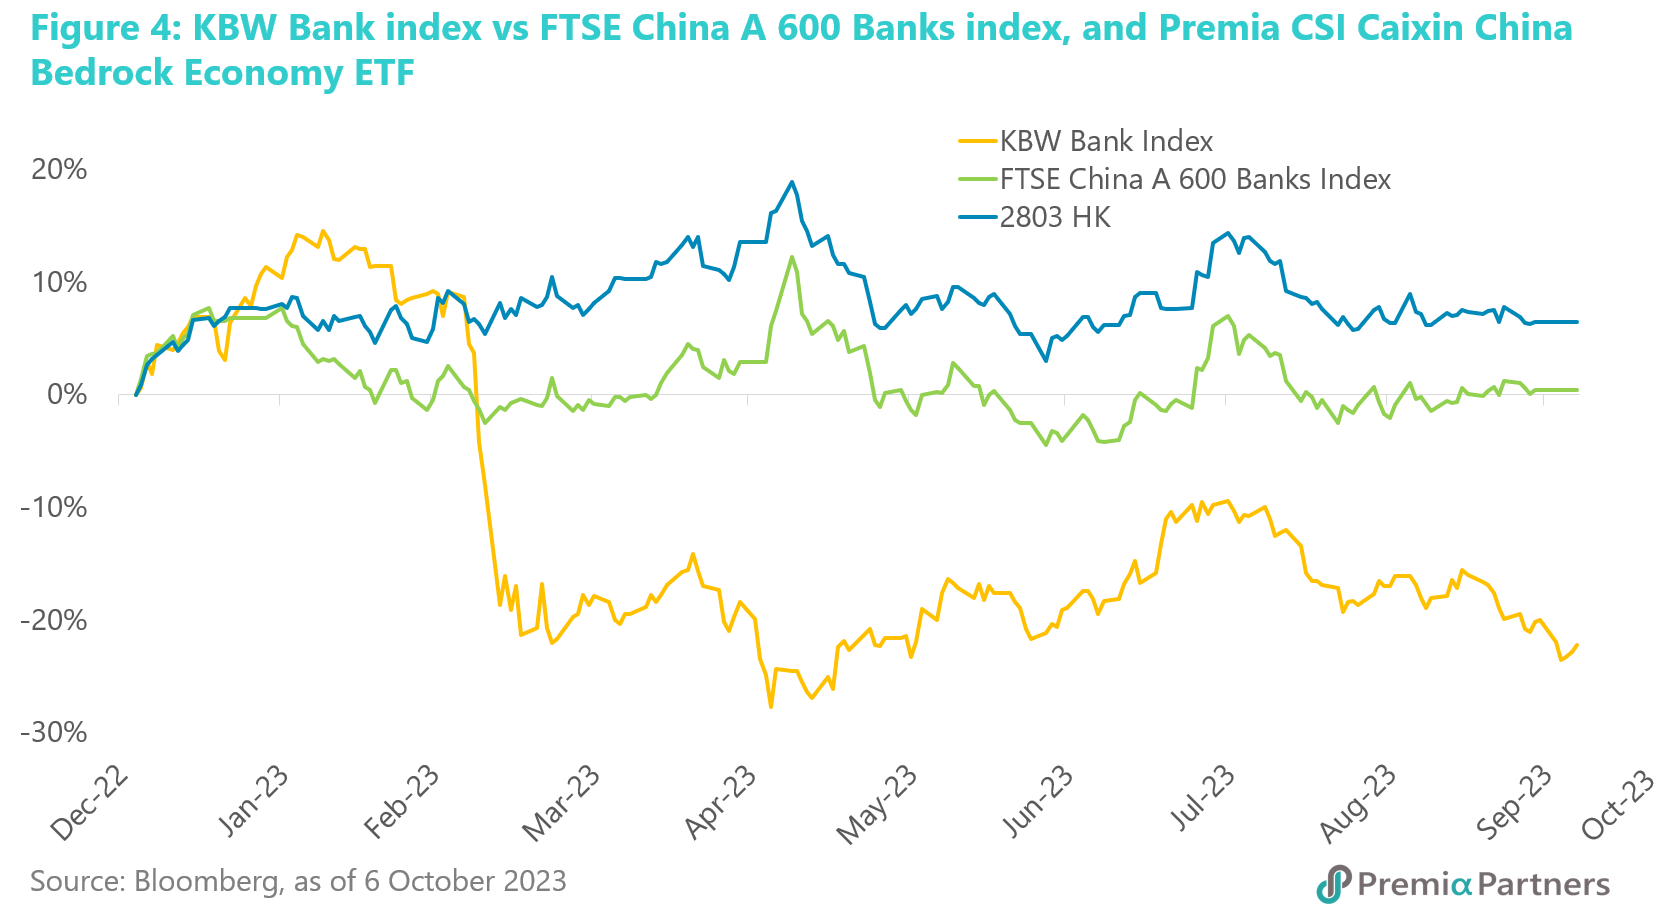
Note that Premia CSI Caixin China Bedrock Economy ETF (2803 HK) – which has approximately 36% exposure to financials – outperformed both the FTSE China A 600 Banks Index and the KBW Bank Index.

US bond market selloff vindicates China’s economic policy caution. The criticisms of China from Big Media – with strident demands for Chinese policy makers to fire the “big bazooka” of monetary expansion and fiscal largesse on government debt – should be seen in the context of the price that the US is now paying for its profligacy. While China Government Bonds have generally been mean-reverting around 100, US government bond indices have fallen off the metaphorical cliff.

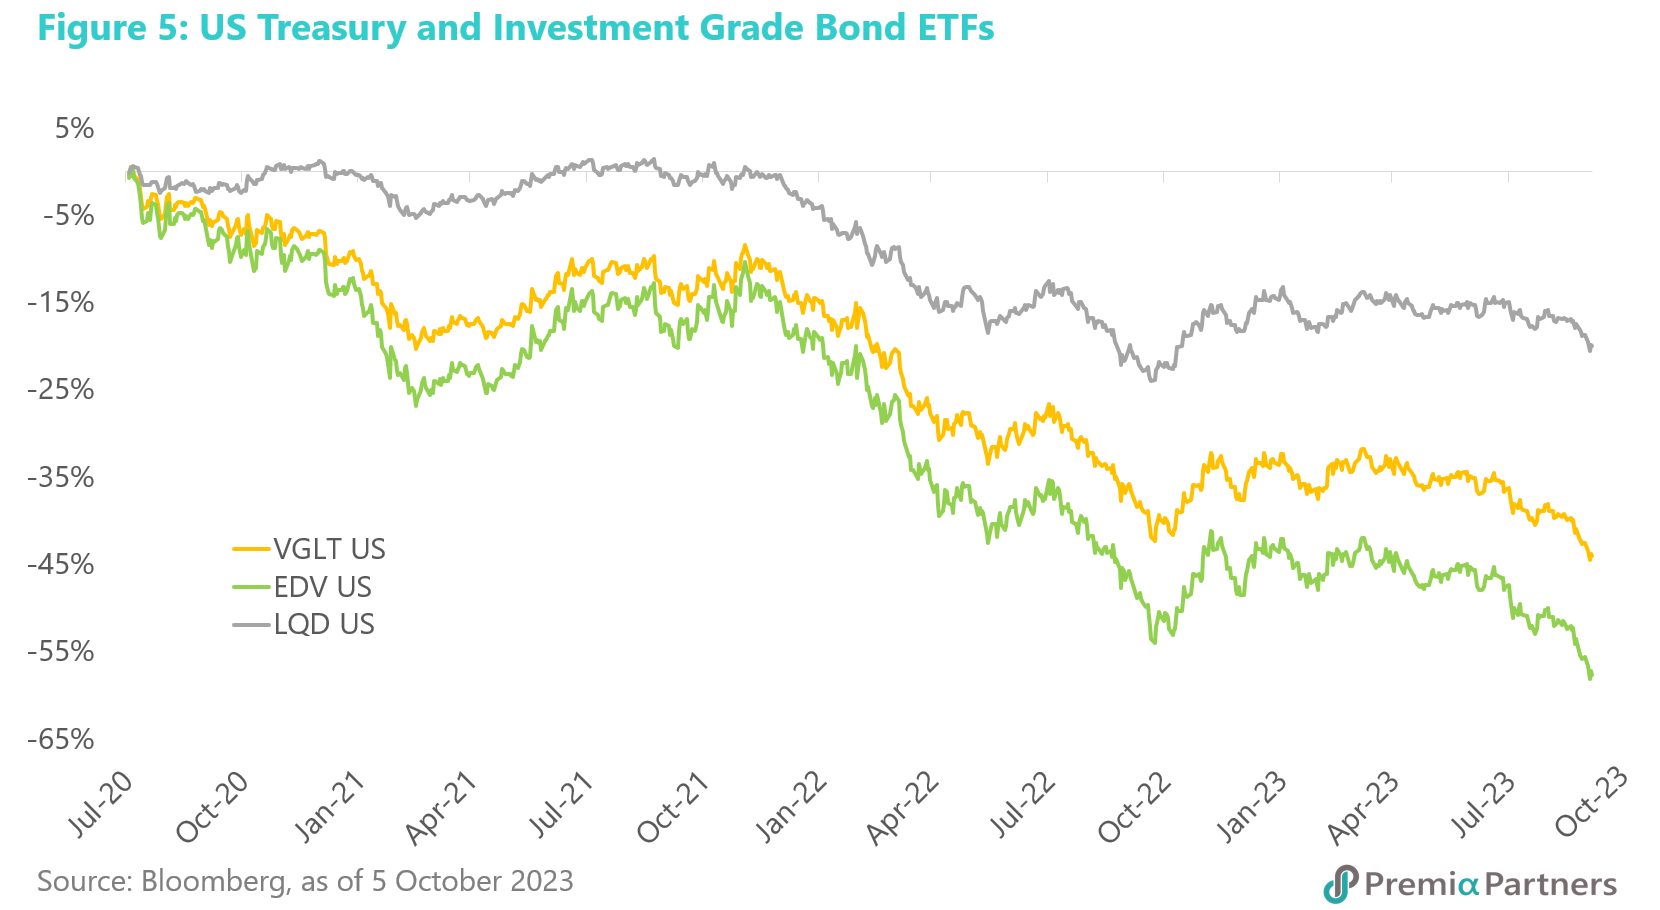
The losses are now spreading into corporate credits. The Vanguard Long Term Treasury ETF (VGLT) is down 49% from July 2020; the Vanguard Extended Duration Treasury ETF (EDV) is down 63%; and the iShares iBoxx $ Investment Grade Corporate Bond ETF (LQD) is down 28% over the same period.
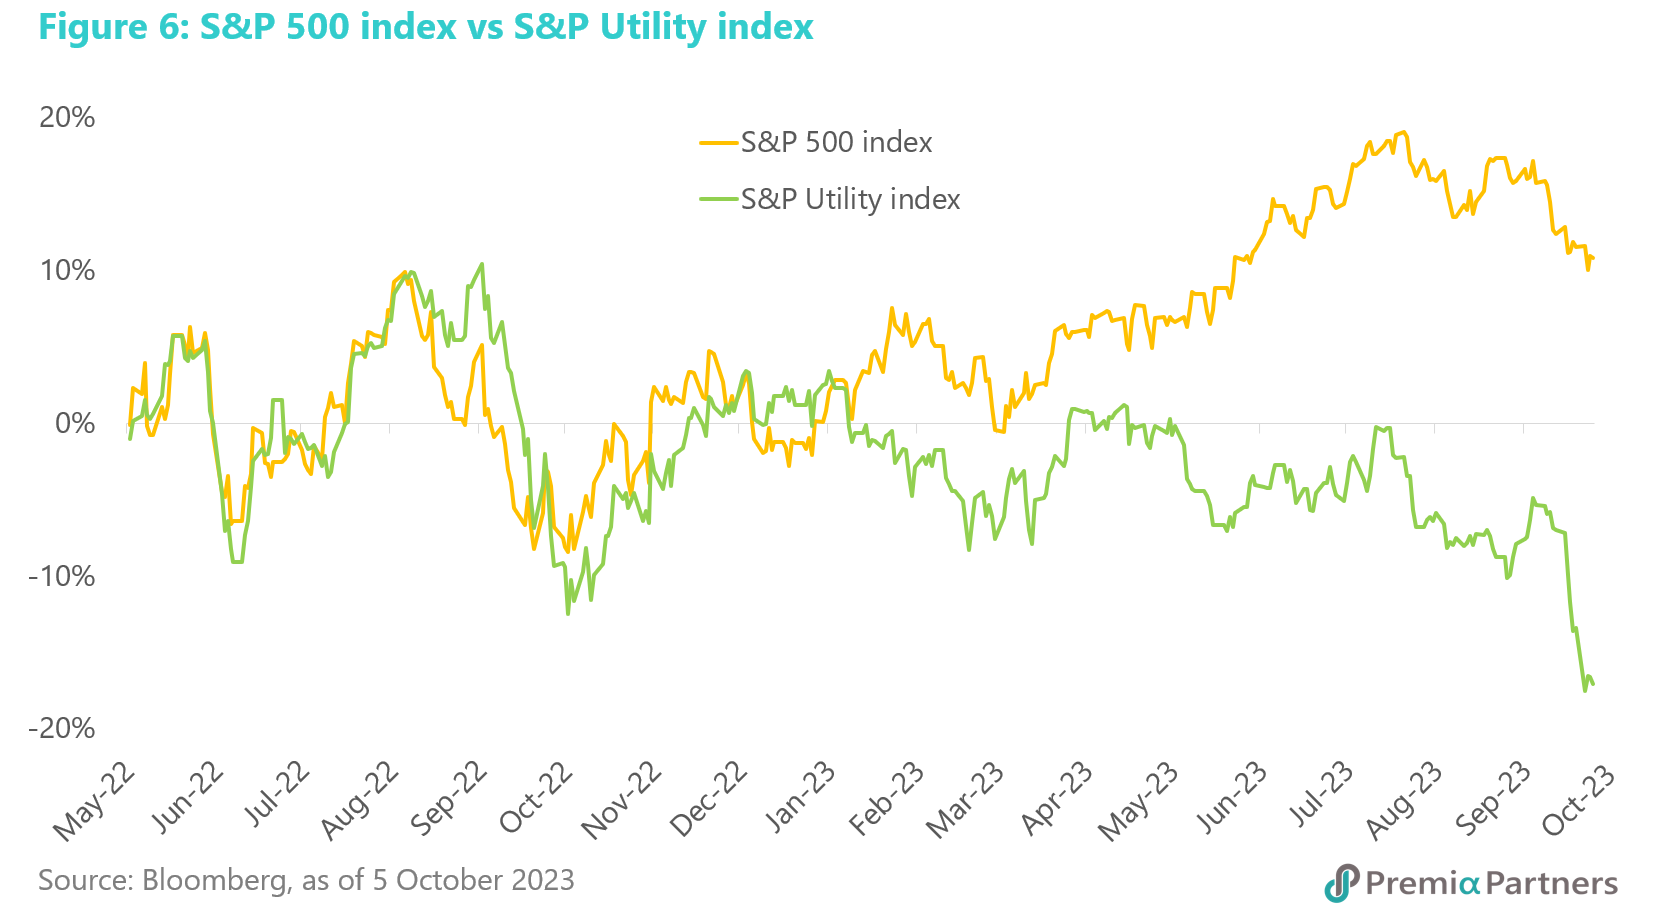
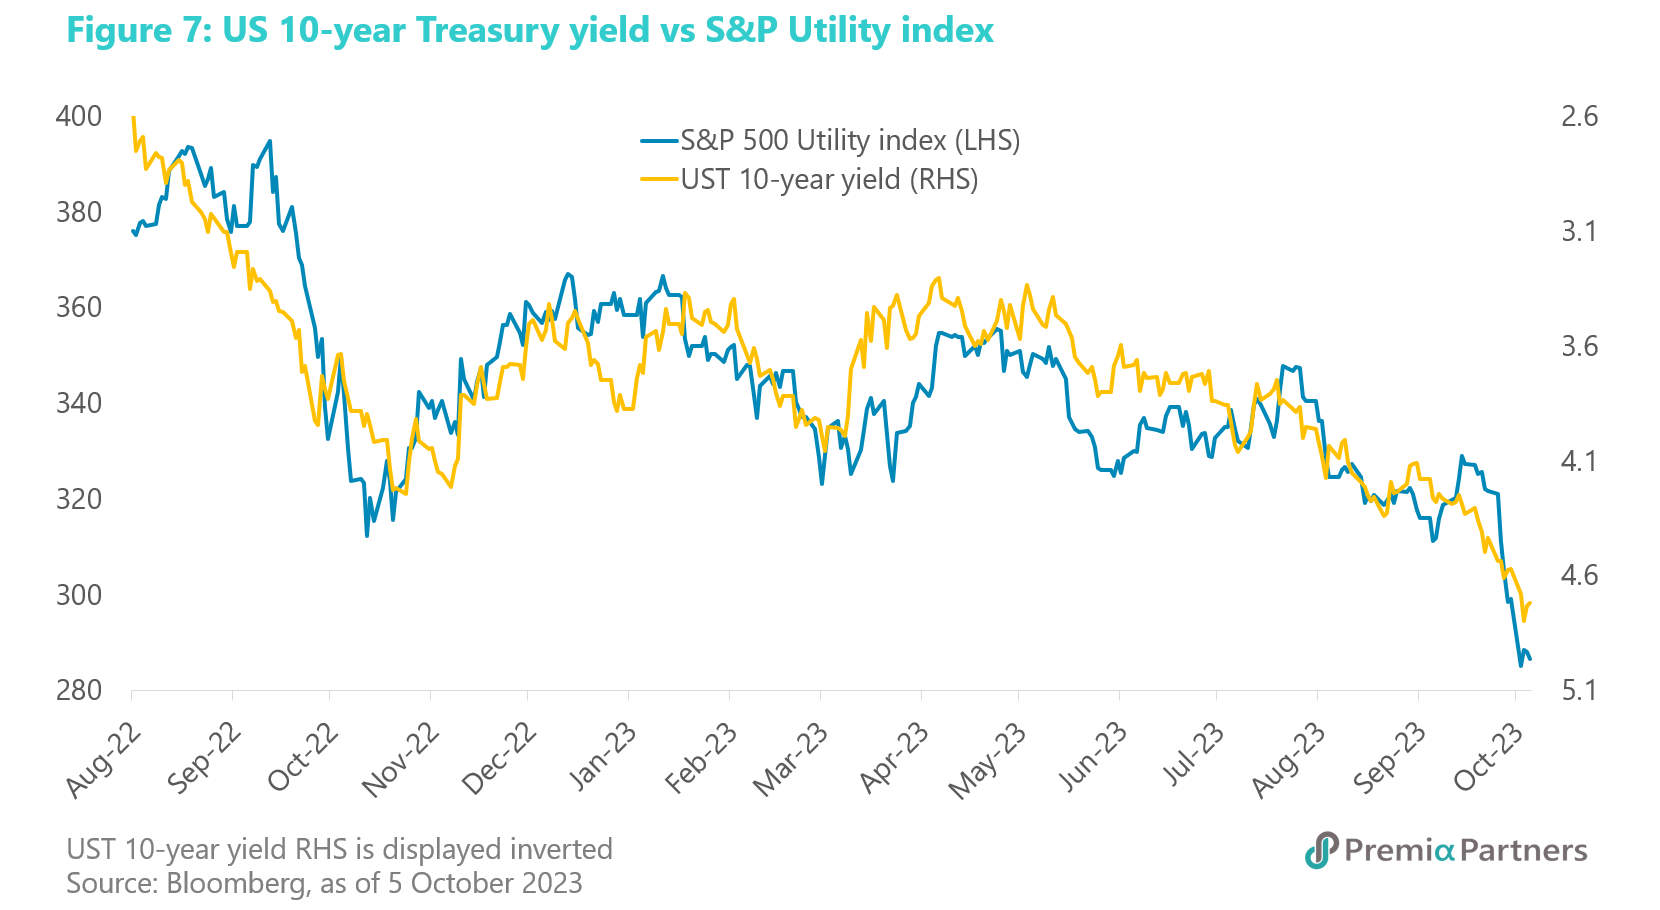
The vulnerability of the S&P 500. The S&P 500 has been on retreat since late July. Given the high rates/yields environment, this is likely to continue as a downtrend, notwithstanding intermittent technical rebounds. The divergence between the S&P 500 Utility Index and the S&P 500 speaks of the vulnerability of the rates-sensitive sectors. 
Tech stocks would normally be rates-sensitive as well, given their earnings duration risk (that is, given a large part of their valuations are driven by expected earnings further into the future than for non-tech stocks), but that inverse relationship between the 10-year UST yield and the Nasdaq 100 diverged quite spectacularly from May this year.

This is not normal. It is very likely attributable to the impact of “AI-mania”. That divergence – which we call the “AI-gap” – will likely close at a certain point of overvaluation. Apple is now at 30x forward PE; Alphabet is at 24x; Amazon is 57x; Meta 24x; Microsoft 30x; Nvidia 48x; Adobe 41x. So, they range from pricey to super pricey to (in the case of C3.ai) loss making. At some point, the higher discount rate flowing from the UST market will likely break US tech, too.

  • Simon Say Boon Lim
    Simon Say Boon Lim

    Senior Advisor

아래 번역 결과는 AliCloud의 기계번역 엔진에서 생성된 결과로, 단순 참조용으로만 사용하시기 바랍니다. 프리미아 파트너스는 본 내용의 정확성 또는 적절성에 대한 책임을 지지 않으며, 번역본과 영문 원본 사이에 불일치하는 내용이 있을 경우 영문 원본 내용이 우선합니다.

From “Goldilocks” to “Nightmare on Wall Street” – the convergence of structural and cyclical forces looks set to inflict a lot more damage on US assets. For some time now, we had been warning about the upside risks to US Treasury yields. That slow, upward creep in US Treasury yields recently turned into a rampage, with nasty implications for both US bonds and equities. Meanwhile structural factors are further feeding the rise in UST yields – more supply, less demand. In this article, our Senior Advisor Say Boon Lim discusses about the great refinancing pressure of US government debt looming, how a lot of stuff could “break” if funding costs keep going up – including US banks – and how things may play out if the structural factors are dominant, a cyclical economic downturn may not necessarily bring down funding costs.

From “Goldilocks” to “Nightmare on Wall Street” – the convergence of structural and cyclical forces looks set to inflict a lot more damage on US assets. For some time now, we had been warning about the upside risks to US Treasury yields. That slow, upward creep in US Treasury yields recently turned into a rampage, with nasty implications for both US bonds and equities. This rout is unlikely to end quickly. There are always rebounds in downtrends and consolidations in uptrends. But cyclical and structural factors are converging to drive both stock and bond prices lower.

  • The US labour market remains tight – this is inconsistent with the disinflation narrative.
  • Holdings of US government securities by the Fed, US commercial banks and foreigners are declining amidst a structural rise in US government debt and in the issuance of US Treasuries.
  • That combination of additional US Federal government debt issuance and lower demand has created – from the start of 2022 to October this year – an additional US$5.36 trillion of US government securities for the private US market to absorb. If the trend continues, we could see the 10-year UST yield above 5.0% next year. Indeed, we had previously noted that the historical spread between the Fed Funds effective rate and the 10-year US Treasury yield suggests a theoretical average 10-year yield of 6.3%.
  • Also, about half the US government’s fixed rate marketable debt matures between 2023 and 2025. That is another almost US$11 trillion to digest.
  • This is the inevitable price of profligacy. Media and finance industry commentators had been flaying China’s policy makers for not firing the metaphorical “Big Bazooka” of monetary expansion for debt-driven fiscal stimulus. Chinese policy makers’ caution has seen the value of China Government Bonds trade in a stable, sideways range around 100. The stark contrast is a collapse in the value of the US Treasury market, which Bank of America analysts have concluded is unprecedented in US history.
  • Meanwhile, the commodity markets are telling us that something in the US economy is going to break. The copper/gold ratio has been falling since mid-2022, while the 10-year yield has been rising. Normally, they move in tandem, and this is the nightmare scenario: The US economy goes into recession, but structural forces override the cyclical to keep UST yields painfully high – that is, a variant of stagflation.
  • US banks are at risk of a re-emergence of a liquidity or even solvency crisis if US Treasury yields keep rising. Note the very significant market underperformance of US banks versus Chinese banks.

The cyclical battle against inflation continues. Declarations of “the end” of this inflationary episode are premature. The decline in oil prices and the flow-on to lower US gasoline prices contributed much to the disinflation from middle of last year. The upturn in oil prices from the middle of this year, as a result of production cuts, has started to reverse the inflation data, on a m/m basis. The outbreak of war in the Middle East – between Israel and Hamas – threatens resumption of that oil price rally. Speculation that Saudi Arabia might lift oil production and normalise relations with Israel in exchange for defense cooperation with the US had contributed to a decline in oil prices in early October. That is less likely now. 

Meanwhile, the tightness of the US labour market suggests an uptick in headline (all-items) inflation could spill over into core (ex-food and energy) inflation through wage inflation. Typically, where headline inflation goes, core inflation follows, and at this time, the tight labour market makes it all the more likely that workers, under cost-of-living pressures, will get their demands for higher wages.

Structural factors further feeding the rise in UST yields – more supply, less demand.  There are two drivers for the ongoing surge in US Treasury yields. One is inflation and the related Fed rates fears. The other is falling demand for US government securities at a time of surging supply. The former – inflation and rates – could be argued away as “cyclical”. But the latter – demand for and supply of US government securities – is structural.

At the heart of this is the surge in US government spending and debt since the start of the pandemic, which has driven a sharp rise in US government debt from US$23.2 trillion at the start of 2020 to US$33.5 trillion currently. Yet, the Federal Reserve has been running down its holdings of US Treasuries and Agency debt; commercial banks are holding less US Treasury and Agency securities; and the total foreign holdings of US Treasuries has been stagnant.

From the start of 2022 to October this year, the total US public debt outstanding has risen US$3.9 trillion ($29.6 trillion to $33.5 trillion). Yet, we estimate that the combined holdings of US Treasuries and Agency debt by the Fed, US commercial banks and foreigners have fallen around US$1.46 trillion. (Note that the latest foreign holdings data is for July, but given the general trend since January 2022, it would seem reasonable to assume continuation of that sideways drift in the total holdings.)

So that means over that period there was an additional US$5.36 trillion for the rest of the market (ex-Fed, US commercial banks and foreigners) to absorb. 

For context, that is almost six years of incremental US federal government debt held by the public, averaged over the ten years (2009 to 2019) before the pandemic. That was a lot to absorb by a combination of private US investors (funds and individual investors) and US state/local governments. If it keeps heading in this direction, we should not be surprised to see the 10-year yield above 5.0% next year.

Structural factors further feeding the rise in UST yields – the Great Refinancing of Government Debt. The Federal Reserve Bank of St Louis published a paper in June which broke down the percentage of the Government’s “fixed rate marketable US Dollar debt” (FRMUSD) that is maturing and in need of refinancing in coming years. Stripping out the non-marketable and variable rate debt, the FRMUSD base is US$21.4 trillion. According to the paper, 51% of that debt matures between 2023 and 2025. That is US$10.9 trillion. Even worse, this figure does not take into account the short-term (1-year) securities yet to be issued, and that could be significant: This refinancing requirement this year was estimated at around US$6.4 trillion. Around US$3.5 trillion to US$3.6 trillion – more than half – is from 1-year debt. These figures are conservative because they were compiled from end-2022 data. So, they would not have captured short-term debt issued in 2023.

The market is now starting to talk about a 6.0% 10-year yield. Media and financial commentators have started saying over the past few weeks that a 6.0% 10-year UST yield is a possibility.

We will only repeat what we wrote in our weekly email newsletter back in August – that 6.3% for the 10-year yield is a historical average given where the Fed Funds effective rate is.

We wrote then that “going back six decades, the average spread between the 10-year UST yield and the Fed Funds Rate is around 100 basis points.” The Fed Funds Effective Rate was then 5.33% and coincidentally, it is still at 5.33% currently. So, add the historical average spread and you have 6.3%. But we also said: “This is not to suggest that the historical average has to suddenly assert itself. It is to suggest that the balance of risk for US Treasury yields continues to be on the upside.”

Copper/gold ratio divergence from the 10Y UST yield is hinting at stagflation. Historically, the 10-year US Treasury yield moves broadly correlated with the copper/gold ratio. What we have been seeing over the past two years is not your normal cycle. The 10-year UST yield has been surging despite the copper/gold ratio declining. 

Copper is well known as an economic growth indicator. Gold, as Forbes tell us, tends to do well in recessions, outperforming the S&P 500 in six of the eight recessions between 1973 and 2020.  Therefore, the decline in the copper/gold ratio is consistent with a coming US recession. But then why isn’t the 10-year UST yield declining? We go back to our above point about the structural forces overriding the cyclical. That is, it is possible we could get painfully high UST yields despite a recession. It would be consistent with the future stagflation risk that we wrote about on our website back in 2021. That would be a nightmare for Wall Street.

A lot of stuff could “break” if funding costs keep going up – including US banks. If the structural factors are dominant, a cyclical economic downturn may not necessarily bring down funding costs. US bank stock prices never really recovered from the February-March 2023 mini-crisis. They have been trading sideways since then.

What lies beneath that is even more worrying. The Bank Term Funding Program (BTFP) has been expanding its liquidity support for US banks despite the supposed stability in the sector – from US$76 billion in early May to US$108 billion in early October. The argument that this rise in the BTFP may be caused by “opportunistic money management strategies” is unconvincing, given what S&P Global described as “the potential stigma” of using this programme, and the “exit” difficulties from loans from BTFP, given that collateral pledged at par are already “underwater” right at the outset.

We suspect the recent surge in US Treasury yields could trigger another round of instability in US banks, particularly smaller regional banks, through higher funding costs and the erosion of their capital through losses on their bond portfolios.

Indeed, despite all the negative press about China, the FTSE China A 600 Banks Index has been a whole lot more stable than the US KBW Bank Index. 

Note that Premia CSI Caixin China Bedrock Economy ETF (2803 HK) – which has approximately 36% exposure to financials – outperformed both the FTSE China A 600 Banks Index and the KBW Bank Index.

US bond market selloff vindicates China’s economic policy caution. The criticisms of China from Big Media – with strident demands for Chinese policy makers to fire the “big bazooka” of monetary expansion and fiscal largesse on government debt – should be seen in the context of the price that the US is now paying for its profligacy. While China Government Bonds have generally been mean-reverting around 100, US government bond indices have fallen off the metaphorical cliff.

The losses are now spreading into corporate credits. The Vanguard Long Term Treasury ETF (VGLT) is down 49% from July 2020; the Vanguard Extended Duration Treasury ETF (EDV) is down 63%; and the iShares iBoxx $ Investment Grade Corporate Bond ETF (LQD) is down 28% over the same period.

The vulnerability of the S&P 500. The S&P 500 has been on retreat since late July. Given the high rates/yields environment, this is likely to continue as a downtrend, notwithstanding intermittent technical rebounds. The divergence between the S&P 500 Utility Index and the S&P 500 speaks of the vulnerability of the rates-sensitive sectors. 
Tech stocks would normally be rates-sensitive as well, given their earnings duration risk (that is, given a large part of their valuations are driven by expected earnings further into the future than for non-tech stocks), but that inverse relationship between the 10-year UST yield and the Nasdaq 100 diverged quite spectacularly from May this year.
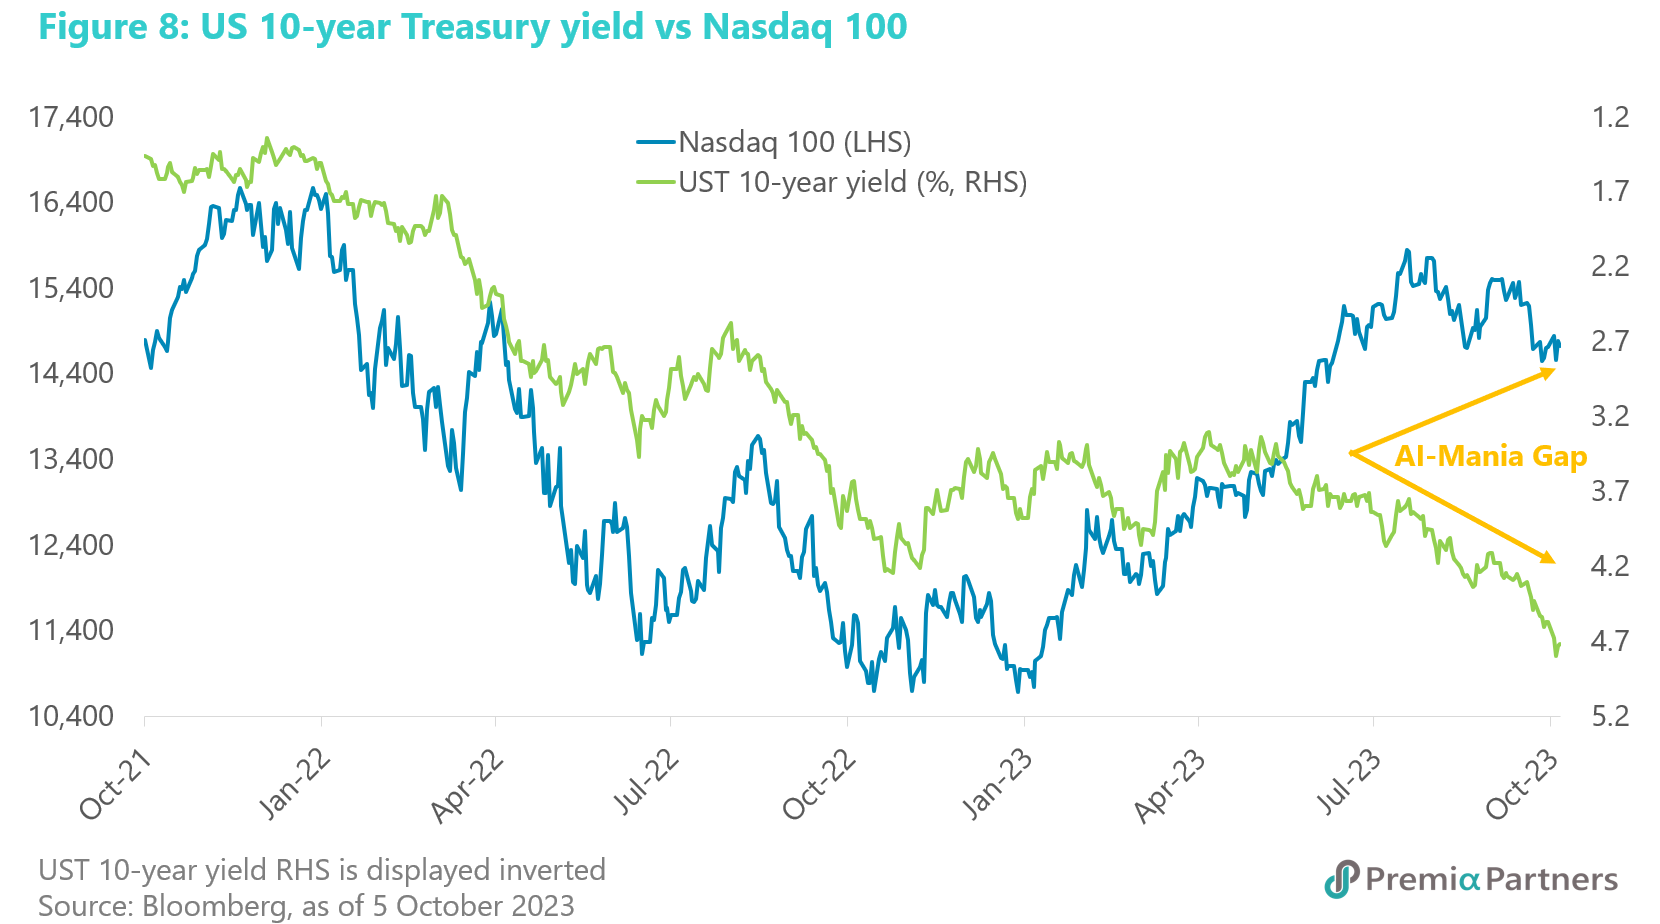
This is not normal. It is very likely attributable to the impact of “AI-mania”. That divergence – which we call the “AI-gap” – will likely close at a certain point of overvaluation. Apple is now at 30x forward PE; Alphabet is at 24x; Amazon is 57x; Meta 24x; Microsoft 30x; Nvidia 48x; Adobe 41x. So, they range from pricey to super pricey to (in the case of C3.ai) loss making. At some point, the higher discount rate flowing from the UST market will likely break US tech, too.