premia-parnters logo
Chinese equities may not need more stimulus
2021. 3. 31.

아래 번역 결과는 AliCloud의 기계번역 엔진에서 생성된 결과로, 단순 참조용으로만 사용하시기 바랍니다. 프리미아 파트너스는 본 내용의 정확성 또는 적절성에 대한 책임을 지지 않으며, 번역본과 영문 원본 사이에 불일치하는 내용이 있을 경우 영문 원본 내용이 우선합니다.

A popular media narrative for the recent correction in Chinese equities was that it was caused by tightening of financial conditions in China.

A popular media narrative for the recent correction in Chinese equities was that it was caused by tightening of financial conditions in China.

But there may be another – simpler – explanation for the correction that started mid-February: It was simply technically overbought after the pre-Chinese New Year rally that took the CSI 300 up 12% in just nine trading sessions – from start-February to February 18.  It seems more than coincidental that the CSI 300 peaked the day the markets reopened after the Lunar New Year holidays. This sort of pre-Chinese New Year rally and subsequent correction had been seen in past years. Not in all years, but it has happened enough to not be surprising.

Why waste policy ammunition with ultra-stimulus when Developed Market economies are already doing it? 

After the Global Financial Crisis, China was criticized for its rapid expansion of total social financing – with many economists and media commentators predicting a coming “Minsky Moment”, that is, a financial/debt implosion, which anyway never happened. Now the shoe is on the other foot.

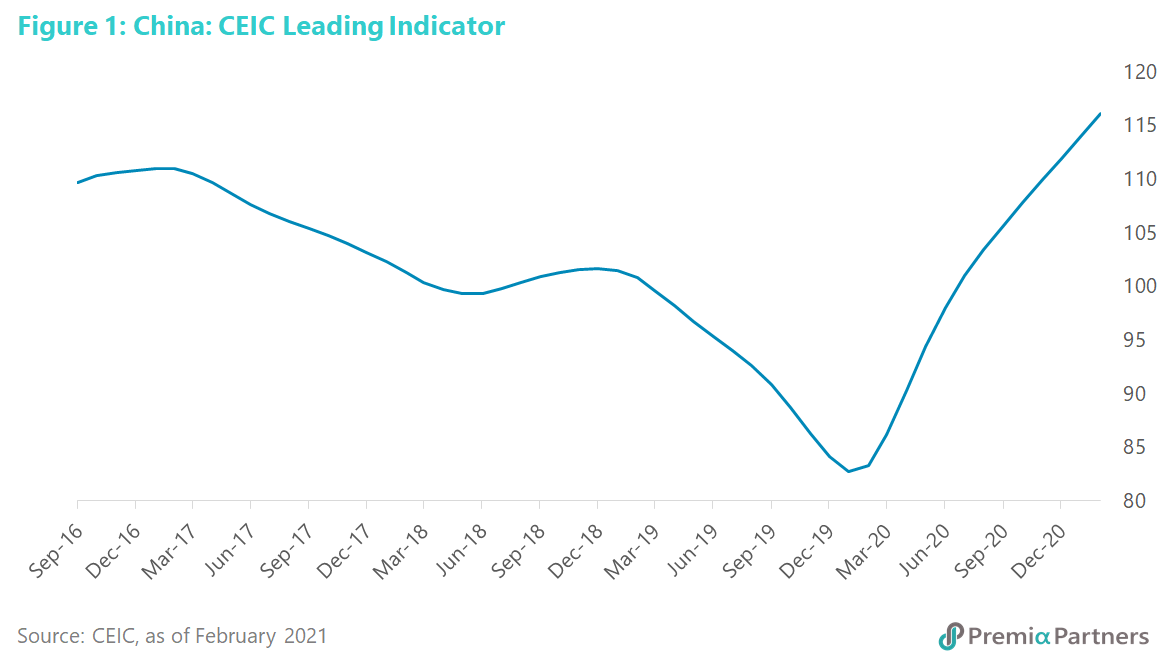
With the US spending so much, external demand – combined with the early reopening of Chinese manufacturing – more than offset the loss of domestic consumption in the midst of the pandemic. The rest is history – China was the only major economy to grow in 2020. It will likely be the best performing economy in 2021 again. The CEIC China Leading Indicator confirms the strong upward momentum for this year (figure 1).  Bottom line: It doesn’t need the stimulus.
Stimulus may not be helpful for Chinese equities anyway.

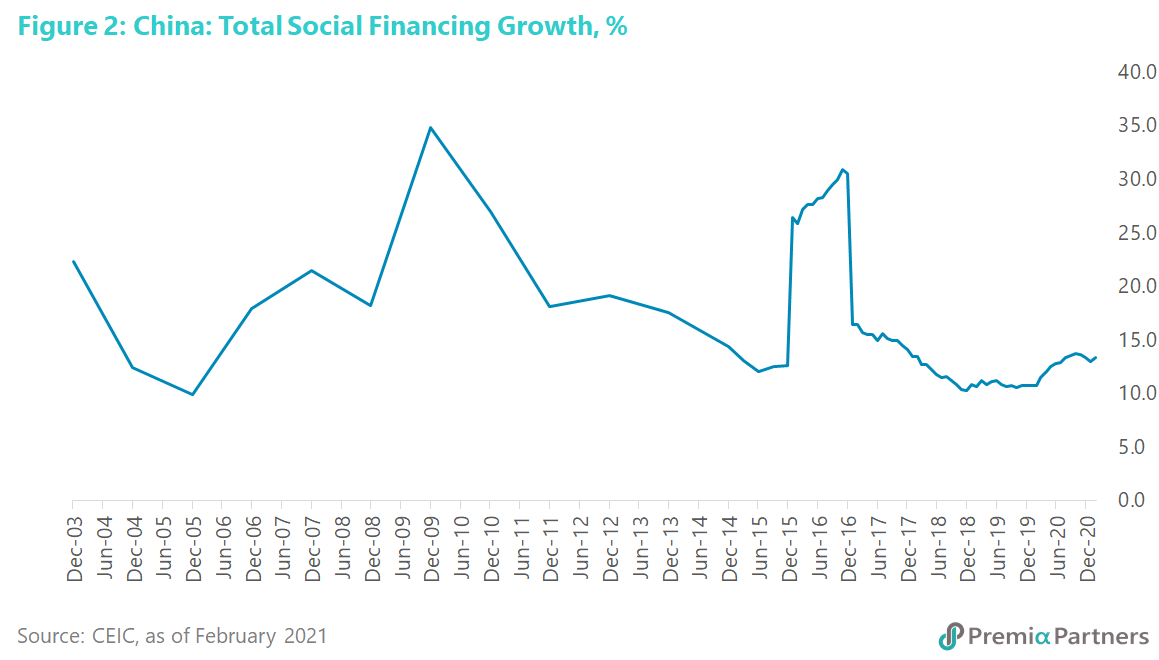
There is no discernible long-term relationship between credit growth in China and the performance of the stock market. Periods of rising total private, non-financial sector credit growth or even total social financing did not necessarily result in stronger stock market prices. For example, during the spike in total social financial growth from mid-2015 to end-2016 (figure 2), the Shanghai Composite Index fell some 30%. Indeed, one of the narratives driving the Chinese equities crash of June-2015 to February-2016 was that the Chinese economy’s rapid credit growth was putting it in danger of financial implosion.
Valuations are still reasonable by international standards.

China’s CSI 300 index is now trading on a forward PE of 14x its 2021 earnings. The S&P 500 by comparison is trading on 23x its 2021 earnings.  Given how they both have roughly the same earnings per share growth rate for the current year (37% for the CSI 300 and 40% for S&P 500), the PEG – or the PE to growth ratio – is more attractive for China than in the US. 0.38x for the CSI 300 versus 0.57x for the S&P 500.

  • Simon Say Boon Lim
    Simon Say Boon Lim

    Senior Advisor

아래 번역 결과는 AliCloud의 기계번역 엔진에서 생성된 결과로, 단순 참조용으로만 사용하시기 바랍니다. 프리미아 파트너스는 본 내용의 정확성 또는 적절성에 대한 책임을 지지 않으며, 번역본과 영문 원본 사이에 불일치하는 내용이 있을 경우 영문 원본 내용이 우선합니다.

A popular media narrative for the recent correction in Chinese equities was that it was caused by tightening of financial conditions in China.

A popular media narrative for the recent correction in Chinese equities was that it was caused by tightening of financial conditions in China.

But there may be another – simpler – explanation for the correction that started mid-February: It was simply technically overbought after the pre-Chinese New Year rally that took the CSI 300 up 12% in just nine trading sessions – from start-February to February 18.  It seems more than coincidental that the CSI 300 peaked the day the markets reopened after the Lunar New Year holidays. This sort of pre-Chinese New Year rally and subsequent correction had been seen in past years. Not in all years, but it has happened enough to not be surprising.

Why waste policy ammunition with ultra-stimulus when Developed Market economies are already doing it? 

After the Global Financial Crisis, China was criticized for its rapid expansion of total social financing – with many economists and media commentators predicting a coming “Minsky Moment”, that is, a financial/debt implosion, which anyway never happened. Now the shoe is on the other foot.

With the US spending so much, external demand – combined with the early reopening of Chinese manufacturing – more than offset the loss of domestic consumption in the midst of the pandemic. The rest is history – China was the only major economy to grow in 2020. It will likely be the best performing economy in 2021 again. The CEIC China Leading Indicator confirms the strong upward momentum for this year (figure 1).  Bottom line: It doesn’t need the stimulus.

Stimulus may not be helpful for Chinese equities anyway.

There is no discernible long-term relationship between credit growth in China and the performance of the stock market. Periods of rising total private, non-financial sector credit growth or even total social financing did not necessarily result in stronger stock market prices. For example, during the spike in total social financial growth from mid-2015 to end-2016 (figure 2), the Shanghai Composite Index fell some 30%. Indeed, one of the narratives driving the Chinese equities crash of June-2015 to February-2016 was that the Chinese economy’s rapid credit growth was putting it in danger of financial implosion.

Valuations are still reasonable by international standards.

China’s CSI 300 index is now trading on a forward PE of 14x its 2021 earnings. The S&P 500 by comparison is trading on 23x its 2021 earnings.  Given how they both have roughly the same earnings per share growth rate for the current year (37% for the CSI 300 and 40% for S&P 500), the PEG – or the PE to growth ratio – is more attractive for China than in the US. 0.38x for the CSI 300 versus 0.57x for the S&P 500.