
Divergence between prices and fundamentals continues
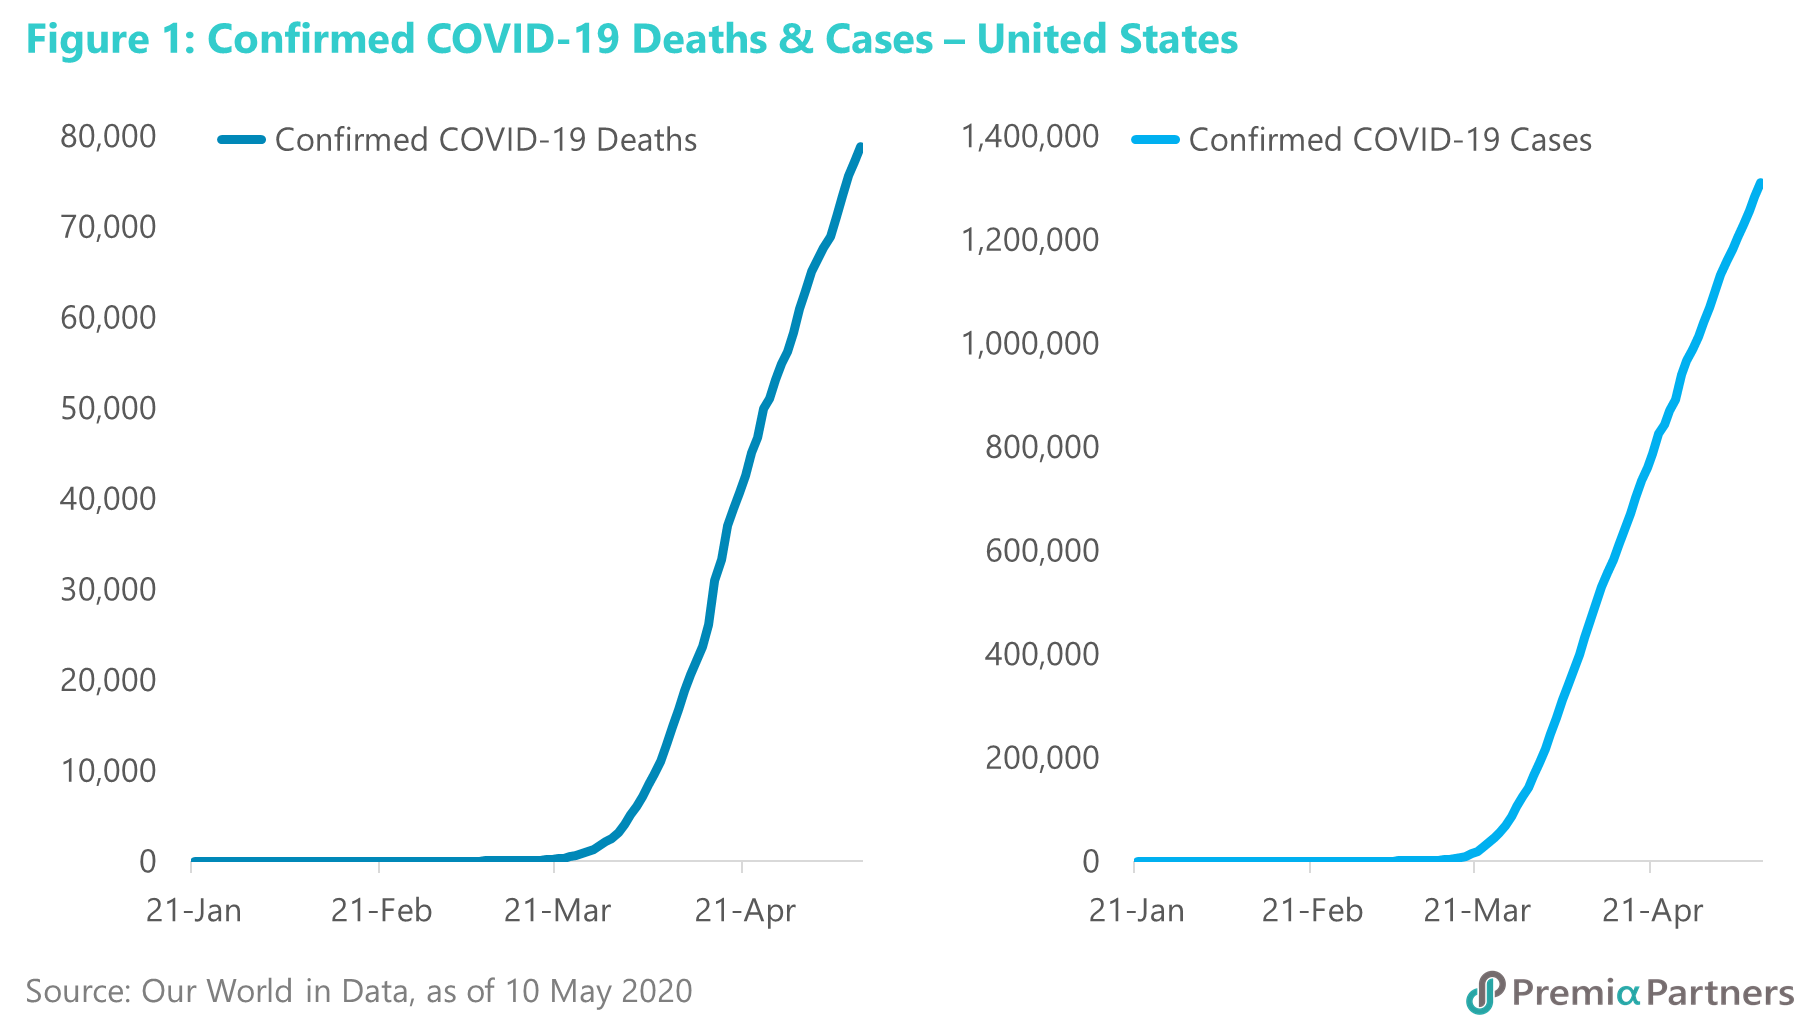
The S&P 500 picked up another 4% last week, taking its total gains from 3 March to 28%. But last week (3 May-9 May) also saw another 10,795 deaths from COVID-19 in the United States. The curves for deaths and infections from the virus remain very steep. (Figure 1)
Last week, the US also reported 14.7% unemployment for April, a level last seen during the Great Depression. (Unemployment during the Great Depression peaked at 25%.)
S&P 500 is trying to break above the 61.8% Fibonacci retracement. The index is now re-testing the 61.8% Fibonacci retracement of the entire fall from 20 February to 23 March. As we have said before, it is not unusual for bear markets to stage 50% retracements or even 61.8% retracements of large and steep falls. But it is unusual for it to make larger retracements. We should never rule it out. As John Maynard Keynes famously said, we are not the judges of the beauty contest. Nor we are even guessing how the judges are going to vote. As he put it: “We have reached the third degree where we devote our intelligences to anticipating what average opinion expects the average opinion to be.”
Previous pandemic rallies have been off lows – this is off an 11-year high. We have said this ourselves, that markets look past human tragedies. But past pandemics which saw markets rise came off market lows – e.g. SARS off the Nasdaq Crash lows, H1N1 off the global financial crisis lows, the Spanish Flu came off World War 1 lows. Previous pandemic rallies have been off lows – this is off an 11-year high. We have said this ourselves, that markets look past human tragedies. But past pandemics which saw markets rise came off market lows – e.g. SARS off the Nasdaq Crash lows, H1N1 off the global financial crisis lows, the Spanish Flu came off World War 1 lows.
Market may be thinking this will end quickly. And this has been the assumption underlying the thinking of international agencies such as the IMF. That is, COVID-19 will be brought under control by 3Q20, allowing for a sharp economic rebound to start 4Q20. And indeed, there was news last week quoting Australian Nobel prize winning immunologist Professor Peter Doherty saying that a British vaccine could be ready by September.
Professor Doherty appears to be referring to Oxford University trials. A report in the UK “Telegraph” newspaper on Sunday 10 May said “several hundred Britons” have been given an experimental jab. The University’s website says results could be ready – depending on the transmission rates – from late June to October.
However, an ABC News (US) report referred to this as “Phase 1” tests. And Oxford University’s own Vaccine Knowledge Project website refers to “Phase 2” and eventually “Phase 3” trials involving “several thousand” participants. Then there would have to be “licensing” reviews by regulators. Beyond that, there is the challenge of mass production for global use. So, assuming everything goes well, and with regulators and manufacturers acting with great urgency, we suspect the earliest this could be available for mass vaccinations would be 1Q21.
What would one year of massive economic damage inflict on stock earnings? If successful, the Oxford University vaccine could bring forward the previous best estimates of a vaccine (mid-2021) by a few months. But that would still see massive damage inflicted on economies, household wealth, corporate balance sheets and national finances. We had previously pointed out that S&P 500 earnings fell by 40% during the global financial crisis. It is also worth noting S&P 500 earnings fell 30% during the Nasdaq Crash.
If we see a 40% decline in index earnings again, by end of this year, at the current price levels, the S&P 500 would be trading on over 30x trailing earnings. Okay, the market may choose to look past that too, towards end-2021 earnings per share. In 2009, S&P 500 earnings rebounded 14%. Assuming we get the same rebound, the trailing PE on year-end 2021 earnings would still be 27x. This looks a lot like a bubble driven by the Fed cutting its policy rate and buying down UST yields.
COVID-19 likely to accelerate China’s GDP growth advantage over the US
The different approaches taken by the US and China towards managing COVID-19 has likely set the stage for a widening of the growth differential between the two countries. Immediately, the earlier reopening of the Chinese economy means China’s GDP will still show a bit of growth this year. This compares to the controversial, tentative easing of restrictions in the US, only in May. Even if the US gradually normalizes from here, its GDP for will end 2020 with a big hole, which will take three to four years to fill.
Longer-term, the US focus on massive fiscal expansion for “misery alleviation”, without containing the virus, will lumber the country with a debt to GDP ratio that could exceed that of China, and risk further shutdowns that could damage growth even in 2021. And while China is looking at capital spending focused on building “new infrastructure”, US corporations will likely cut back on investment even after COVID-19 as they digest their higher debt levels. This will lower further the US’ already declining productivity growth rate.
Estimates of the time when China’s GDP (in US Dollar terms) overtakes the US ranges around the early to mid-2030s. But our “back of the envelope calculations” suggest that, as a result of the different policy approaches to COVID-19, China could bring forward the time its GDP exceeds that of the US by a few years, possibly before 2030.
US long-term growth potential has been declining anyway before COVID-19 because of declining labour force and productivity growth. US real GDP growth had been declining over the decades. In the period from year 2000, its GDP had been growing at a compound annual rate of around 1.9%.
US labour force growth has been declining over the decades, from 1.1% in the period 1998-2008 to 0.5% in 2008-2018. Meanwhile, the US Bureau of Labor Statistics has forecast 0.5% as the average rate for the next decade from 2018-2028. The second part of the “back of the envelope calculation” is US labor productivity, which has been growing at an average of 1.4% p.a. since 2007. The sum of the two is 1.9% - that is the long-term growth potential of the US economy.
China’s productivity growth likely to support GDP growth despite a declining labour force. In China, the total labour force will decline in coming years. The labour force may have peaked at around 787.4 million in 2017, and has been declining marginally at around 0.2%-0.3% per year since then. But that decline will be borne mostly in the rural areas. What will drive economic growth in the coming decade will be the much higher productivity work force in the urban areas.
According to HK/UK based Global Demographics Ltd, in urban areas, “because of the current age profile as well as on going rural to urban migration, the total employed labour force will continue to increase”, from 398 million 2018 to 467 million in 2027 and 485 million by 2037. If that is correct, we could be looking at 1.8% compound annual growth in the urban workforce in China over the next decade or so. But for the purposes of this exercise, we note the studies that argue China has reached its so-called “Lewis Turning Point” in rural-urban migration, and take the conservative assumption of 0.2% labour force decline per year over coming years.
But China’s labour productivity growth has been running at an average of around 6.6% over the past five years. If China maintains that productivity growth rate, the sum of the labour force and productivity growth would be around 6.4%.
(Note: China recorded 6.1% GDP growth in 2019. And before COVID-19, the World Bank had forecast an average of around 5.8% growth over the three years from 2020-2022.)
COVID-19 is likely to do more damage to long-term US GDP growth than to China because of the different policy approaches to spread suppression and economic stimulus. If the IMF is right, COVID-19 will take the US GDP back to somewhere between 2017-2018 level in nominal USD terms. Meanwhile, China’s GDP will edge a bit higher for the full year 2020, because of its more rapid normalisation.
Much can be traced to the different policy approaches to handling the pandemic. China has focused on aggressive suppression of the spread through “lockdowns”. Its spending has targeted infrastructure – including “new infrastructure” such as 5G, big data centres, and high-speed rail.
The US, on the other hand, has thrown a massive amount fiscal stimulus at misery alleviation, but has not been anywhere near as effective in spread suppression. Indeed, it is already opening up while the infection rate curve is still steep. Three consequences:
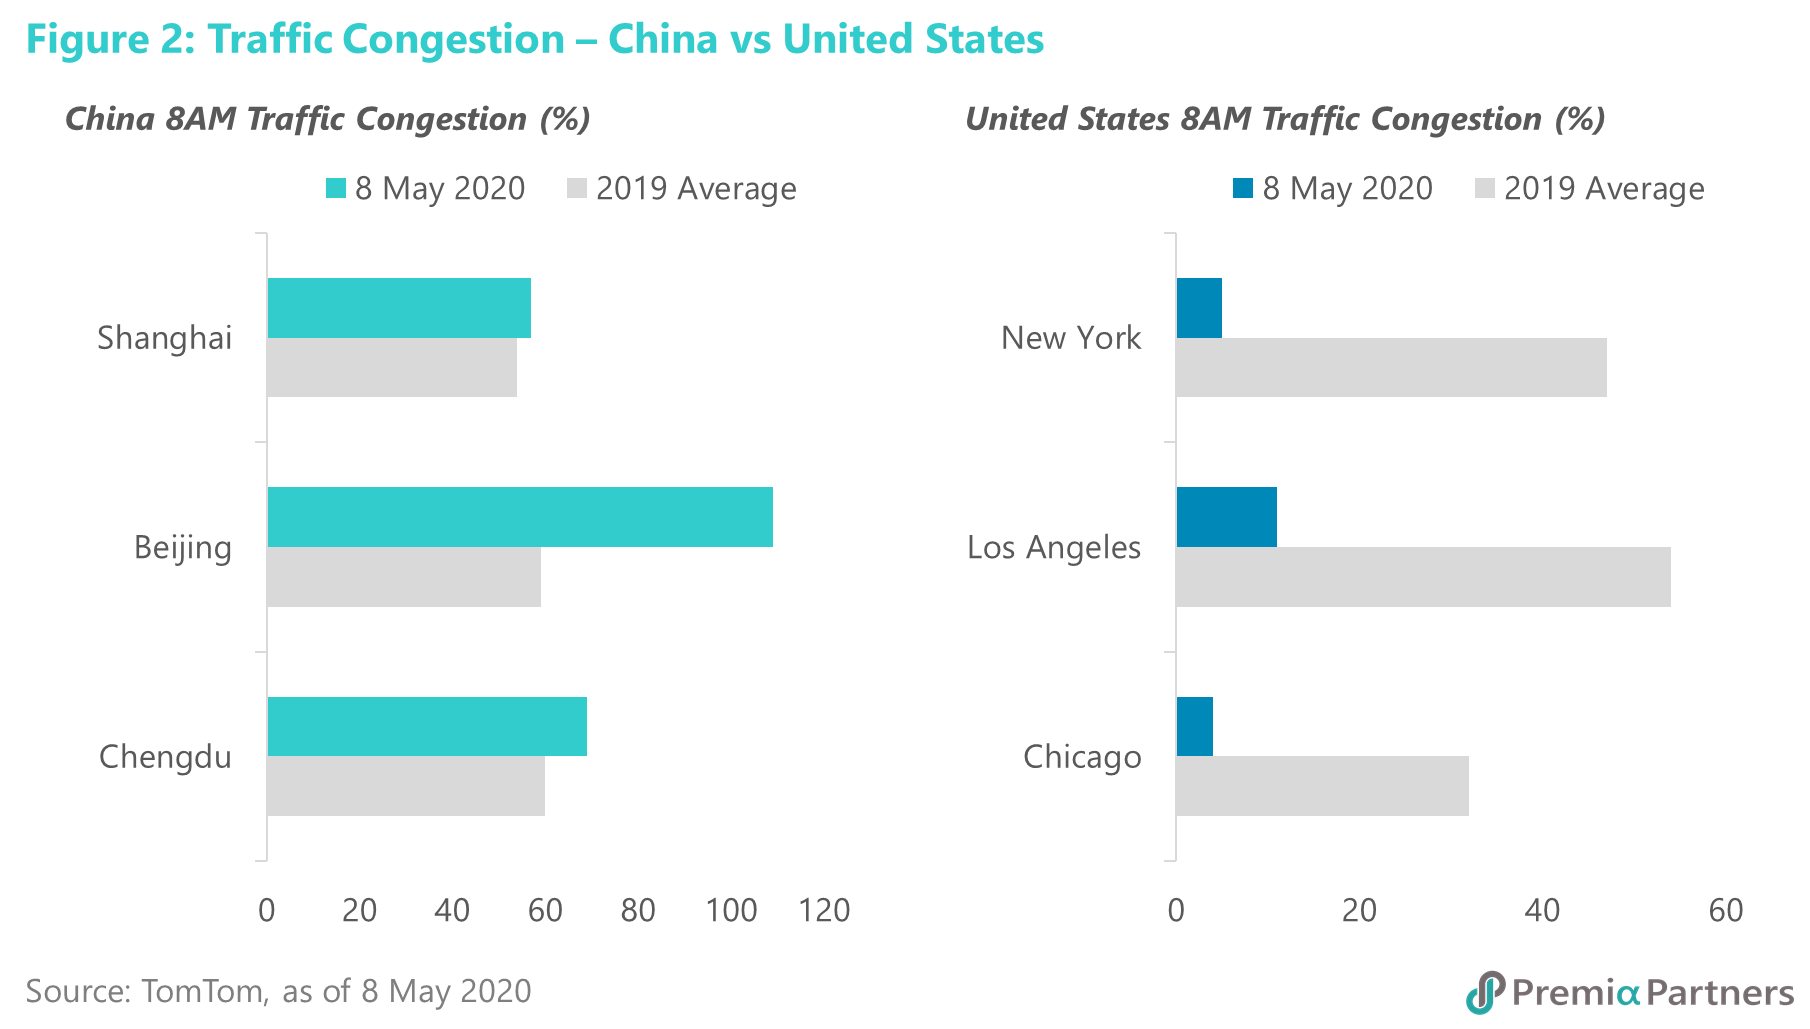
China is returning to work while the US is still struggling with disputes between the President and Governors over lifting restrictions. Traffic data from TomTom provides confirmation for the anecdotal evidence from both the US and China. Road conditions in major Chinese cities have mostly normalised compared to the average in 2019. However, US cities were, as of end last week (8 May), struggling at (depending on the times/days) up to 50% below 2019 averages. (Figure 2)
Premature re-opening of the economy could result in even greater spread of the virus, forcing renewed shutdowns, loss of business/income, requiring even more “misery alleviation money”.
As a result of the fiscal measures in the United States, the US budget deficit will rise to 18% of GDP in 2020 from 4.6% in 2019, according to the US Congressional Budget Office. Even before taking into higher corporate debt – and that will happen given the rush of debt issuance already occurring on the lower credit spreads brought on by the Federal Reserve’s interventions – the total debt to GDP ratio in the US looks set to spike to 285% of GDP by end 2020. In contrast, China’s fiscal stimulus was estimated by the IMF late-March at only 1.2% of GDP. That will change the narrative of China’s “debt problem” vis-à-vis the US. That will also change the ability of the US government to engage in more fiscal stimulus in the future. Of course, there is the idea that the Federal Reserve cannot be insolvent (given that it can print money if commercial banks ask for their reserves held at the Fed, thus switching one liability for another). But the stability of the financial system must be in question at some point in.
While China is focusing its funds on investments – including on “new infrastructure” projects that will lift productivity in the future, the US is spending big on “misery alleviation”/consumption. And its inevitably higher corporate debt to GDP will likely reduce investment in coming years, reducing productivity growth.
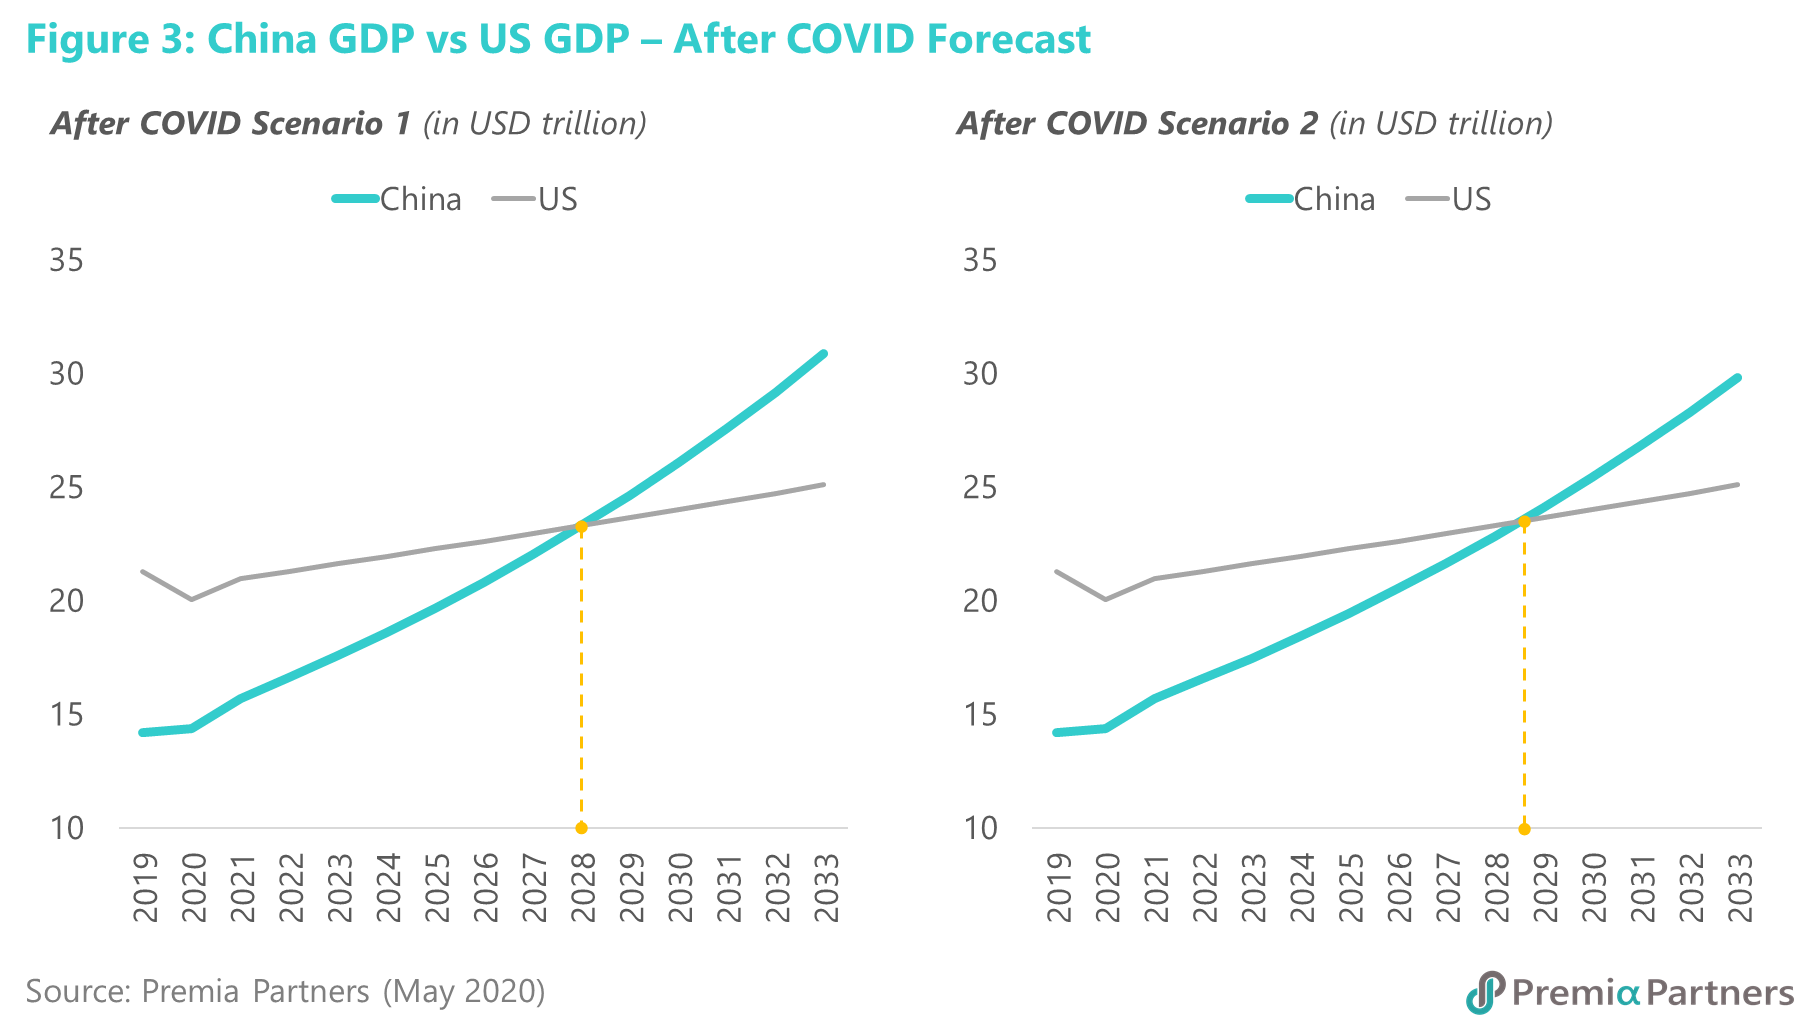
Will China’s GDP overtake the US this decade? Yes, possibly. If China maintains its productivity growth, it should be able to manage a long-term average GDP growth rate of around 5.8% a year. Meanwhile, long-term US GDP growth from 2022 onwards could ease to 1.5% on lower investment/lower productivity growth. Taking into account IMF projected growth rates for 2020 and 2021, China could overtake the US in Dollar terms by 2029.
Assuming a lower rate of growth of 5.5% for China, to allow for lower international trade, doesn’t make a lot of difference. It would slow down the point at which the Chinese GDP overtakes the US by one year. That is, 2030. (Figure 3)
Extended readings:
Related webinars:
Investment opportunities amidst the COVID-19 Crisis
Asia Innovative Technologies: Capturing the New Norms & Sustainable Growth Opportunities
