The pace of economic growth is accelerating. The latest data tells of continued upward momentum for the economy. 3Q20 GDP growth came in at 4.9% y/y, against 3.2% y/y in 2Q20 and contraction of 6.8%y/y in 1Q20 (figure 1). The economists’ consensus was for a higher pace of growth of 5.5% y/y. Yet, if there was any disappointment, it didn’t register on the Chinese equities market.
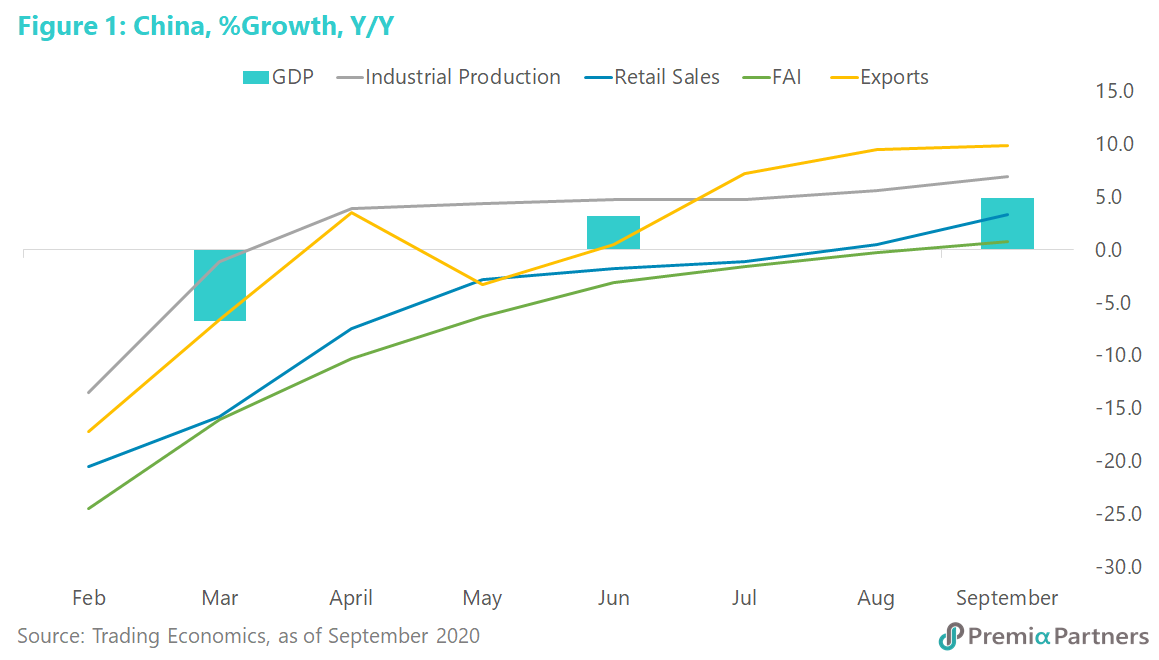
And that was because the data generally showed the pace of growth was accelerating; the growth was broad-based; and the economy is on track for above 2% y/y growth for the full year.
Retail sales continued to gather pace, growing 3.3% y/y for the month of September, having clawed its way back from deep negative 20.5% y/y in February, and finally breaking “above water” at +0.5% in August.
Export growth also accelerated from 9.5% y/y in August to 9.9% y/y in September. And while a sharp 13.2% surge in imports detracted from the net export contribution to GDP, partly explaining why the 3Q20 GDP figure came in below the consensus estimate, markets took that as a positive, as it showed that domestic consumption was recovering.
Fixed asset investment growth finally poked its head “above water”, at +0.8% in the nine months to September versus the same period a year ago. This compares to the string of negative figures for the year.
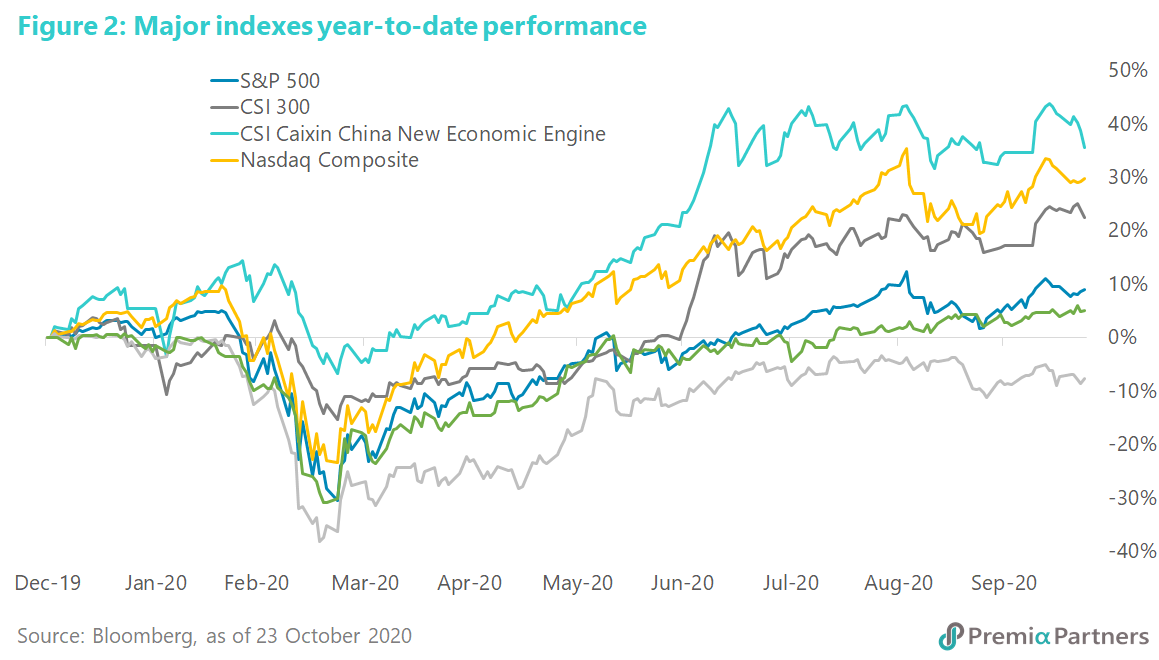
Chinese equities should continue to outperform Developed Markets on the basis of the economy’s exceptional growth. Like for like, Chinese equities continue to outrun the Developed Markets: CSI 300 Vs S&P 500, Eurostoxx 50, and Nikkei 225; Premia CSI Caixin China New Economy Vs the Nasdaq Composite (figure 2).
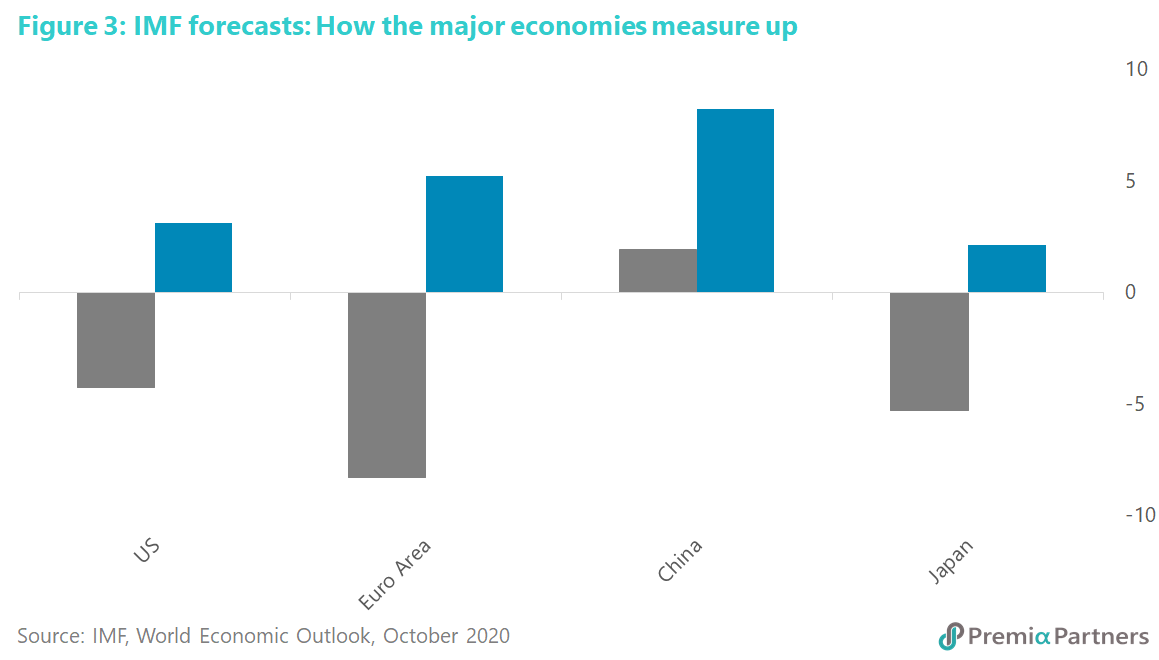
China’s exceptional growth this year – outlined above – is also reflected in the latest (October) International Monetary Fund (IMF) growth forecasts for 2020, which has China as the only economy of size to register economic growth for the year. The IMF is also forecasting growth in some African and Middle Eastern economies ------- Bangladesh, Myanmar and Vietnam. However, China is exceptional among the big economies of the world, for its positive growth in 2020 (figure 3). While it is early days yet, it is still notable that the IMF has China leading the major economies’ growth table by a long way ahead of the others for 2021.
China was the first economy into the pandemic and the first one out. To borrow that acronym FIFO, it was “first in, first out”. Today, it’s a case of “first in, only one out.” That will help its asset markets to continue to outperform into 2021.
Why China’s strategy has been working better than anything elsewhere in the world. Boiled down to key themes, what differentiates China’s pandemic strategy from the key DM economies today are: 1) virus suppression versus misery alleviation; 2) targeted stimulus versus “flood irrigation”; 3) fiscal over monetary.
Virus suppression versus misery alleviation. China’s virus suppression tactics were some of the most stringent in the world. However, they brought the reported case numbers down from a peak of over 15,000 a day to 33 at last count (October 24). That enabled a reopening of society and the economy in a manner not possible in most other parts of the world, and that allowed China to avoid massive amounts of the GDP disappearing into welfare payments to displaced workers.
For comparison, in the United States, the pandemic is now in its third wave – with daily case numbers now greater than at the peak of the second wave. At last count (October 24), the US was doing over 85,000 cases a day. At the peak of the second wave, the US recorded just over 78,000 cases a day.
The European Union has seen a runaway second wave, with daily cases over 149,000 a day (October 23), compared to the peak of the first wave of around 30,000 a day. The United Kingdom is also in the grip of a runaway second wave, with daily case numbers at last count (October 24) of over 20,500 a day.
Bottom-line: China’s economic success appears to prove the thesis that you can’t fix the economy until you control the pandemic.
Targeted interventions versus “flood irrigation”. China had been criticized earlier this year for its “timid” fiscal/monetary response to the pandemic. But its response has been entirely consistent with its strategy of “drip irrigation” versus “flood irrigation” – a strategy that emerged amidst much criticism of its stimulus response to the 2008-2009 global financial crisis, which was then panned for driving up debt-to-GDP.
The policy interventions this time have been selective and skewed towards fiscal stimulus rather than monetary. What monetary stimulus undertaken have also been targeted and focused on protecting financial market stability rather than flooding the economy with zero interest rate money.
For example, Aberdeen Standard Research Institute’s Chinese Financial Conditions Index – which combines among other things policy rates, bond yields, monetary and credit aggregates, asset market risk premia, volatility and the exchange rate –suggests the level of financial easing in China for 2020 has been consistent with 2018-2019 and way below the levels seen during the 2015-2016 resurgence of shadow banking.
On the fiscal front, there was a notable emphasis on spending on pandemic management/medical equipment; easing the financial burden on companies from things such as social security contributions and taxes and public investments. In brief, the theme has been virus suppression to reopen the economy; easing the burden on employers; pumping money directly into the economy via government investments; and spending on productive capacity over welfare handouts.
On the monetary front, the interventions were even more selective and targeted – for example, liquidity operations and assistance with credit for manufacturers of medical supplies and other essential items and SMEs.
Why its fiscal focus has been more efficient than massive monetary intervention. For the record, the PBOC’s benchmark, 1-Year Loan Prime Rate is now at 3.85%. It had been cut by only 30 basis points this year. The Fed on other hand cut the Fed Funds Target Rate 100 basis points since the pandemic, down to zero. The PBOC has held its Reserve Requirement Ratio steady at 12.5%, while the Federal Reserve has cut its reserve requirements on all transaction accounts to zero.
Cutting interest rates alone does not ensure money gets into the parts of the economy that need it most, when the money multiplier is broken. The US M2 money multiplier (M2/M0) has steadily declined from around 3.2 in the early 1980s to around 1.2 going into the pandemic. Of course, if you throw enough new money at the economy, some will reach the parts that need it most. Nevertheless, that is not the most efficient way of getting things done.
Indeed, massive monetary stimulus at a time of a broken money multiplier serves to boost asset prices more than it lifts the economy. That is, the money gets into the hands of the metaphorical “Wall Street” rather than “Main Street”.
China funded a large part of its fiscal response through the issuance of government bonds: RMB 1 trillion in special COVID-19 bonds issued by the Ministry of Finance and RMB 3.75 trillion in special project bonds issued by local governments.
In the process, China has allowed more realistic pricing of money than the Developed Markets. That goes some way to explaining why the spread between the 10-year China Government Bond yield minus the 10-year US Treasury yield hit a historical high of 244 basis points early in August. It has since eased a bit but still sits at a pretty wide spread of 234 basis points, making Chinese assets a lot more attractive than those in the DM.
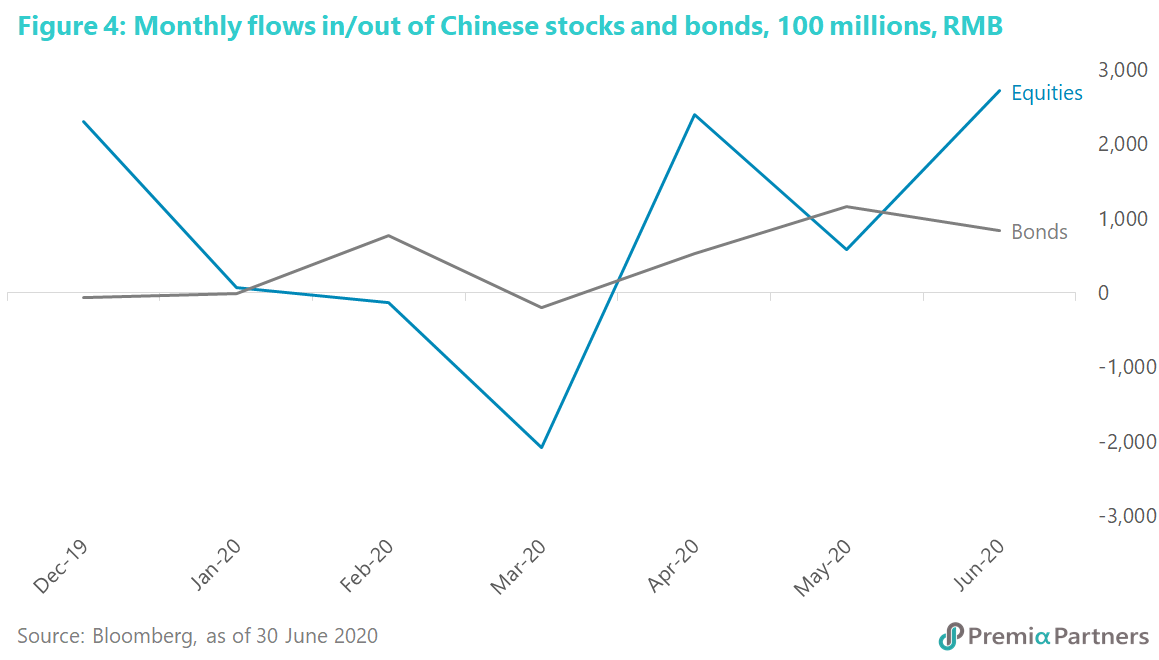
As a result, there has been a steady rise in the flows of funds into Chinese stocks and bonds since April.
Citing CEIC data, independent research house TS Lombard reports a rising trend of net inflows into Chinese bonds from April, resulting in year-to-September inflows into Chinese bonds totaling USD 110 billion. There have also been media reports of increased allocations to Chinese equities which are evident as well in the market’s outperformance.
Bloomberg data up until end-June tells the same story of rising inflows into Chinese stocks and bonds from April of this year (figure 4).
These funds inflows would have also contributed to the Yuan’s strengthening against the USD. The USDCNY has slumped from 7.18 in May to a low of 6.64 so far in October. That’s an almost 8% gain on just the currency alone, in just five months. That currency strength then loops back into the attractiveness of Chinese assets.
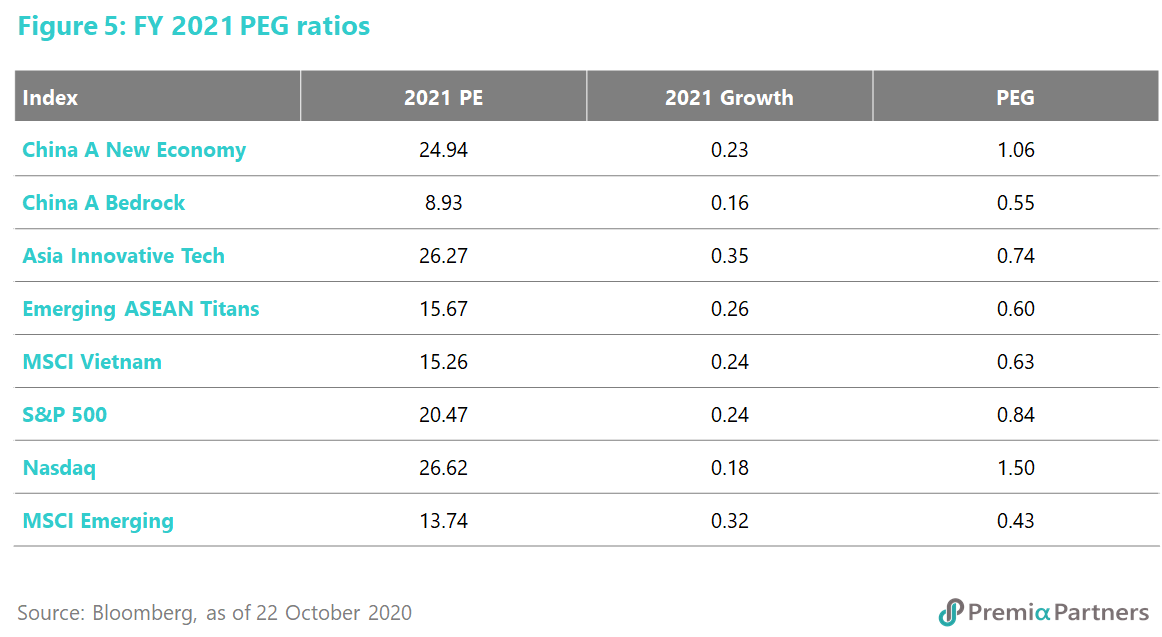
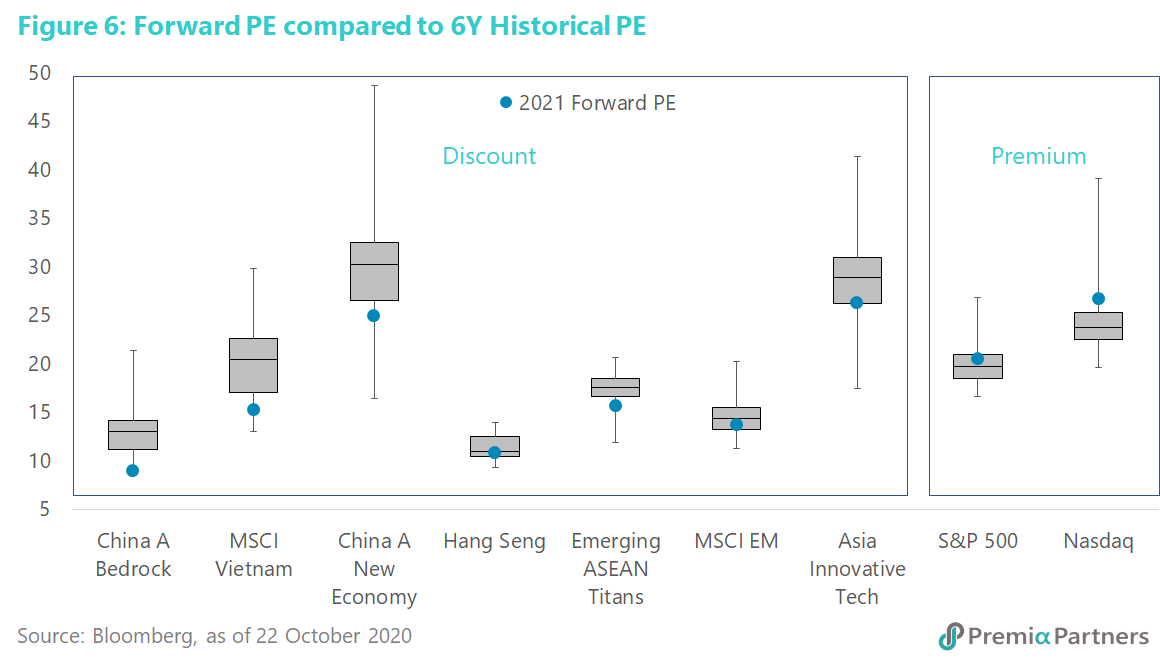
Note that notwithstanding Chinese equities’ YTD outperformance, like-for-like, Premia Partners Chinese equities ETFs (Premia CSI Caixin China Bedrock Economy ETF, Premia CSI Caixin China New Economy ETF, Premia Asia Innovative Technology ETF) still offer better value than US indices S&P 500 and Nasdaq 100 in terms of both their FY2021 PEG ratios and their discounts/premiums to their 6-year historical PEs (figures 5, 6).
