
The US Treasury’s recent – and ongoing – dash for cash highlights the economy’s enormous fiscal challenges.
To quote Bloomberg: “The barrage of fresh Treasury bills poised to hit the market over the next few months is merely a prelude of what’s yet to come: a wave of longer-term debt sales that’s seen driving bond yields even higher. Sales of government notes and bonds are set to begin rising in August, with net new issuance estimated to top $1 trillion in 2023 and nearly double next year to fund a widening deficit.”
On top of that, according to calculations by asset manager Horizon Kinetics and as quoted by gold fund manager Incrementum, the US will have to refinance around half of its national debt of more than USD 35 trillion by 2025. That’s a lot of debt maturities to digest in two years.
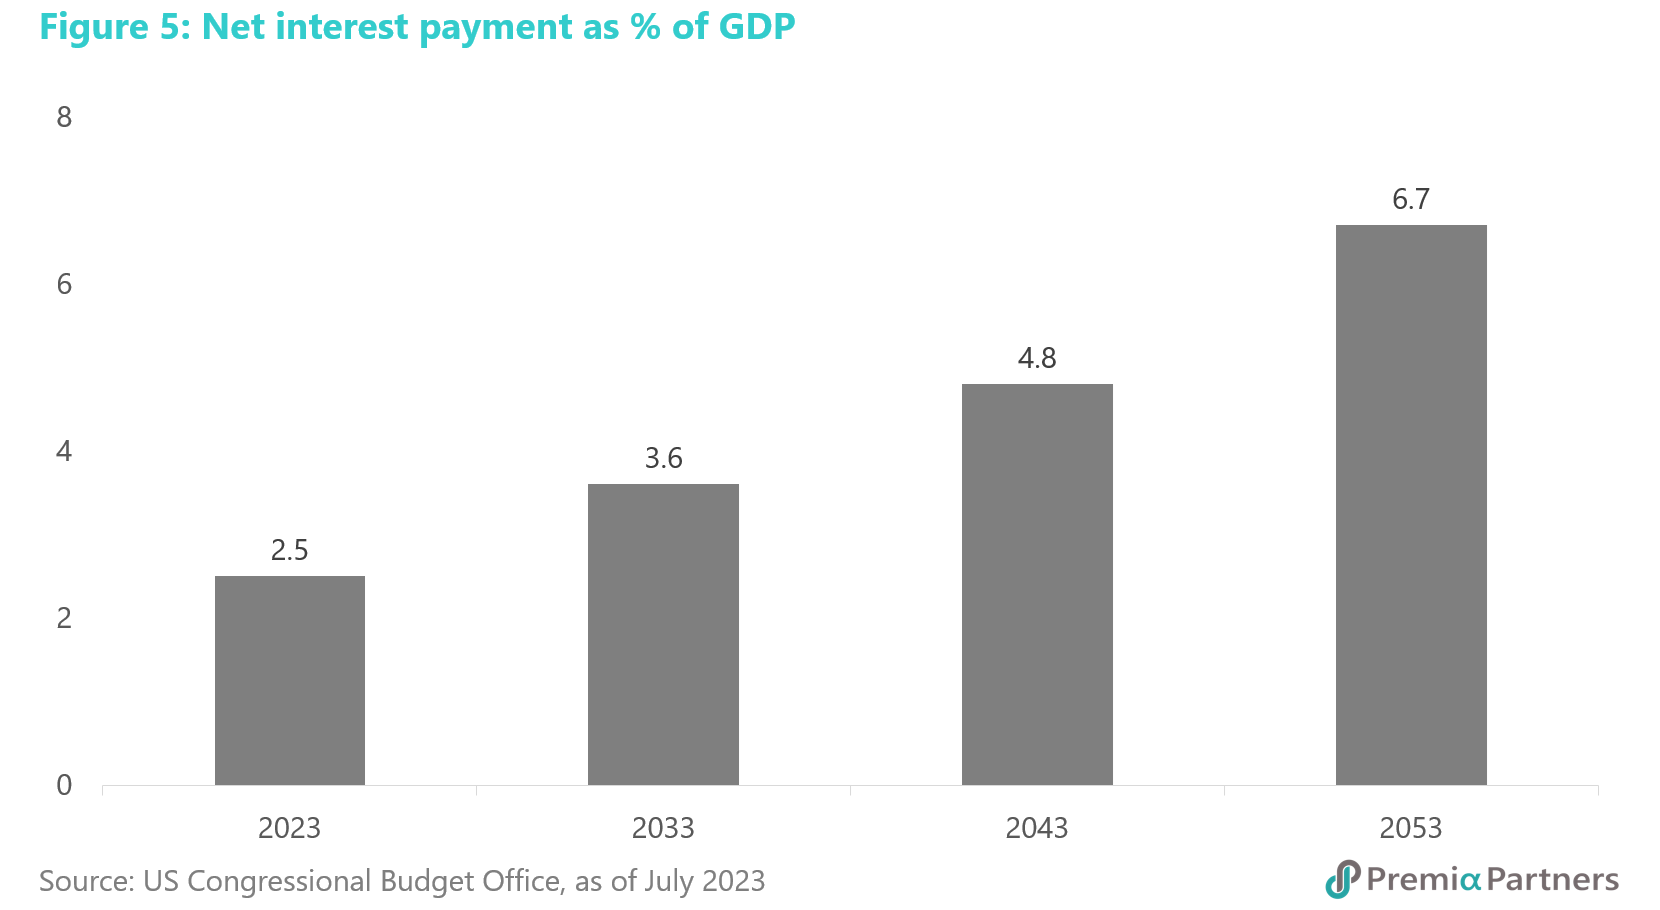
Our senior advisor Say Boon Lim cautions that even if Fed rates stabilise, the longer-term outlook for US Treasury yields would likely remain risky as persistent deficits drive up debt relative to GDP, in turn driving interest payments as a percentage of GDP up “vertically”. Indeed, the Congressional Budget Office is warning of the “risk of a fiscal crisis”.
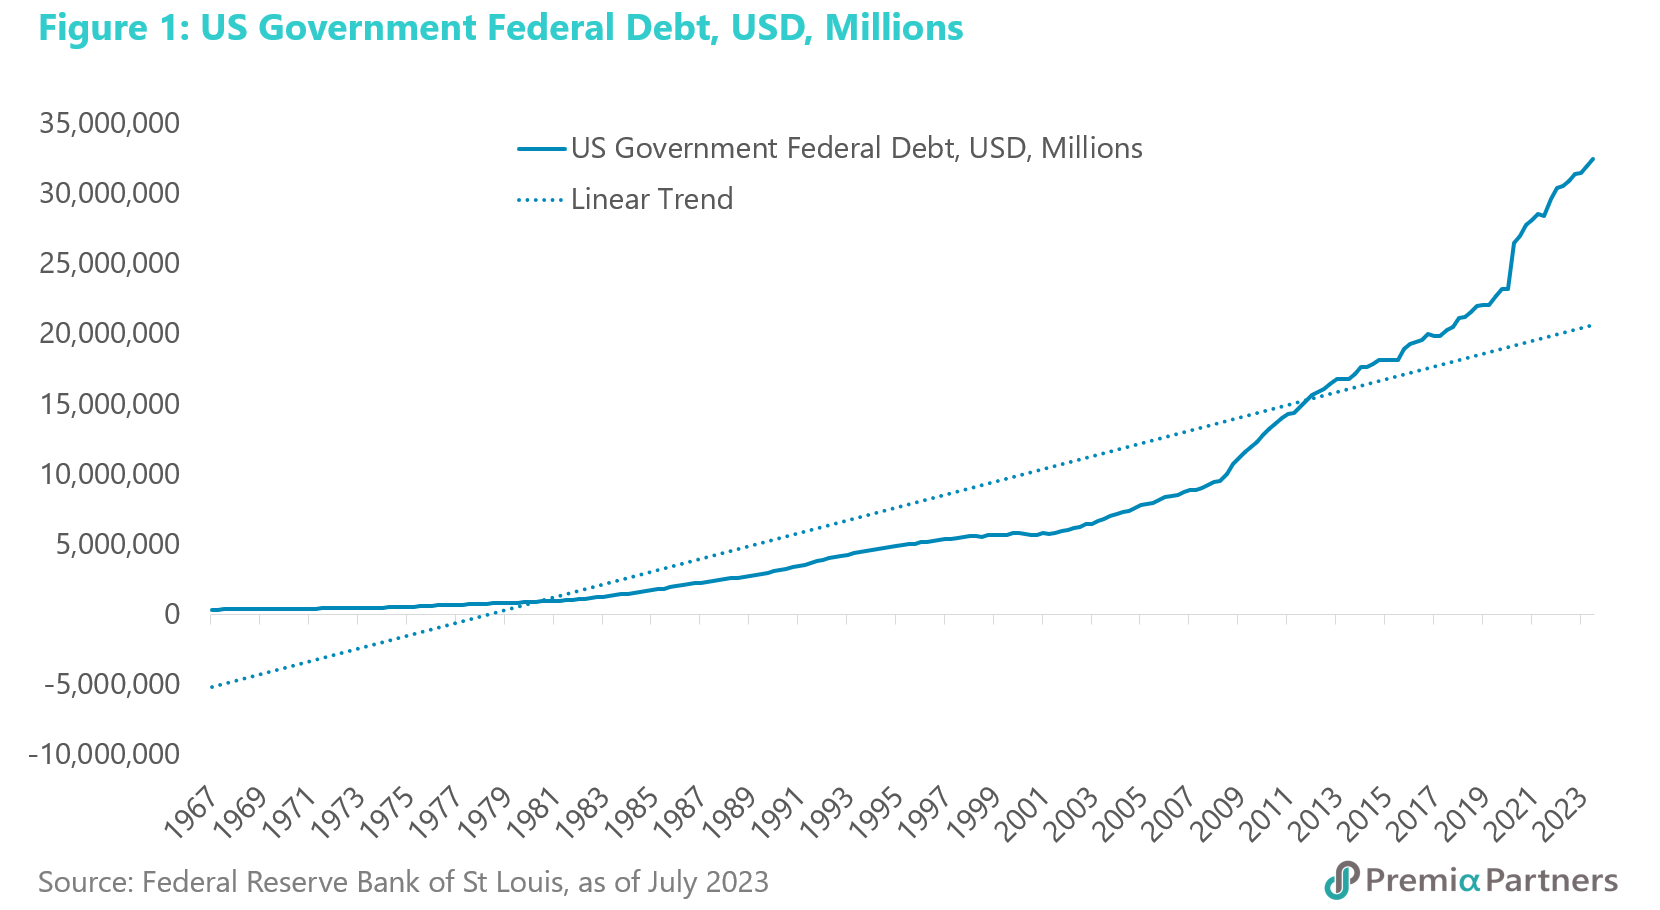
US Treasury rushing to issue debt, driving up yields. As we had written before in our weekly newsletter, the lifting of the debt ceiling would see the US Treasury rushing to top up its depleted General Account. It’s been quite a surge, with the General Account rising almost 10-fold from US$44.8 billion at the start of June to US$415 billion within a month. Meanwhile, US government federal debt has gone up by around US$1 trillion, within a month. As much as that might sound, it is just another month in US debt accumulation – it is just another step in the ever-steepening rise in US debt accumulation since the Nasdaq Crash of year 2000.
10-year and 2-year yields have been rising despite muted rates expectations in June. Since the start of June, the 10-year UST yield had gone up 40-basis points (data as of time of writing on 11 July). The 2-year yield had gone up 52-basis points over that same time frame. Some of that may have been due to general concerns about Fed rates, but we note that June was a period during which rates expectations were muted. Indeed, in the early part of June, Fed rates expectations were falling. So, a good part of the higher yields appears to have been to attract buyers at auctions.
The two biggest foreign holders of US Treasuries have been reducing their investments. It should also be noted that both Japanese and Chinese holdings of US Treasury securities were respectively down by 7% and 11% over the 12 months to April this year. (Japan and China are respectively the largest and second largest foreign holders of US Treasury securities.)
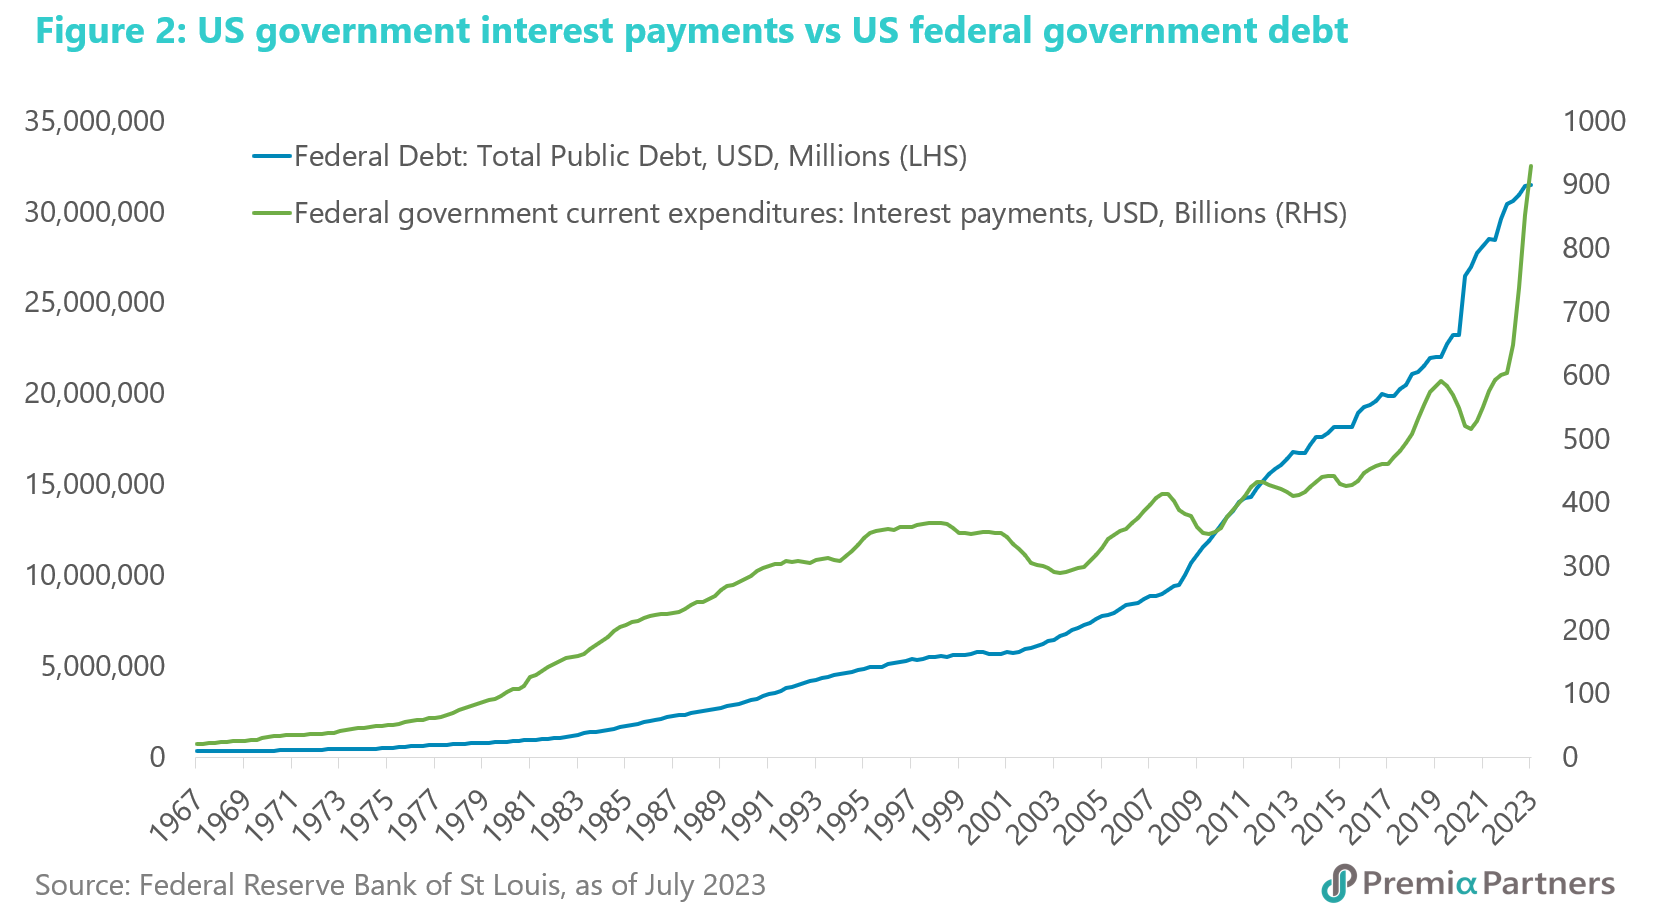
Interest payments have gone “vertical” since the start of 2022. What does all this say about long-term US government debt sustainability? There is nothing new in the surge in the US government’s debt and interest burden but it is worth updating as the outlook is deteriorating. Interest payment as a percentage of GDP has gone almost literally vertical since the start of last year – a lagged response to the spending, debt and deficit binge of 2020-2021.
When pricing US debt, what does the market see, looking ahead? Of course, it is true that these are long-term matters. But two things can be said even now: 1) Even the long-term nature of this debt accumulation can have an immediate cost of borrowing impact – markets look ahead; 2) What the market can see now of the long-term outlook is not attractive.
Consider what the US Congressional Budget Office says in its June 2023 publication “The 2023 Long-Term Budget Outlook”.
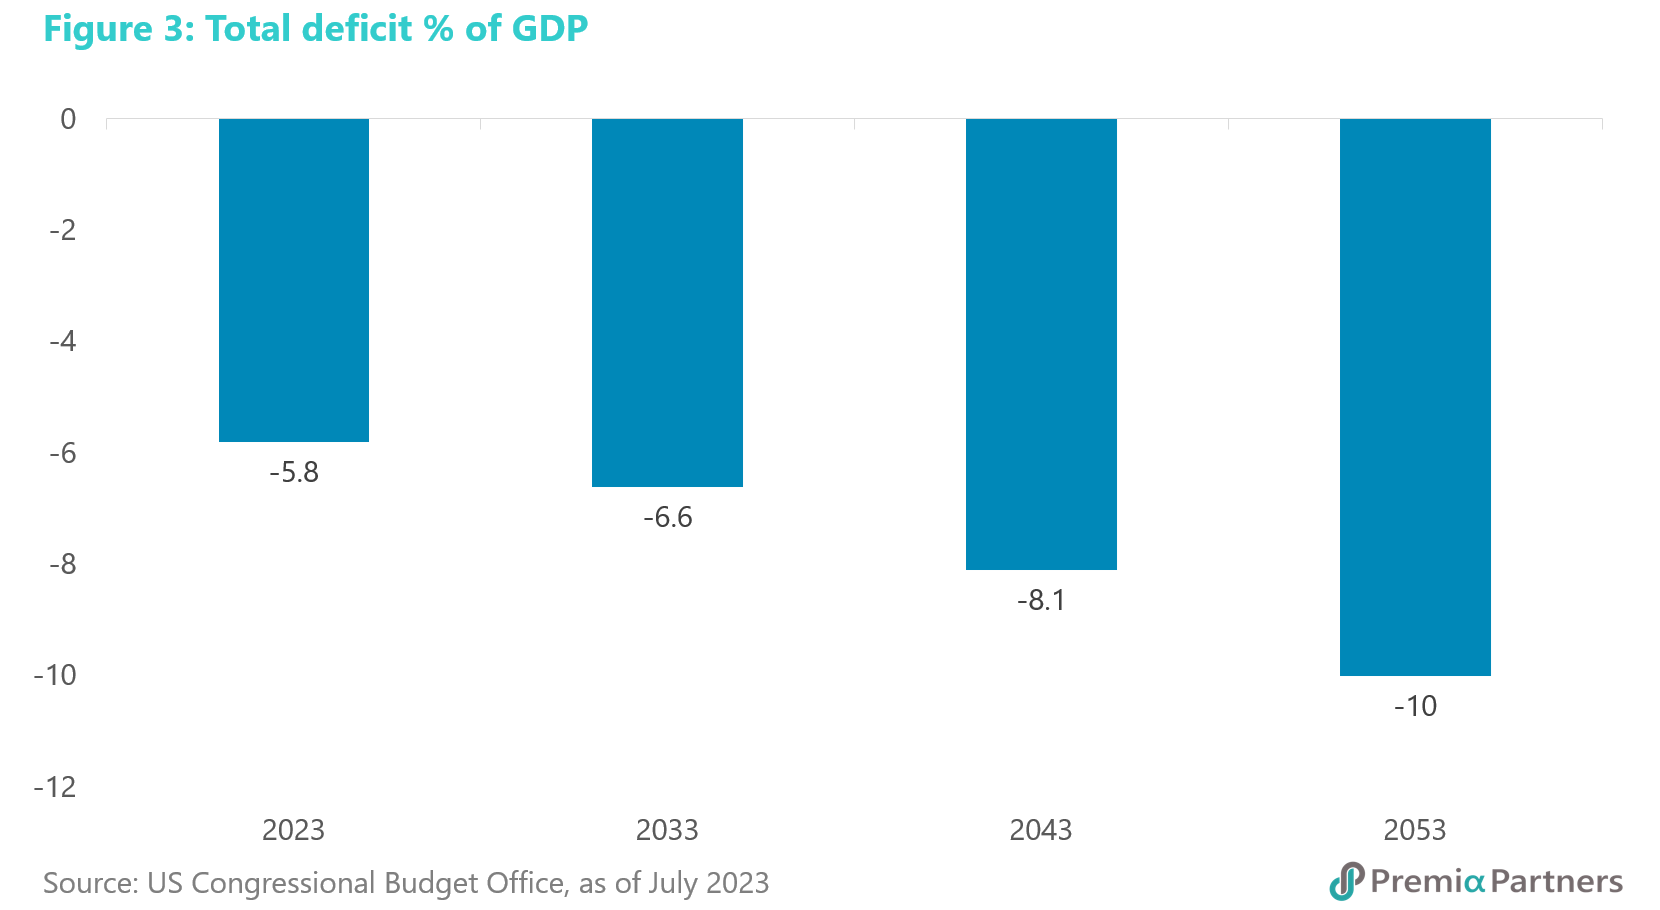
The US Congressional Budget Office (CBO) warns of deficits rising almost every year for the next three decades. The report says: “From 2023 to 2053, deficits average 7.3 percent of GDP, more than double their average over the past half-century. And deficits are projected to grow almost every year over the next three decades, reaching 10.0 per cent of GDP in 2053.”
Higher deficits and debt loom in the face of increases in welfare, health care and interest payment bills. “In the past 100 years, deficits have been that large only during World War II and the pandemic. The growth in deficits over the next three decades occurs as increases in spending—especially spending on interest, the major health care programs, and Social Security—outpace increases in revenues.
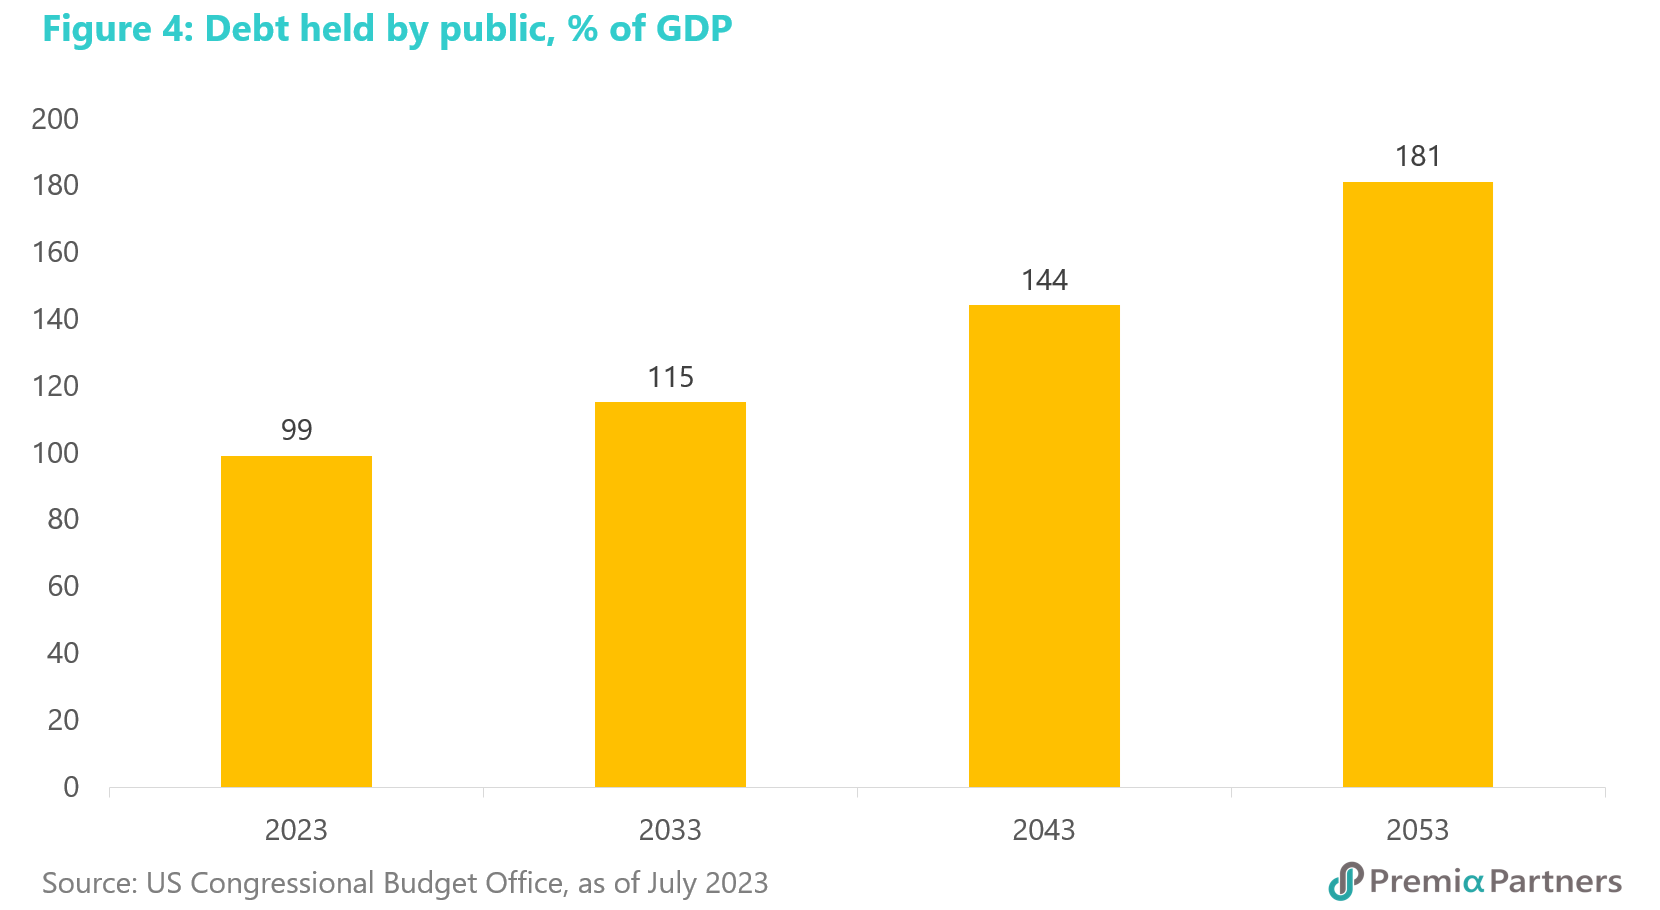
“Persistently large deficits would lead to substantial increases in federal debt. In CBO’s projections, federal debt held by the public, measured in relation to GDP, surpasses its highest level in history in 2029, reaching 107 percent. Debt continues to climb thereafter and reaches 181 percent of GDP at the end of 2053.
CBO warns of “risk of a fiscal crisis”. “Such high and rising debt would have significant economic and financial consequences. It would, among other things, slow economic growth, drive up interest payments to foreign holders of U.S. debt, elevate the risk of a fiscal crisis, increase the likelihood of other adverse effects that could occur more gradually, and make the nation’s fiscal position more vulnerable to an increase in interest rates.”
See the following charts for where the CBO projects US debt, deficits and the interest burden is likely to head over coming decades.
Positioning in floating rate notes as an asset class. So, long-term, US debt and deficit arithmetic argues for continued upward pressures on US Treasury yields. Even near-term, positioning in floating rate notes still makes sense.
- Fed likely to hike further before it hits its terminal rate. The current market consensus of a terminal rate of 5.25%-5.50% runs against the Fed’s median projected appropriate policy rate which suggests a target rate of 5.50%-5.75% this year.
- The risk of out-of-consensus surprises: BIS warns rates “may need to stay higher for longer than the public and investors expect”. This is what the Bank for International Settlements said just recently, in late June: “Inflation has started to subside from multi-decade highs almost everywhere, but the work of central banks is far from done. Despite the most intensive monetary policy tightening in recent memory, the last leg of the journey to restore price stability will be the hardest……the gains made so far in the fight against inflation owe much to supply chains easing and commodity prices falling. But labour markets are still tight and price growth in services has proved harder to tame. There is a material risk that an inflation psychology will take hold, where wage and price increases start to reinforce each other. Interest rates may need to stay higher for longer than the public and investors expect.”
- Beware premature celebration of “disinflation”. The current disinflation narrative is flawed. Disinflation is clear only in y/y terms and in all-items inflation, because of the inclusion of commodities, set against the base effect from the rapid rise in commodity prices from February to June last year, following the Russian invasion of Ukraine. The picture for core inflation and in m/m terms is less clear. The much-celebrated decline in core CPI inflation for June still left the m/m inflation figure at +0.2%. If it stays at +0.2% m/m, the y/y core CPI inflation figure will end up at a new normal of well over +3.0% by the end of next year. If 3.0% core inflation is the new normal, a Fed rate range of 5.0% to 5.5% could also be the new normal.
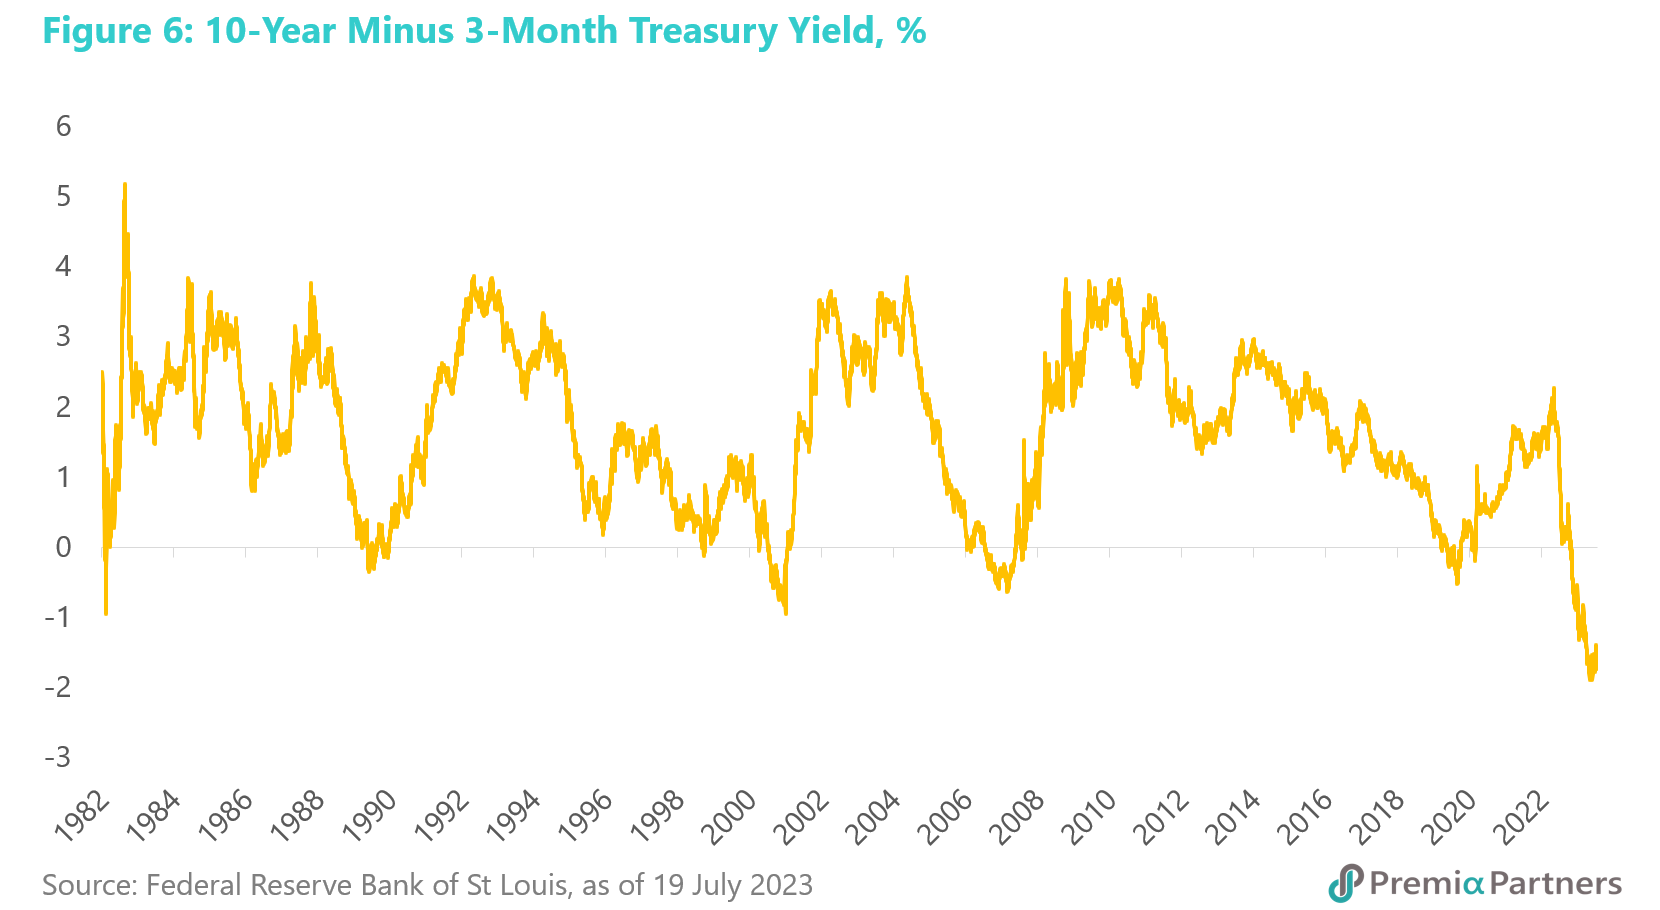
- Yield curve likely to remain inverted for a lot longer. The 10-year minus 3-month US Treasury yield curve is so deeply inverted now at 174 basis points, it will likely be a long time before the spread is back into positive territory.
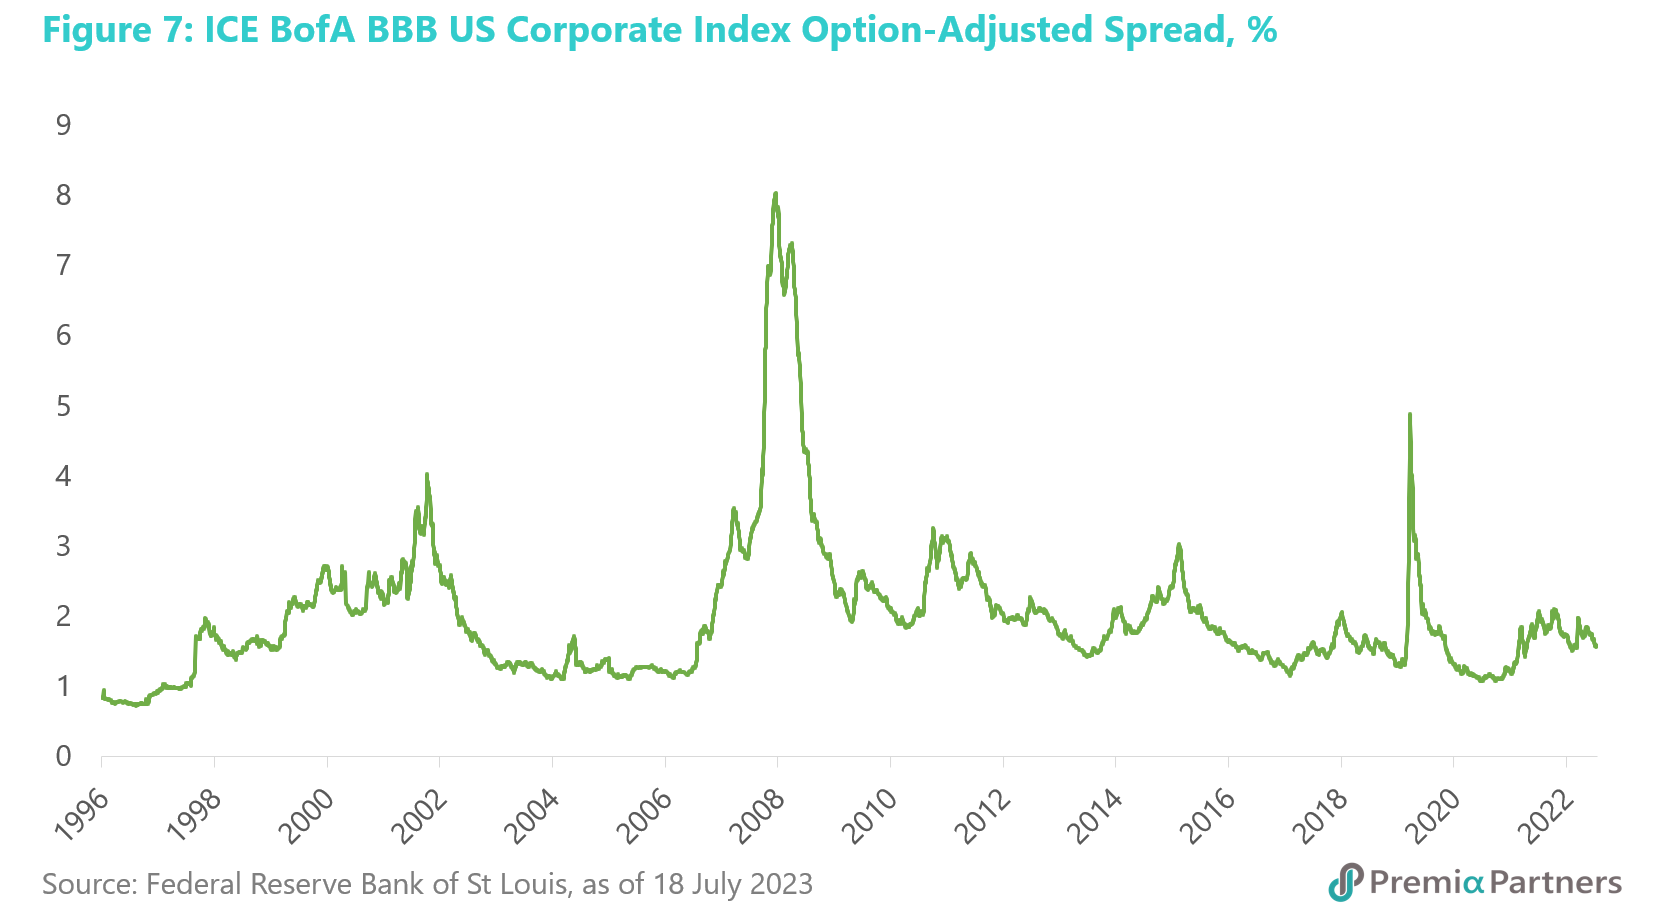
- Corporate credits: Spreads are too low amidst falling earnings and the likelihood of rising default rates. Investors contemplating corporate credits – even investment grades – should consider how low spreads are currently, and the potential for spread widening, particularly given we are already in a US earnings recession.
 According
to Bloomberg Intelligence, the earnings contractions in 4Q22 and 1Q23
will likely deepen in 2Q23.
According
to Bloomberg Intelligence, the earnings contractions in 4Q22 and 1Q23
will likely deepen in 2Q23.
