
The revenge of the cycle. Banking failures in the US – and now revelations of the financial reporting “deficiencies” and capital raising woes at Credit Suisse – speak volumes about the stage of the cycle in Developed Markets. In particular, they warn against underestimating the risks at this stage of the asset and economic cycles.
From firing up the economy during the pandemic to a dumpster fire post-pandemic. Bull markets are born in ice and bear markets are born in fire, and both the US asset markets and the economy have been on fire as a result of the fuel of monetary expansion and zero rates dumped on them by the Federal Reserve. The Biden Administration then lit the match by channeling the newly minted money directly to US consumers. This has now turned into a metaphorical “dumpster fire”.
The figures should have said it all – this was the worse inflation in 40 years. The US was a severely overheated economy. Yet, many in the market did not want to appreciate the severity of the inflationary fires lit under the economy by the Fed’s printing and the Biden Administration’s spending.
There were both supply disruption and demand explosion at work, but the “transitory inflation” camp chose to only focus on supply. Now, the data is telling us that the disinflation of recent months had been due largely to easing energy prices. Core services inflation is not backing off and this is the stuff that can develop feedback loops.
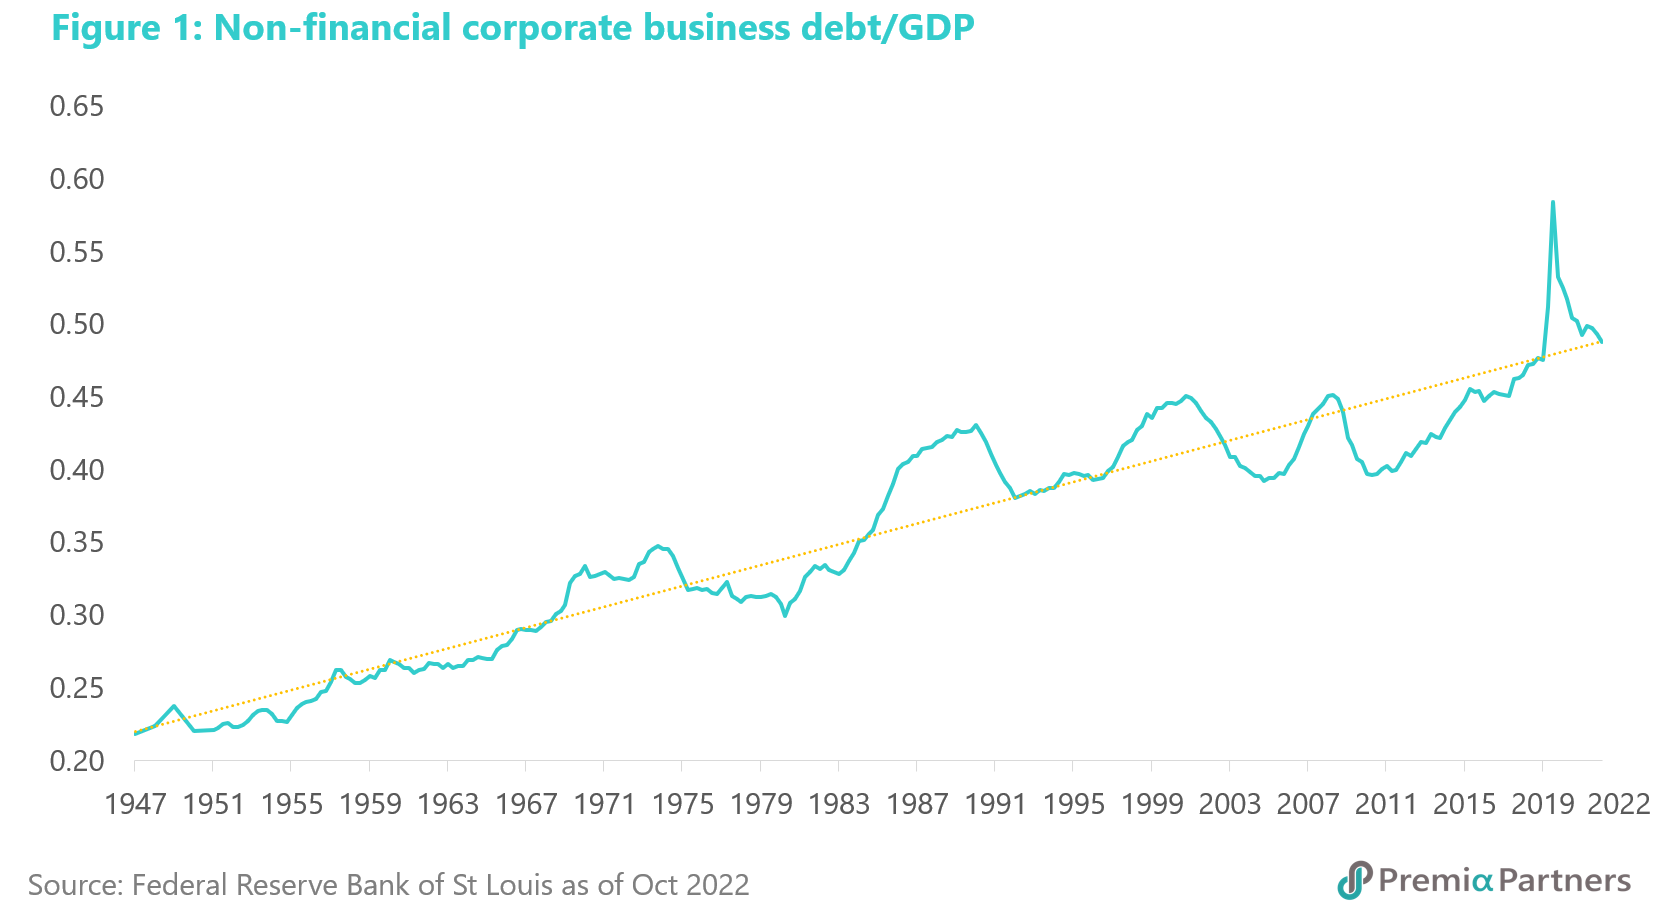
Each credit cycle ends with tightening and contraction. Then there is the credit cycle. US non-financial corporate debt to GDP had been encouraged by policy makers to rise way above previous peaks, and of course, each peak is followed by tightening and contraction.
Each asset market cycle ends with value destruction. There is an asset cycle: In late 2021, just before the S&P 500 bear market started, the Shiller CAPE ratio for the S&P 500 hit an eye-watering 39x – the second highest level recorded, next only to that at the peak of the tech bubble in 1999, when it hit 44x.
The idea of the indestructible US market is about to be severely tested. The combination of the longest bull market in US history (2009-2020) and the shortest bear market in US history (February-March 2020) may have made the risk asset markets seem indestructible. Ironically, the role of the Federal Reserve in pumping up both the credit and asset cycles, through unprecedented printing of zero, or almost zero-rated Dollars (except for a brief period in 2017-2019, when the Fed rate peaked at around 2.4%) reinforced this image of invincibility. This is ironic because it actually posed a severe vulnerability, as we now see, when the Fed is facing the highest inflation in 40 years, starting off from the lowest rates in history.
S&P 500 countertrend rally appears to be over. We had been firmly of the view that the recent rally in the S&P 500 was a countertrend rally – a bear market rally – which would end in lower lows, and that remains our view.
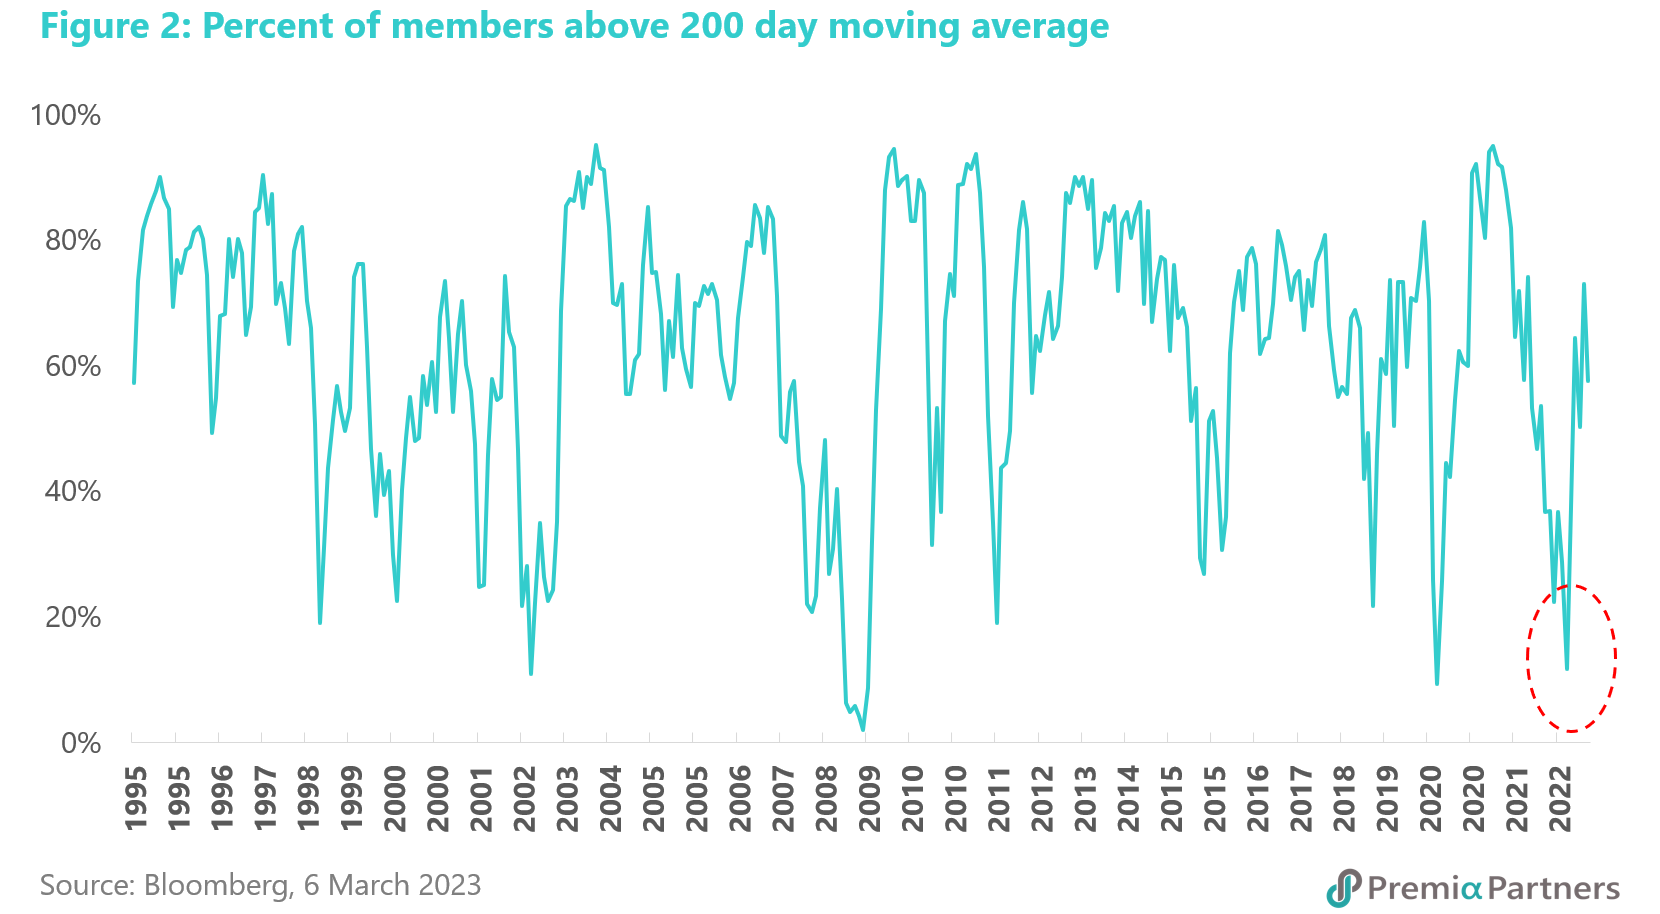
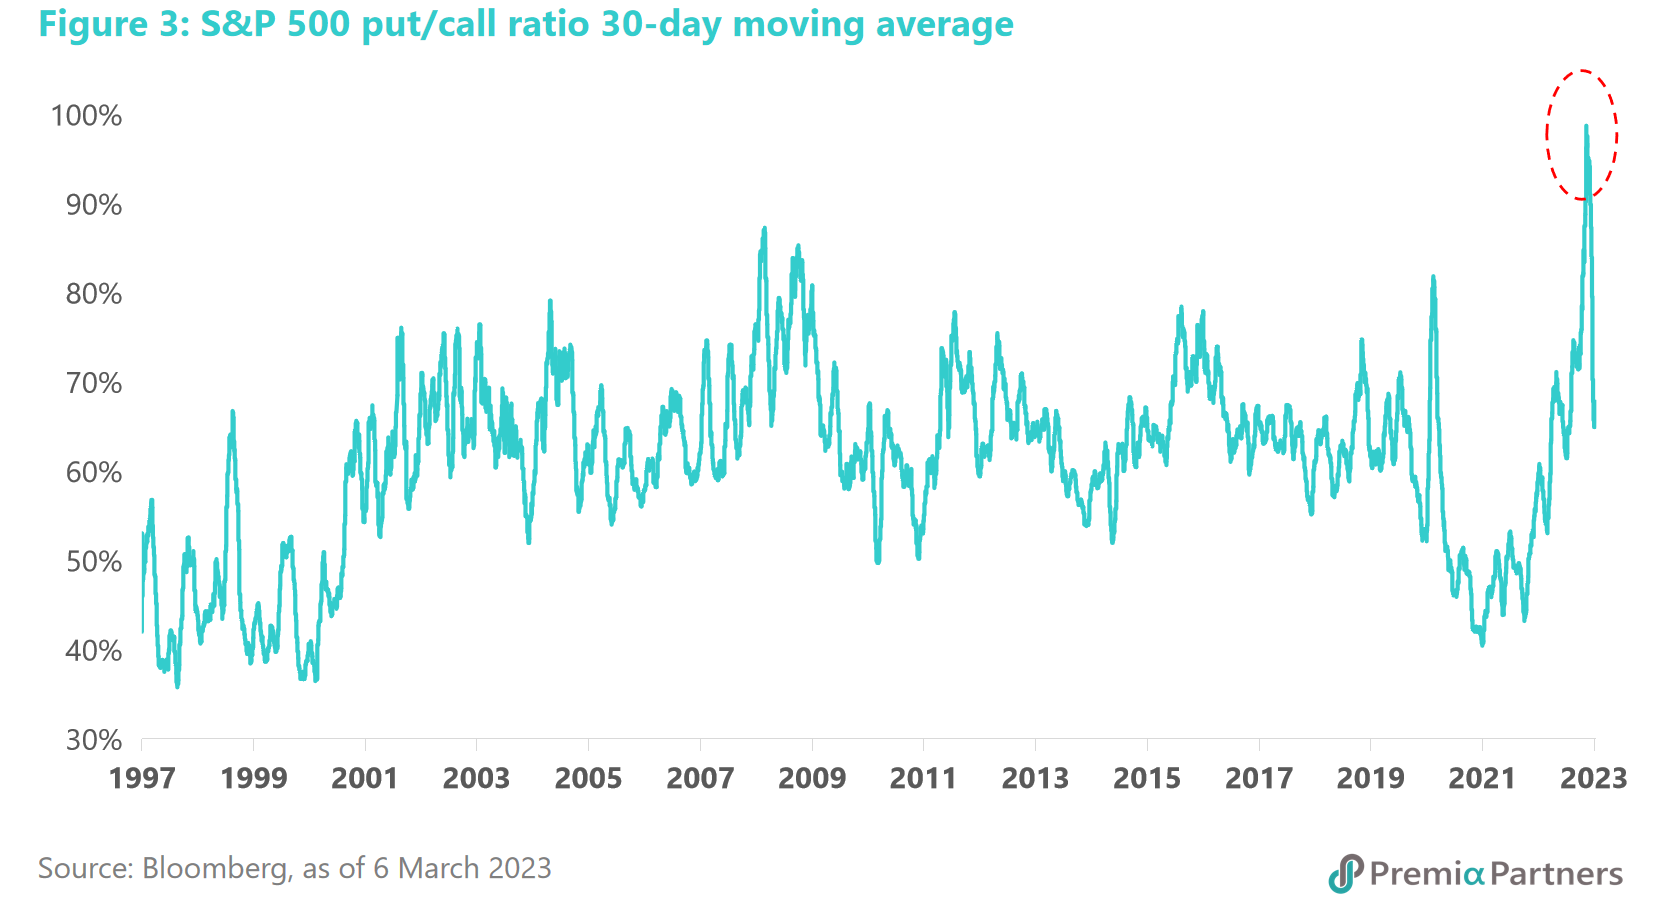
It was a positioning and technical rally. To be fair, the rally from October last year had some of the hallmarks of a cyclical bottom – but only from a technical and positioning perspective. The percentage of S&P 500 constituents above their 200-day moving average had hit a cyclical low, from which sustained rallies followed in 2020, 2009 and 2002. And the 30-day moving average of the CBOE put/call ratio had blown up above previous peaks in 2020 and 2009.
It was less convincing from both fundamentals and valuation perspectives. Never mind the Shiller CAPE ratio. Even from a simple forward PE ratio perspective, this was not a sufficiently cheap market, particularly given the standout risks peculiar to this cycle. The forward PE ratio of 15.2x at the start of the October rally was significantly higher than at the bottom of any previous cycles since 1990.
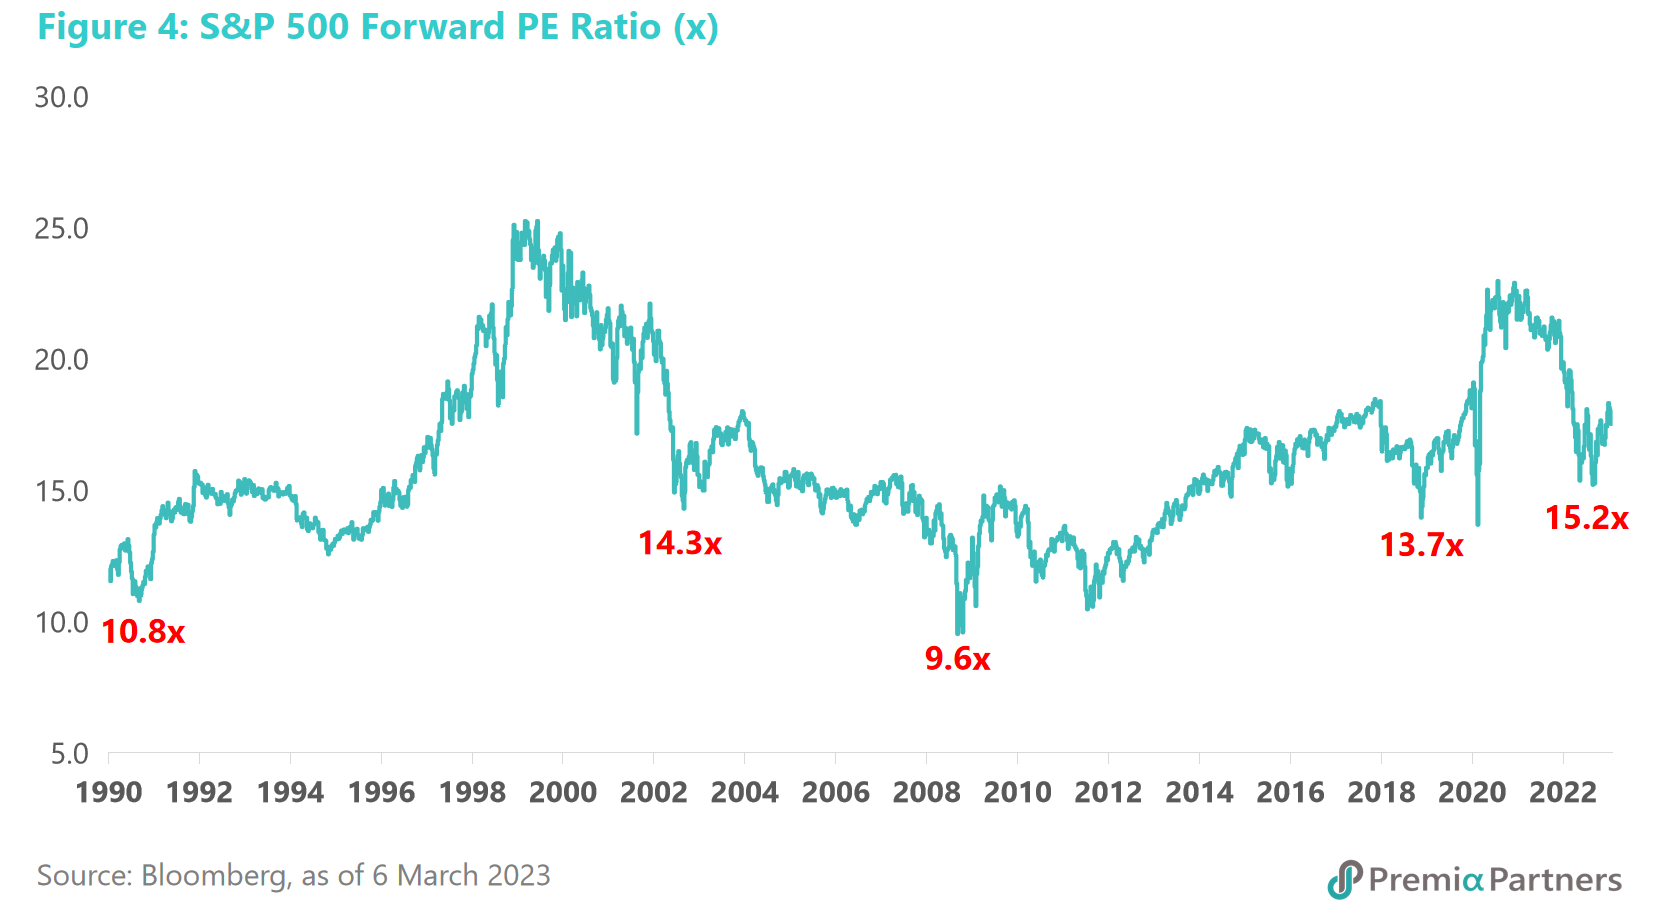
The S&P 500 had fallen only 28% at the October 2022 low, compared to an average bear market decline of 40% in the US since The Great Depression. If October was the low, it would have been one of the milder bear markets in US history.
How would a higher valuation than previous cyclical lows make sense in the face of the greatest inflation and rates challenge in 40 years? That does not sit comfortably with the scale of the inflation and rates challenge facing the US economy at this stage of the cycle. The Fed is coming off the lowest – the deepest negative – real rates in US history. At last count, it was -2.8%, against a 60-year mean of +2.1%.
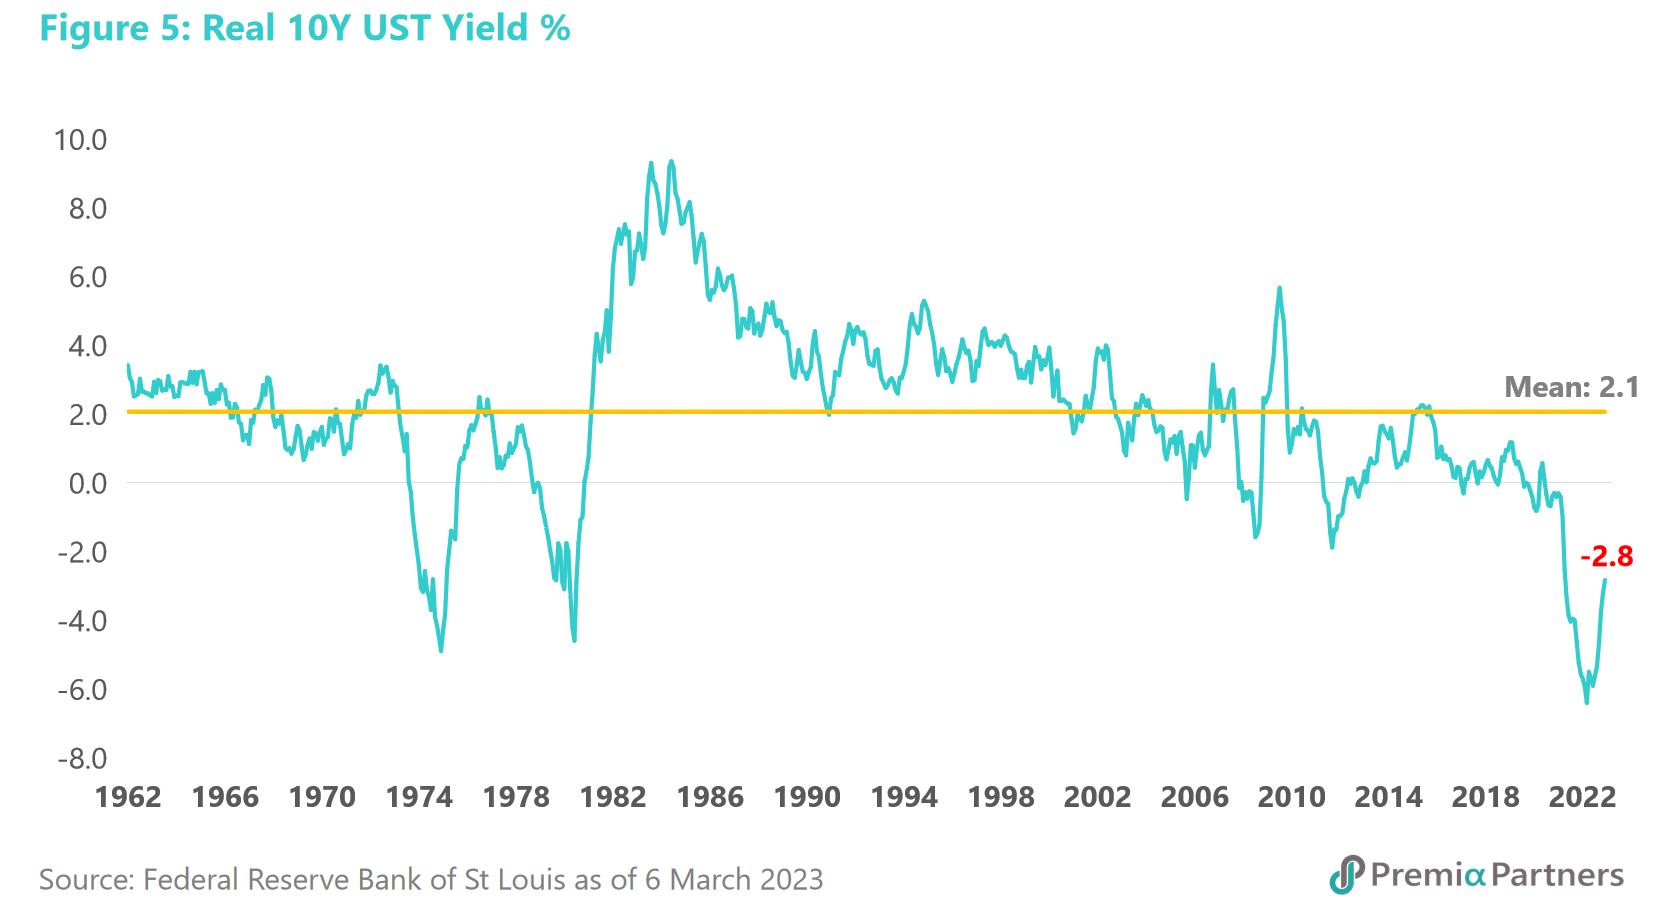
The mind boggles at where the “risk-free rate” for valuations could land given different permutations of the inflation rate and the nominal 10-year US Treasury yield. To put it mildly, it could be very destructive of valuations.
Valuations should go significantly lower to justify the higher risk-free rate. Another way to view the relationship between rates and valuations is to look at the “yield gap” between the equities earnings yield minus the 10-year UST yield. At last count, that yield gap was only 1.6% versus a 20-year mean of 3.1%. In 2020, the start of pandemic bull market was preceded by a 6.1% yield gap. In 2009, the start of the post-GFC bull market was preceded by a 6.2% yield gap.
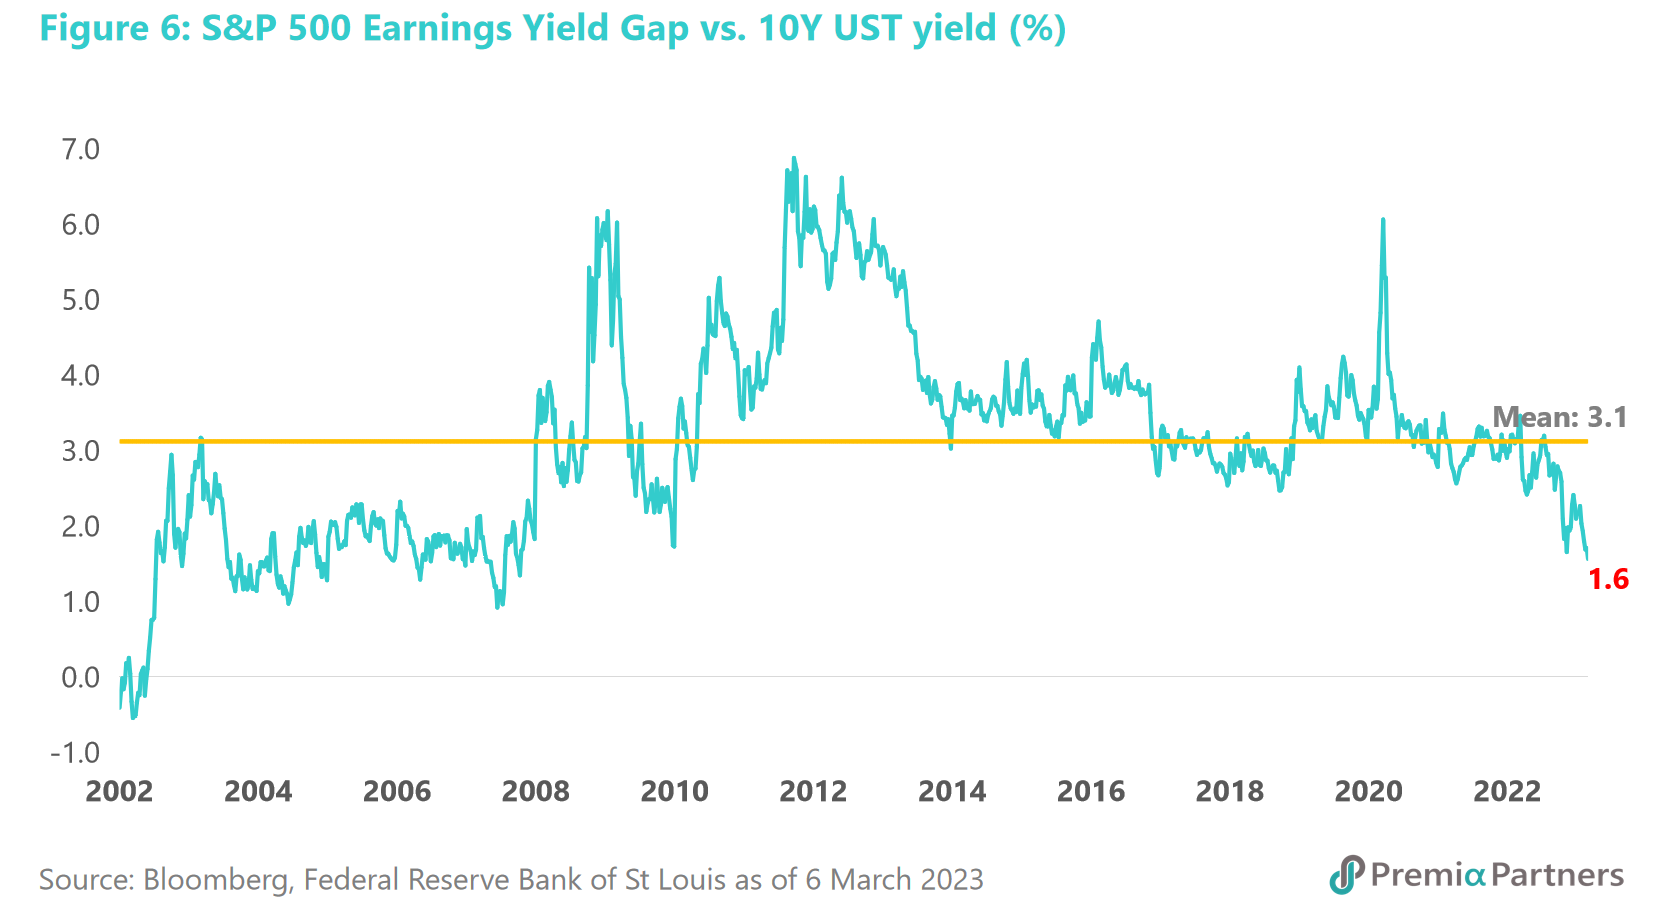
So, what would the forward PE ratio look like, assuming mean reversion to a yield gap of 3.1% and a 10Y UST Yield of 4.0%? We would be looking at a forward PE ratio of around 14.0x, which on current estimated index earnings of 220, would translate to an S&P 500 of 3080. This is not to indicate where the index would land. It is to only demonstrate that valuations are still expensive by historical standards, particularly after adjusting for the “risk-free rate”.
The assumption of the return of the Fed Put is simultaneously seductive and reckless. The suggestion that banking failures in the US are somehow good for risk assets is doubling down or tripling down on the “Fed put”. The idea is simultaneously seductive and reckless. This time around, the Fed has even less room for manoeuvre. Ring-fencing the risks from specific banks is one thing. Broad-based stimulus via rate cuts and monetary expansion (again, so soon after the start of tightening) is quite another thing. A commentator on Bloomberg TV said it would be a “loss of face”. That would be the least of the Fed’s problems. It would be a “loss of faith”. It risks losing the confidence – the faith – of key movers of the economy in its ability to maintain price stability.
The Fed risks a return to 1970-1985 if it loses its nerve on rates. Looking back at the experience of 1970-1985, there is a lagged relationship between monetary expansion and inflation, with the cycles of monetary expansion followed by higher inflation, and vice versa.
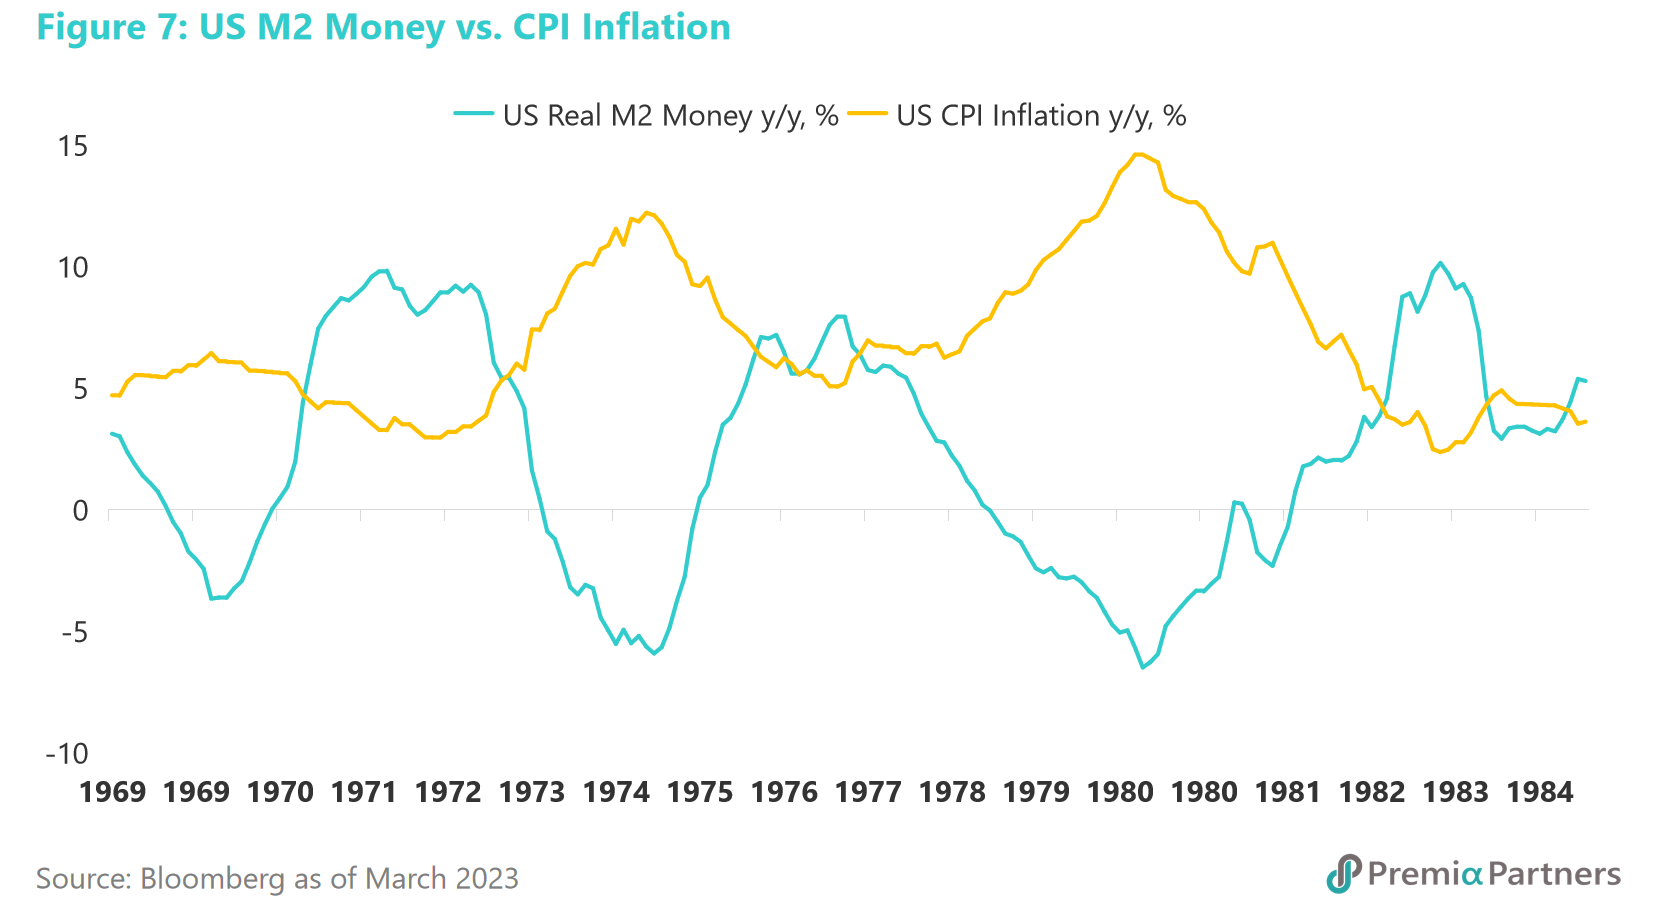
The Fed should, if it was sensible, think many times before returning to the 1970s, and walking the same path as the then Fed Chair Arthur Burns.
It is going into battle with very little – rates are lower than at previous cyclical bottoms and inflation is higher. Note also that the Fed has much less room for manoeuvre than in 2002 and 2009. Back to the real rates dilemma: Before the Global Financial Crisis, the Fed had around 5.3% of rates to cut and inflation was around 4.0%. Before the tech bubble burst, the Fed had around 6.8% of rates to play with, and inflation of around 3.6%. Today, the Fed has an effective rate of around 4.6% and inflation of 6.0%.
US debt is out of control. Then there is the ability of the economy to sustain the surge in US government debt. Before the bursting of the tech bubble, the US government’s debt was around 55% of GDP. Before the GFC, it was 68%. It is now 122%.
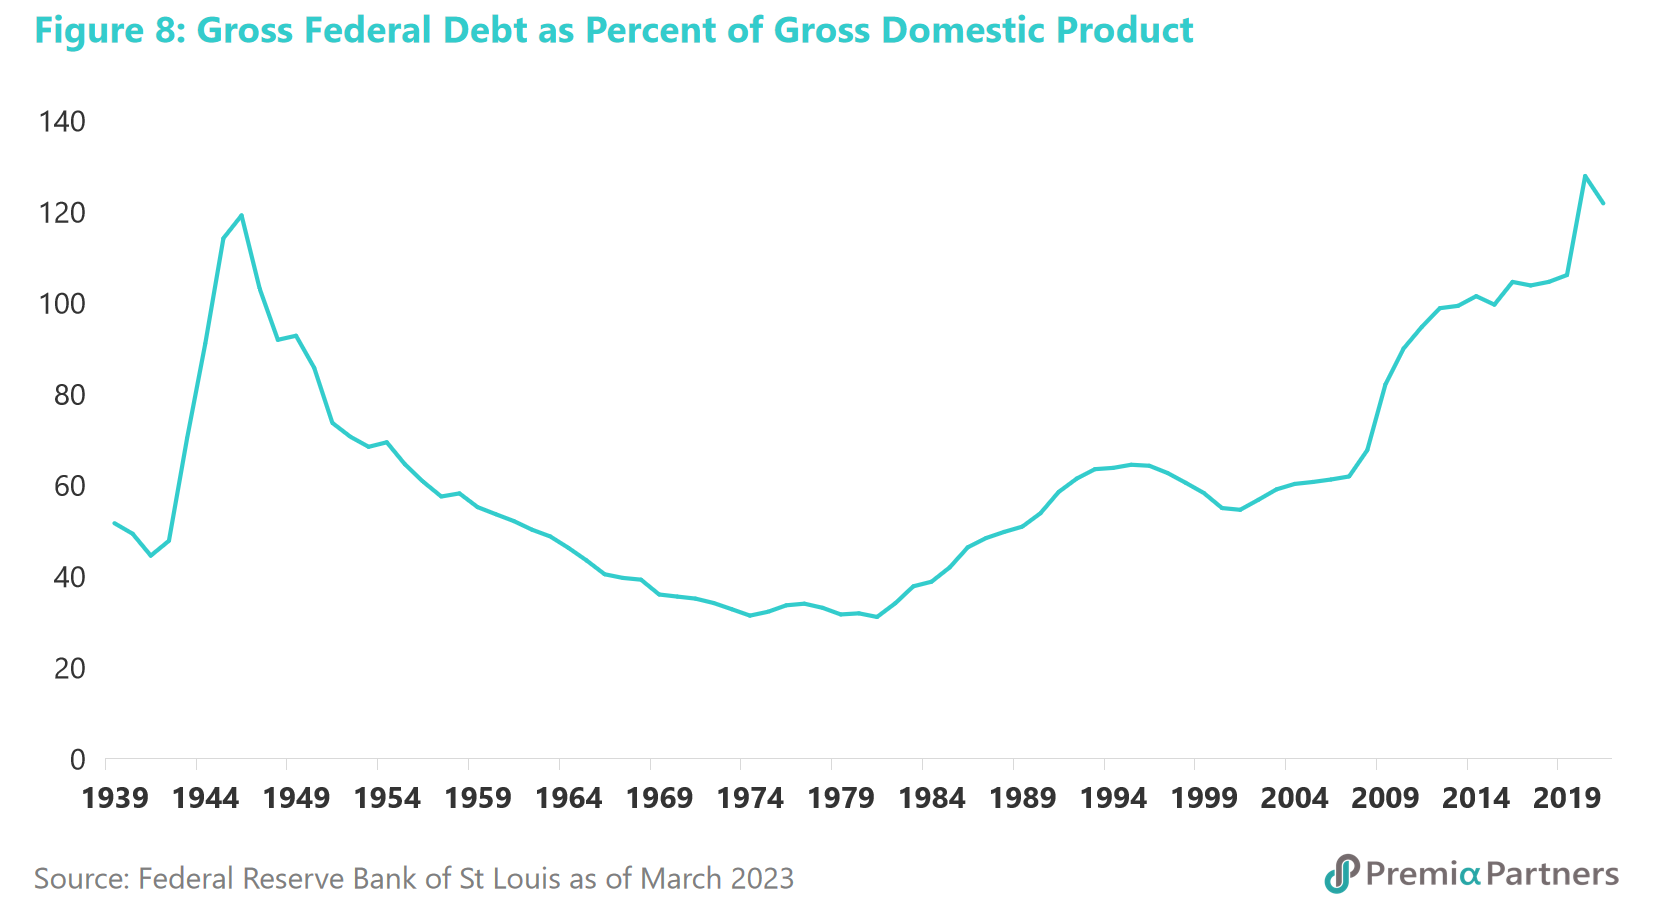
These are war-time levels of debt – Second World War to be precise.
The banking failures in the US are a reflection of cyclical forces. So, this is about both the cyclical and the secular. Even from a cyclical perspective, the US asset market outlook is worrying. Those US banks that failed recently were victims of the cycle – the bursting of (yet another) tech bubble, a crypto currency bubble, and the zero rates/ultra-low yields bubble. US bond investors should take note.
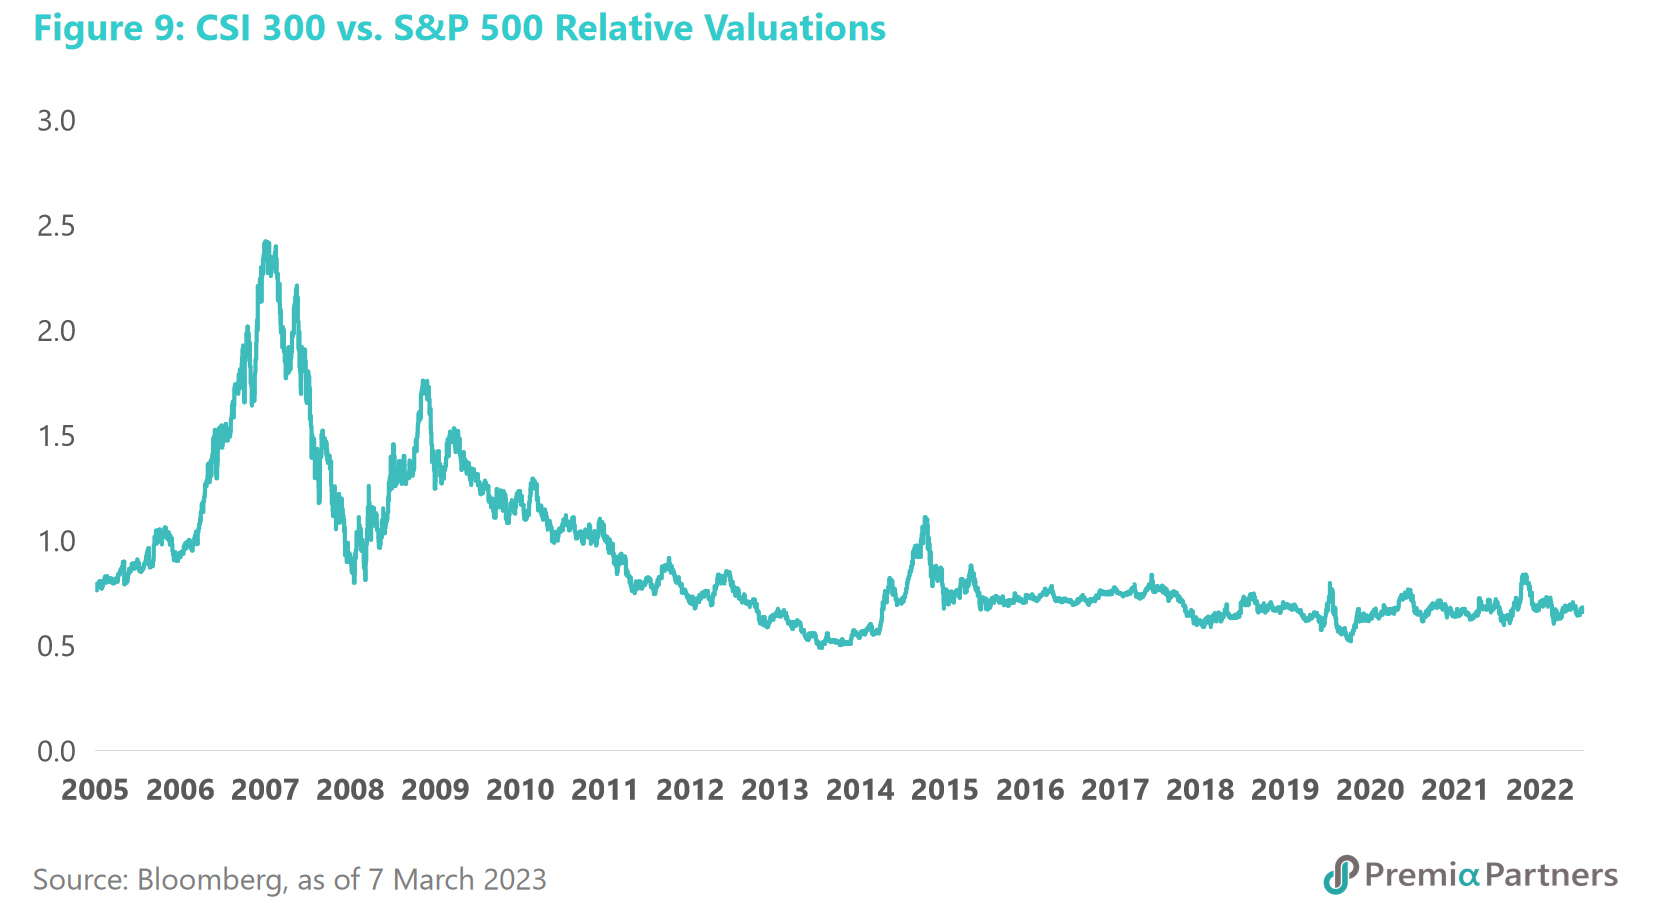
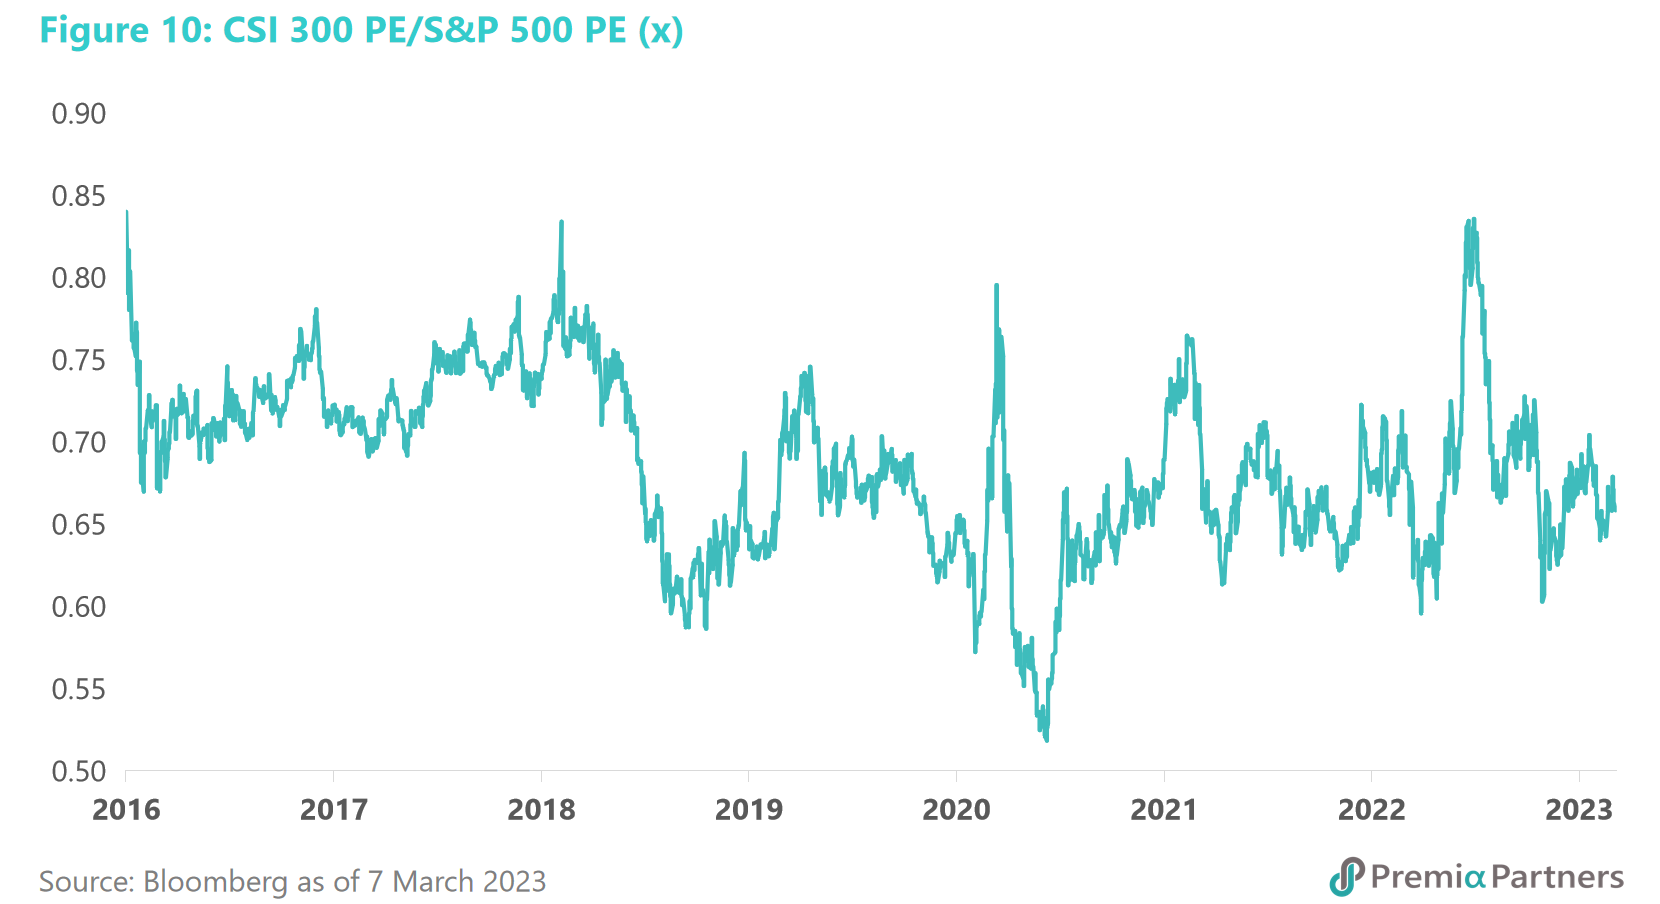
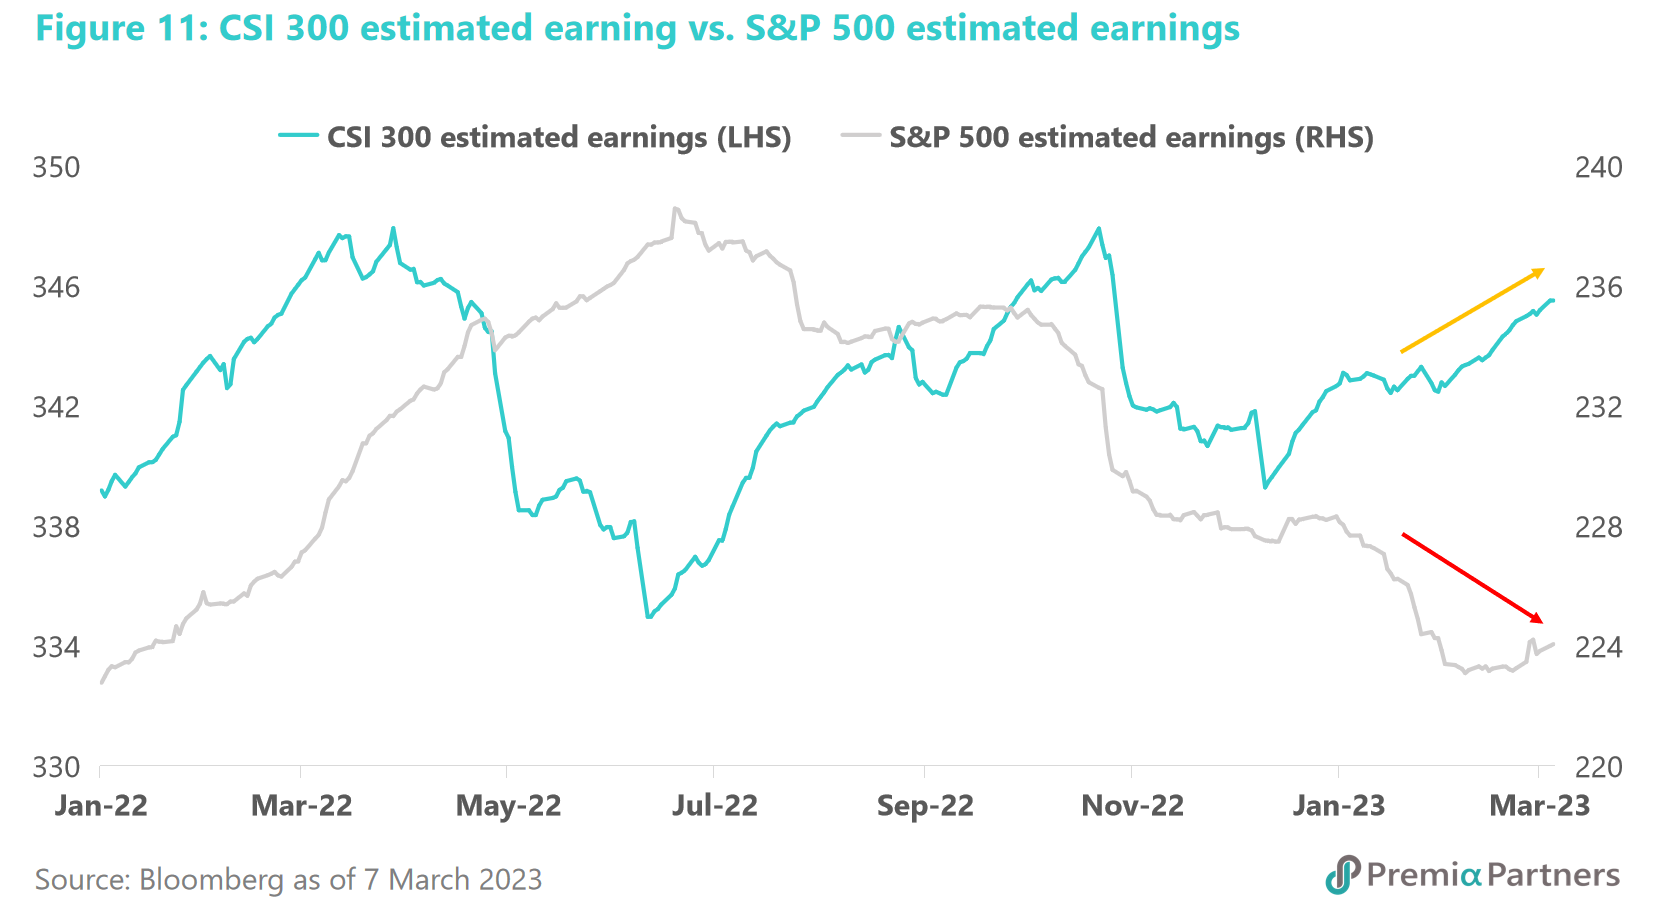
Just as there is a cycle for the US, there is also a cycle for China – for the Chinese economy and Chinese asset markets. As the US is at an overheated stage of its cycle, China appears to be at an early stage in its economic, earnings and asset market cycles. Valuations are at the low end of their ranges relative to US equities, and CSI 300 earnings estimates are rising when S&P 500 earnings estimates are declining.
There are risks in any market, but right now, the US market looks the far riskier of the two.
