This week marks the first anniversary since the listing of our China A-shares smart beta ETFs on the Hong Kong Stock Exchange on Oct 24, 2017. Premia CSI Caixin China Bedrock Economy ETF (2803 HK) recorded a return of -21.76% in its debut year, compared to a return of -21.74% for its benchmark, CSI Caixin Rayliant Bedrock Economy Index. Premia CSI Caixin China New Economy ETF (3173 HK) recorded a return of -31.27% during the same period, compared to a return of -31.84% for its benchmark, CSI Caixin Rayliant New Economic Engine Index.
ETF recap
First, let’s state the obvious: the numbers are quite negative overall. We’ll get to the key drivers of this move, how Premia ETFs fared vs market-cap indices and what to expect going forward further below. Before that, let’s briefly spend a bit of time on tracking quality.
The tracking was pretty good. We know some investors questioned whether a start-up ETF manager could really run ETFs without a bigger parent infrastructure. To that, we say an emphatic “Yes!”. Splitting the ETF universe into mega-cap, broad and new economic exposures, we can see comparative tracking difference and tracking error statistics for a few ETFs. 2803 HK tracked its index best over the YTD and 1Y period and had the lowest TE. 3173 HK also tracked well, but had a higher TE due to suspensions and some stocks following outside Stock Connect. Interestingly, we saw lower TEs in the mega-cap space, which is to be expected given only 50 stocks in each ETF, but worse tracking difference. This is driven by higher fees causing a long-term drag on otherwise high quality TE portfolios. The Premia ETFs have a total expense ratio of only 0.5%, among the lowest in this space.
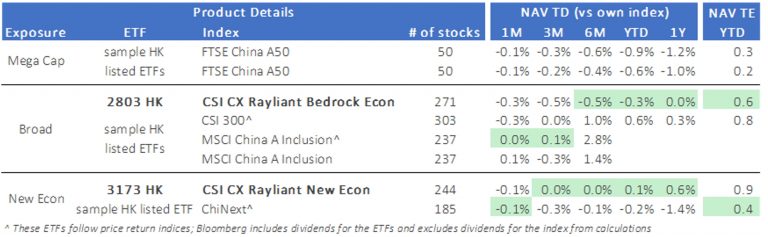
Source: Bloomberg as of 23 Oct 2018
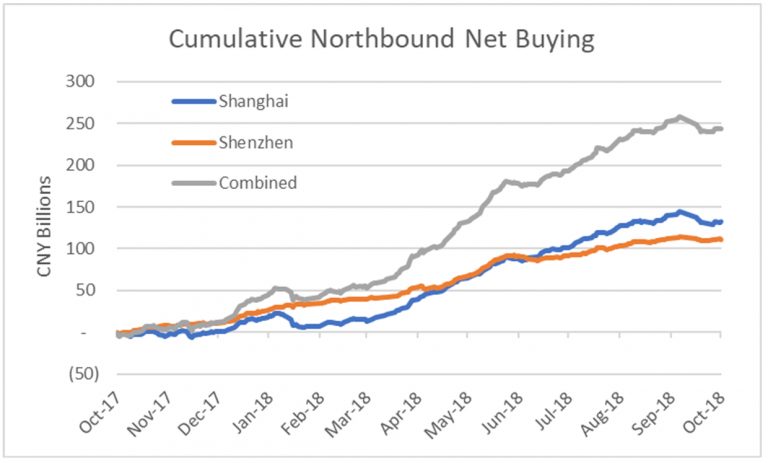
On a positive note, China A-shares were finally added into MSCI equity indexes at the end of May, opening the world’s second-largest stock market to global investors. This marked a new milestone for China’s capital markets, which as a reminder have only been around for less than 30 years (the first A-shares stock listed in Shanghai in late 1990). To facilitate foreign investment into A-shares, regulators relaxed QFII/RQFII rules by removing lockup periods for investment principal and allowing currency hedging onshore. In addition, the northbound daily quota of Stock Connect was increased from RMB 13 billion to RMB 52 billion, ensuring foreign investors could get sufficient exposure in China A-shares. And they’ve done so, investing approximately 250B CNY (30B USD) into A-shares through the Stock Connect Northbound channel over the last 12 months. This has driven foreign ownership to ~2.9% of total China A-shares market cap, but more importantly to ~7.6% of China A-shares free-float.
Source: Bloomberg as of 23 Oct 2018
Market recap
Our China A-shares ETFs had a good run on the back of solid growth in China’s macro economy, decent earnings growth and strong renminbi. At least in their first 3 months. Since then, the China A-shares market tumbled amid a new clampdown on shadow banking and worries of liquidity overtightening from continued deleveraging. As you can see below, there is a clear relationship between CSI 300 returns and China’s overall money supply growth, which has continued to slowdown to nearly record lows. Investors were also concerned about the increasing defaults in the corporate bond market. Externally, the noise of a trade dispute kicked in when the US President imposed steep tariffs on steel and aluminum. The fact that the US began to clamp down on Chinese investments into the US and started to levy tariffs on a broad range of its imports from China did not help.
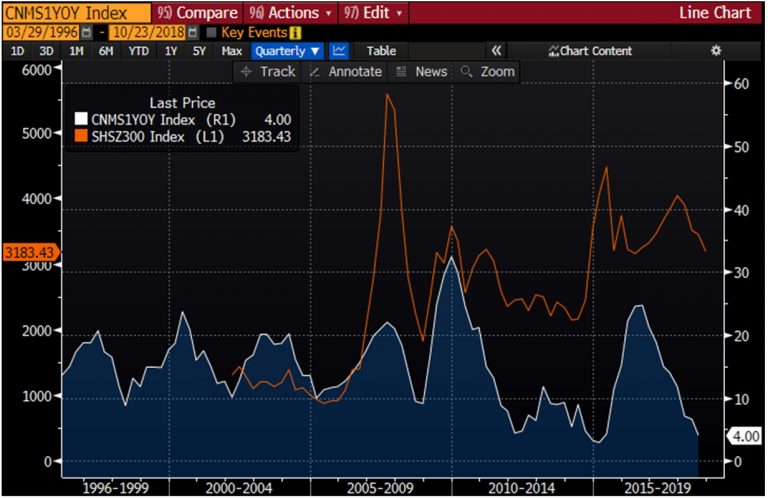
Source: Bloomberg as of 23 Oct 2018
On a positive note, China A-shares were finally added into MSCI equity indexes at the end of May, opening the world’s second-largest stock market to global investors. This marked a new milestone for China’s capital markets, which as a reminder have only been around for less than 30 years (the first A-shares stock listed in Shanghai in late 1990). To facilitate foreign investment into A-shares, regulators relaxed QFII/RQFII rules by removing lockup periods for investment principal and allowing currency hedging onshore. In addition, the northbound daily quota of Stock Connect was increased from RMB 13 billion to RMB 52 billion, ensuring foreign investors could get sufficient exposure in China A-shares. And they’ve done so, investing approximately 250B CNY (30B USD) into A-shares through the Stock Connect Northbound channel over the last 12 months. This has driven foreign ownership to ~2.9% of total China A-shares market cap, but more importantly to ~7.6% of China A-shares free-float.
Source: Bloomberg as of 23 Oct 2018
Stepping into the second half of this year, market sentiment declined further due to the sell-off in global emerging markets, triggered by the drastic depreciation of the Argentine Peso and Turkish Lira. This came at a bad time, as investors were already facing multiplying challenges – quantitative tapering in the US and Europe, prospects of a global trade war, and political uncertainties in places such as Brazil. To support the market, China’s government fine tuned monetary policy from tightening to neutral and even reduced the RRR on three separate occasions so far this year.
Factor behavior
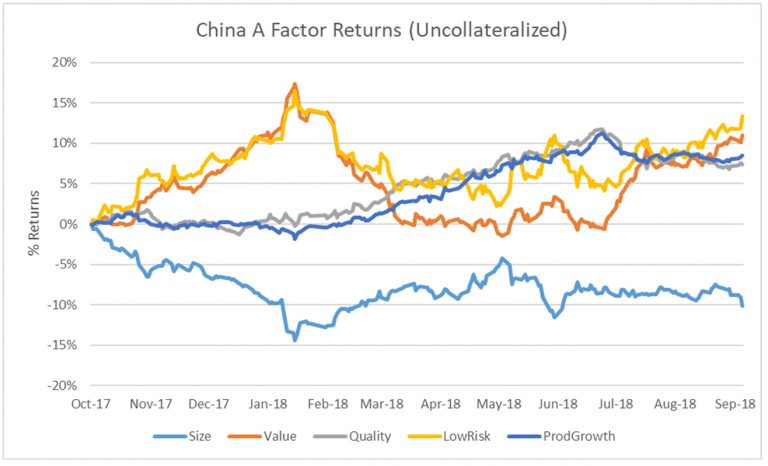
On the factor front, size was the main detractor from returns in the past 12 months. The bulk of underperformance occurred during 4Q17 and early January 2018, with the factor trading flat from that point on. This explains the better performance of mega-cap indices tracking the top 50 stocks relative to mid-to-small cap indices such as CSI500 or ChiNext. We saw this reflected in the ETF performance charts above as well. Both value and low risk did great from late October 2017 to late January 2018 during the market rally but lost their effectiveness when the market began to tumble during the first half of the year. In the second half so far, with investors looking to sell recent winners as the market plummeted further, they began to outperform and remain up through today. Interestingly, quality and company fundamentals were not a focus for investors during the bull run. But as market sentiment cooled from January onward, the market’s flight to quality resulted in the quality factor steadily contributing to returns. 2803 HK makes use of all four of these factors, thus explaining its better risk-adjusted return profile since inception. Value, quality and low risk contributed positively to returns, with size detracting from returns during the year.
3173 HK does not focus on value and low risk, but is exposed to quality and size. Quality is built into the index screens and size happens naturally given its tilt to new economy sectors. The other major contributor to returns is the productive growth factor, which contributes to the weighting mechanism in the index for 3173 HK. Product growth looks at profitability, inverse asset/book growth and R&D to identify growing companies that are managing balance sheet bloat well and was a consistently positive contributor to returns over the last 12 months
Source: Rayliant Global Advisors, as of 16 October 2018
Outlook
Going forward, we see a deceleration in China’s macro economic picture but believe the economic remains healthy overall. We believe the market has priced in quite a lot of the trade war, if not all of it by now. CSI 300 has underperformed broader MSCI Emerging Markets by ~10% over the last 12 months and is currently trading at 1 standard deviation below its historical average based on forward PE. Fundamental valuations now make A-shares attractive, and that’s without a value tilted strategy such as our Bedrock Economy ETF, which has a forward PE of ~9x. Importantly, these low valuations are accompanied by low-teen earnings growth expectations, suggesting that sentiment, not fundamentals, have driven the move down.
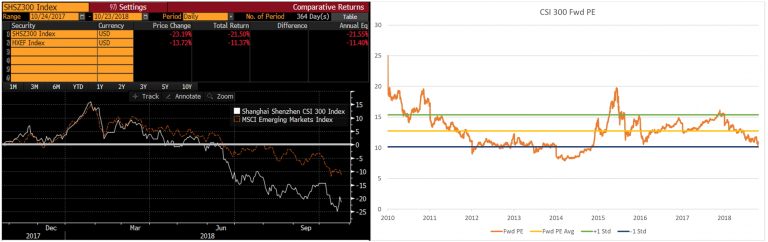
Source: Bloomberg as of 23 October 2018
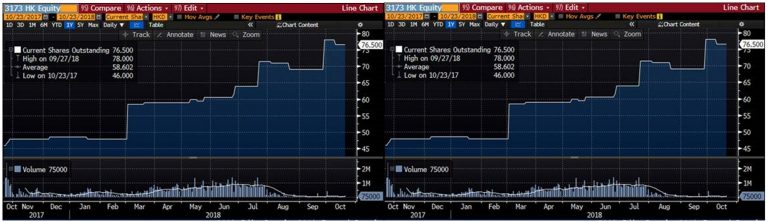
In terms of flows, we have seen foreign investors begin to increase their onshore exposure through A-shares ETFs listed in HK/overseas in the past few months, despite the negative market sentiment. The trade war remains unclear in the short-term, but potentially gets more clarity after the US mid-term elections in early November. Going forward, investors are getting used to the new normal of a background of continuing trade disputes. Once this uncertainty is no longer a new element creating surprises, the market may shift its focus to fundamentals and begin to realize the potential of China-A. China’s GDP is still growing at ~6% in macro terms and some major developments such as domestic consumption, urbanization, manufacturing upgrades and technological advancement remain intact. Foreign investors’ flows will continue to be a catalyst in medium-to-long-term as FTSE just announced the inclusion of China-A in its indexes while MSCI is reviewing an increase of the weighting factor from the current 5% to 20% next year. In addition, the Chinese government is closely monitoring market conditions and is actively introducing select favorable policies such as tax cuts to boost consumer confidence and accommodative loans/funds for private enterprises.
If investors can look beyond these couple of months and look at China for the medium-term, current market conditions offer an attractive entry point to China A compared to developed markets and other emerging markets. Our Bedrock Economy ETF (2803 HK) would be suitable for investors seeking to build an A-shares position in quality China blue chips across all sectors with the intention of targeting excess return vs a pure market-cap passive strategy. Its diversified approach should benefit from a recovery in the real economy and the overall stock market. On the other hand, the New Economy ETF (3173 hk) helps investors capture China’s future growth through quality companies focused in consumer, technology, healthcare, communication and selective industrial sectors. This strategy is similar to many active funds, which mainly focus on stock picking and do not reference a particular benchmark, preferring China’s new economy growth story over the long-term.
Regards,
David