
Be careful what you wish for. The low volatility that markets have been enjoying might actually be signalling trouble ahead.
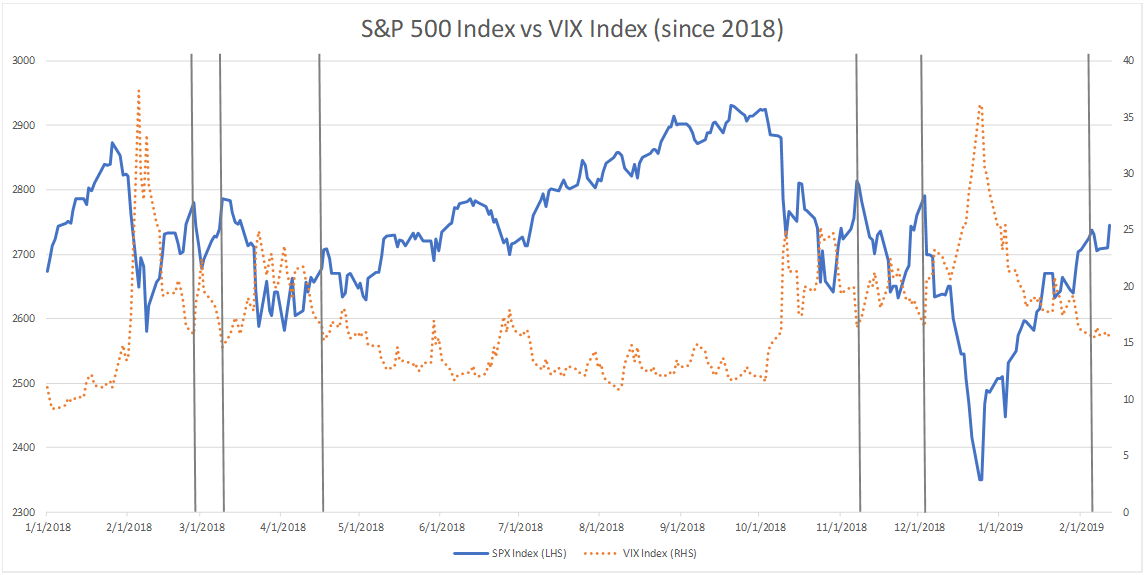
The CBOE S&P 500 Volatility Index (VIX) more than halved from a high of 36.2 on Boxing Day (26 December 2018) to around 15 early February. But technical indicators are warning markets may have become too complacent, and another round of fear and loathing could be looming for risk asset markets.
History doesn’t have to repeat itself. But as Mark Twain said, “it often rhymes”. Consider the history of the VIX over the past 12 months. Every time the VIX descended from elevated levels below 16 the S&P500 has taken a dive.
26 February 2018: VIX hit a low of 15.8. The S&P 500 (session high to session low) lost around 5% in four days
9 March 2018: VIX hit a low of 14.64. The S&P 500 lost around 7% in a little over three weeks
17 April 2018: VIX hit a low of 15.25. The S&P 500 lost over 4% in a little over 2 weeks
7 November 2018: VIX hit a low of 16.1. The S&P 500 lost almost 7% in about 2 weeks
3 December 2018: VIX hit a low of 16.44. The S&P500 lost about 16% in 3 weeks
6 February 2019: VIX hit a low of 15.38. The market “jury” is still deliberating.
 Source: Bloomberg, as of 14-Feb-19
None of this is science. It is a simple observation of market action. To me, it speaks of a nervous market that has become uncomfortable with gains on the risk asset markets. It is a market that seems uncomfortable with the length and the drivers of the bull market from 2009. More on that later.
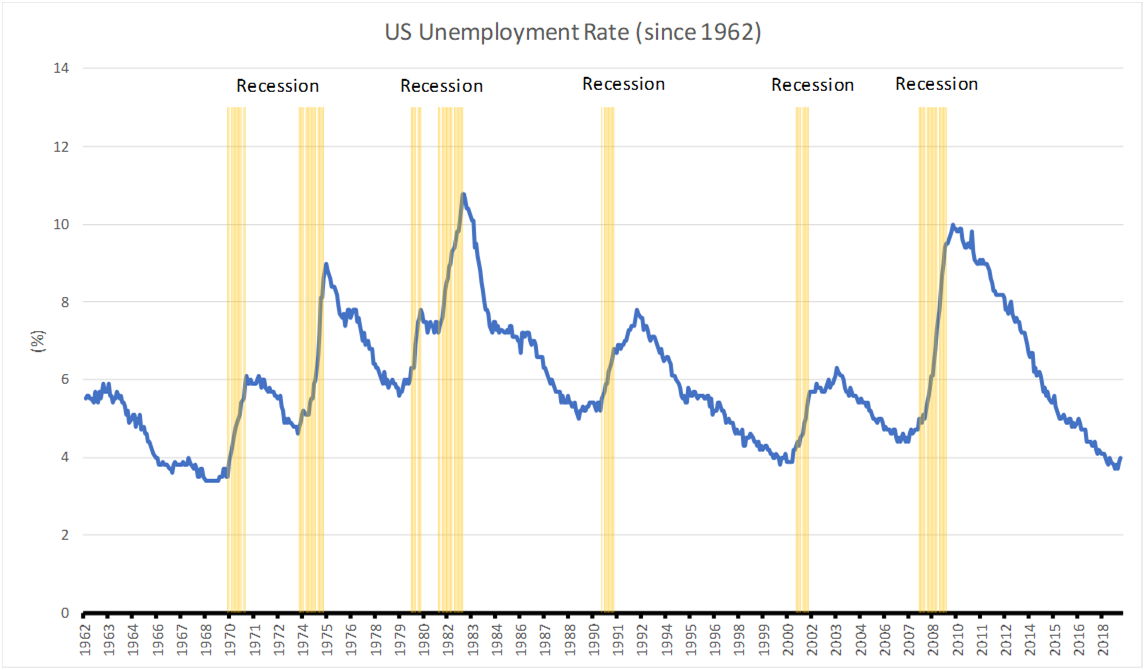
Another piece of good news which should be looked at past face value is US unemployment. Over the past 12 months, the jobless rate in the US has struggled to break below 3.7%. Again, this is not science. It’s another observation: Over the past 60 years, US unemployment has not been able to break significantly and sustainably below 4%. This has historically been the level at which US unemployment troughs. And that bottoming of unemployment has always been followed by recession.
February 1969: Unemployment bottomed at 3.4%. That was followed by the recession of 1969-1970
October 1973: Unemployment bottomed at 4.6%. That was followed by the recession of 1973-1975
May 1979: Unemployment bottomed at 5.6%. That was followed by the recession of 1980
December 1980: Unemployment bottomed at 7.2%. That was followed by the recession of 1981-1982
March 1989: Unemployment bottomed at 5.0%. That was followed by the recession of 1990-1991
April 2000: Unemployment bottomed at 3.8%. That was followed by the recession of 2001.
March 2007: Unemployment bottomed at 4.4%. That was followed by the recession of 2007-2009.
 Source: Bloomberg, as of 14-Feb-19
September and November last year, US unemployment fell to lows not seen in long time – at 3.7%. It has since popped up to 3.9% (December 18) and 4.0% (January 19). With the US House of Representatives in the hands of the Democrats, a fiscal cliff is looming. Of course, I don’t know that unemployment can’t go lower. But it will struggle against fiscal headwinds.
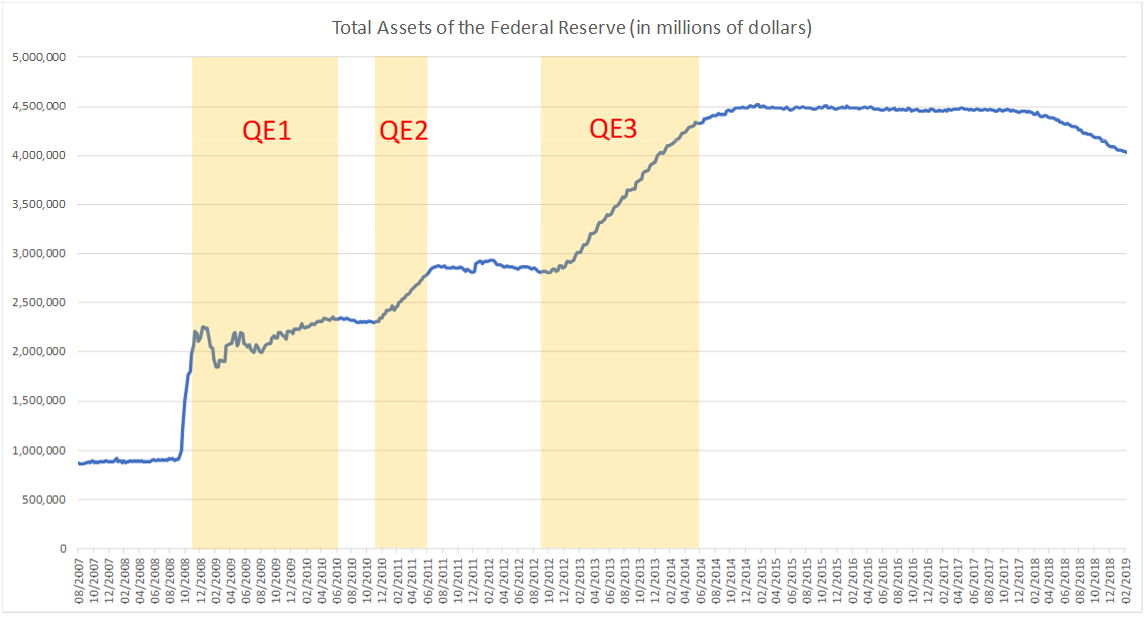
A 10-year bull market is a long time by the standards of more recent market cycles. But beyond just chronologically ageing the cycle, it is useful to consider the drivers of that cycle.
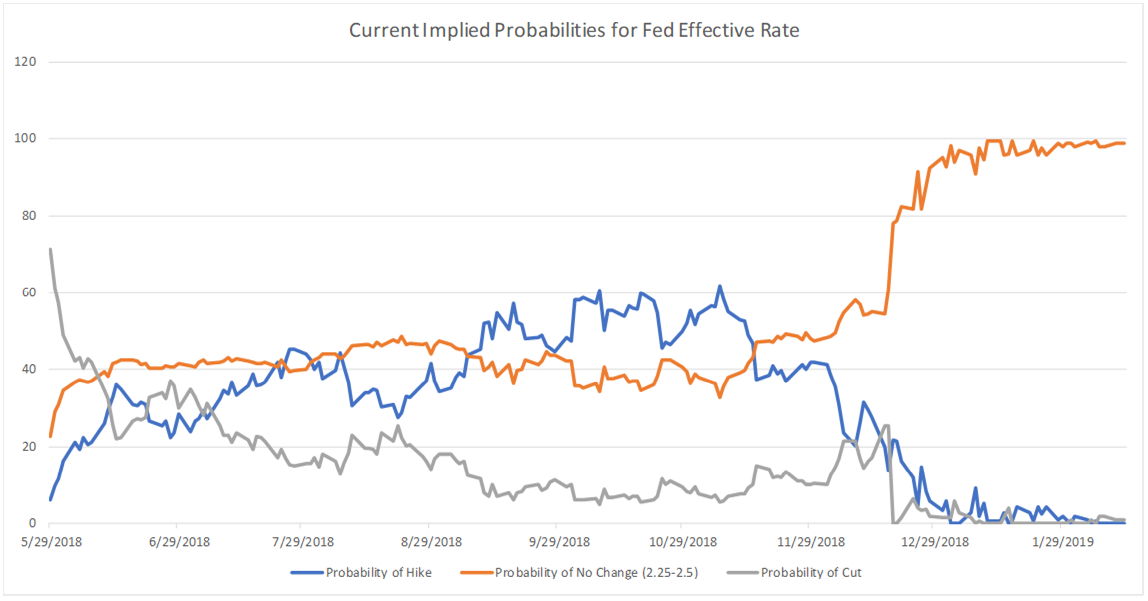
Quantitative Easing has reversed to Quantitative Tightening, however modest it might be. The US is well out of zero interest rates. Sure, the Fed is either going or is already on pause. But don’t forget the impact on net present value of the rates already implemented thus far.
 Source: Federal Reserve, as of 14-Feb-19
 Source: Bloomberg, as of 14-Feb-19
And the corporate benefits of Donald Trump are already in the price. However, the uncertainties of his mercurial and combative politics are difficult to price. That is, tax cuts and fiscal stimulus are working their way out of earnings and economic growth. But trade tensions between the US and just about all its major trading partners, political gridlock in Washington, and dysfunction within the White House are growing.
Yes, a positive outcome to US-China trade talks could buoy sentiment. But it is difficult to imagine a definitive solution in this environment. Already, President Donald Trump is talking about another 60-day extension of the tariffs deadline to allow for more talks. Even at the end of those 60-days, the best I suspect we can hope for is a band-aid – with Beijing buying more stuff from the US and Washington putting a pause or cap on threatened tariffs. The much more difficult issue of China’s state-business linkages will remain a problem for another day. A truce will perhaps sound the bell for the end of round 2 in a 15-round world heavyweight title match. But there will very likely be many more rounds of trade fisticuffs ahead.
Markets will understand that. And they are going to again fear the future. It’s not the good news past that drive markets. They will be driven by anticipation of what’s coming next.
Portfolio implications
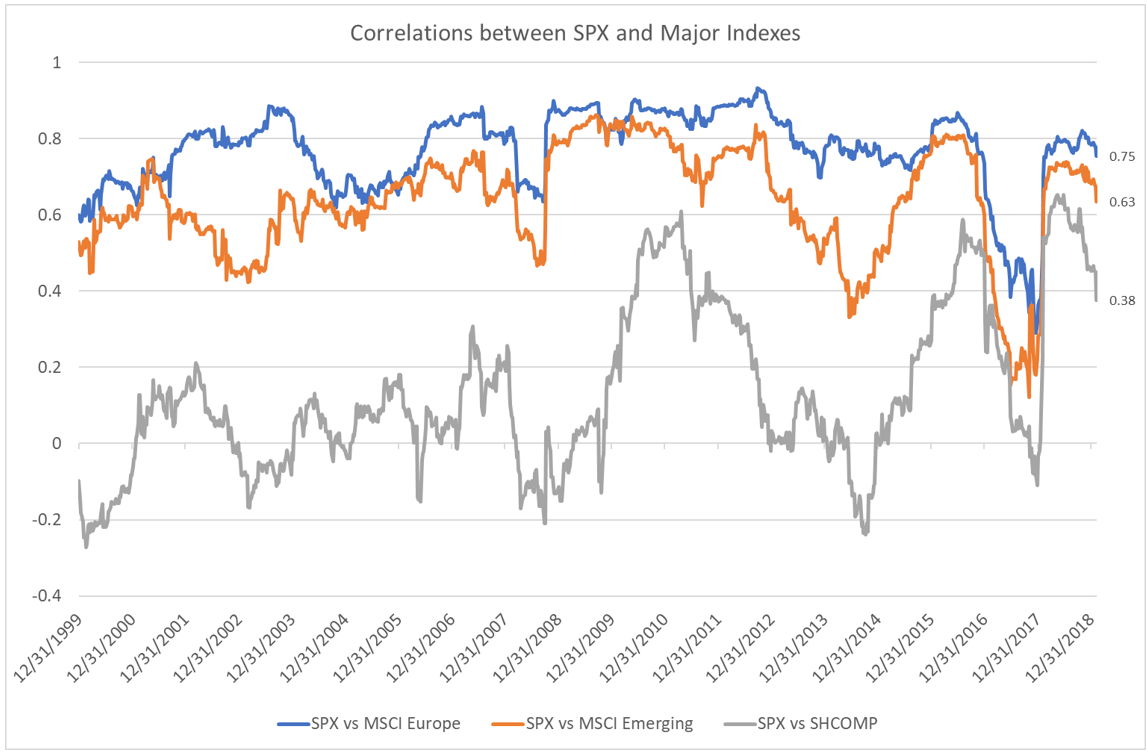
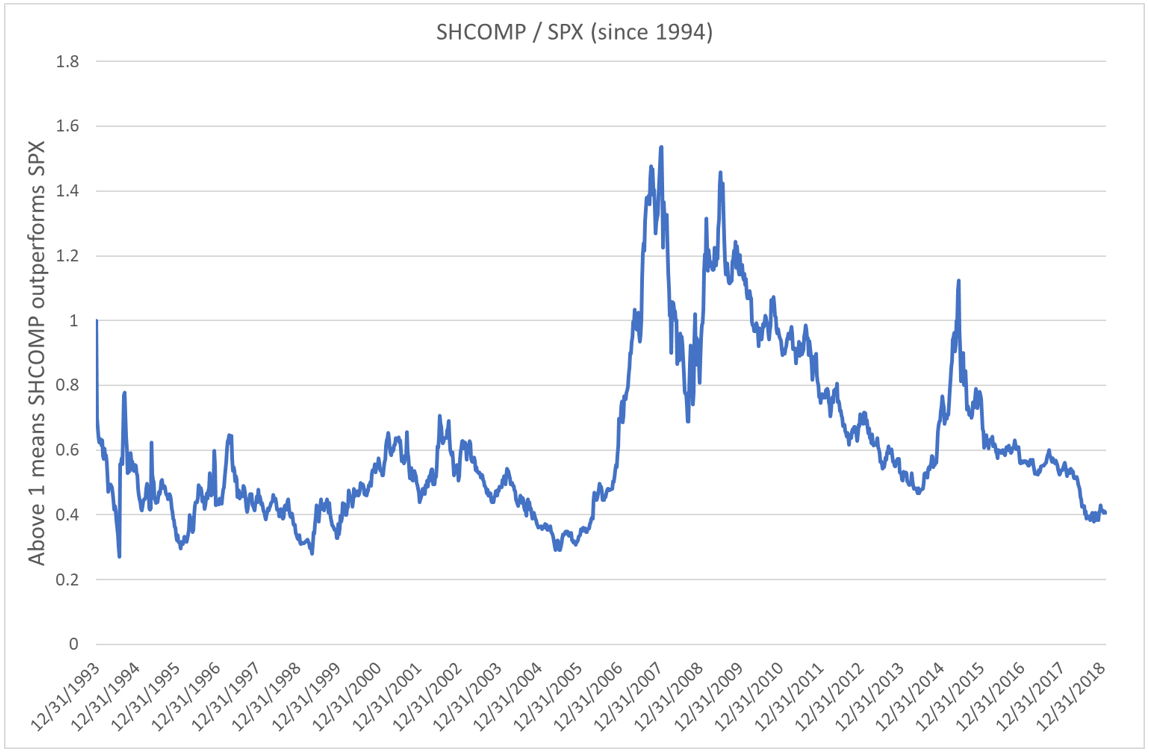
Inverse ETFs are an obvious solution in this environment for traders. More conservative, long-only portfolios might want to cut equities to underweight. That would be driven by underweight positions in correlated US and European equities. Given their lower valuations and lower correlations against the S&P 500, investors might want to consider neutral weights for Emerging Markets and Asia ex-Japan. Note the Shanghai Composite Index's relative performance over the past quarter of a century (SHCOMP/SPX). That has traded in a wide sideways range. That relative performance is now close to the bottom of that range.
 Source: Bloomberg, as of 14-Feb-19
 Source: Bloomberg, as of 14-Feb-19
With the possibility of stagnant or lower 10-Year US Treasury yields in the face of slowing economic growth - and possible recession - investors might want to increase weights there. Overall, investors should look at an overweight position in bonds to anchor a portfolio lightened on equities.
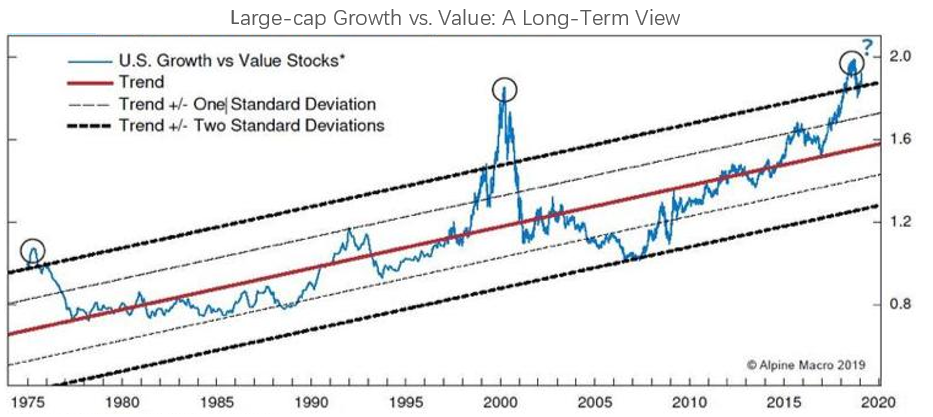
Another example of “too good to last” is the extreme of that the relative performance of US growth versus value stocks. That has blown through 2 standard deviations. It’s starting to look like year 2000. Switch to defence – out of growth into value.
 Source: Alpine Macro, as of 14-Feb-19
