![[WORKING PAPER] Equity Duration: What cease to hold and what still does? – Relative Perspectives on China vs. the US and the New vs. the Old](/_next/image?url=%2Fbbg_post.webp&w=3840&q=75)
INTRODUCTION
The concept of “equity duration” first became popular in the 1980s from Marty Leibowitz. In his paper ‘Total portfolio duration: A new perspective on asset allocation’ [1986], Leibowitz showcased a beautiful relationship of using empirically estimated variances and covariances of equities and bonds to estimate equity duration:

Unlike the previously popular derivation from dividend discount valuation models (DDM) that fail to deliver evidence in real life, Leibowitz ‘s formula has held well when compared to observed market behavior in the period he studied (late 80s to early 90s), which also led him a Graham and Dodd awards for this paper.
However, the historical positive relationship between bonds and equity returns cease to hold as evidence against such has accumulated in significance over the past decade. One school of thought of the sign turning is primarily due to the uncertainty about inflation and real interest rates as well as by co-movement between inflation, real interest rates and dividend growth (Pericoli, 2019). Other possible explanations include the sentiment that the low interest rate environment had, to a certain extent, made bond investments a return-seeking asset allocation decision to a risk-on vs. risk-off allocation decision.
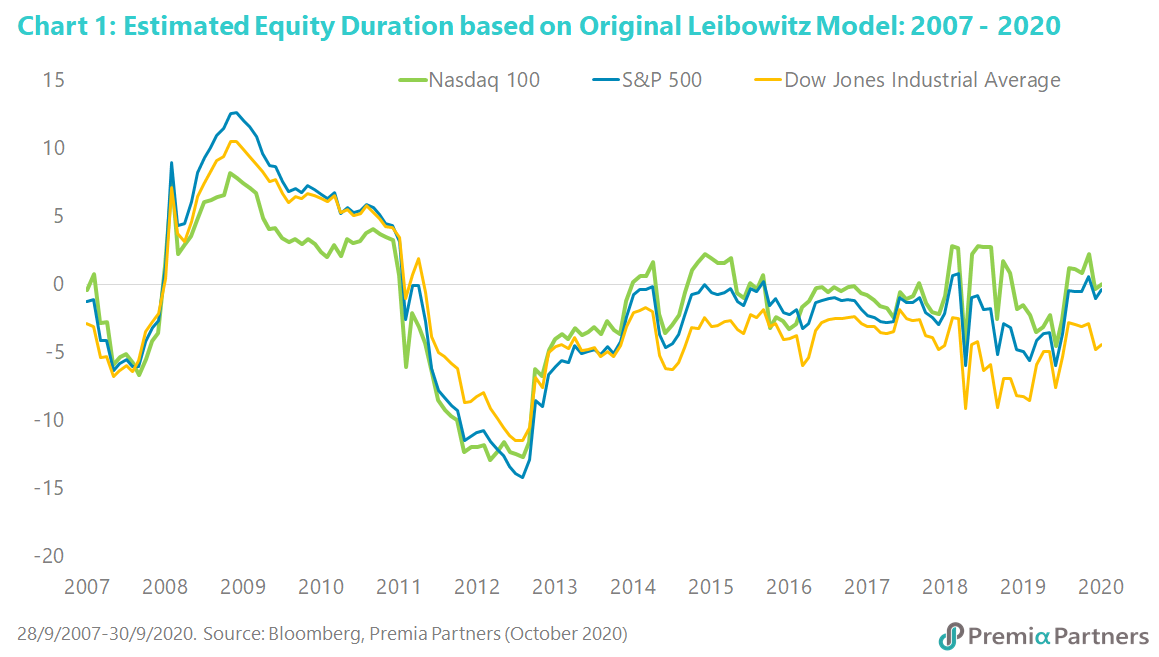
In Chart 1, we applied the methodology outlined in Leibowitz’s original paper to the Nasdaq 100, S&P 500, and Dow Jones Industrial Average indices, using Bloomberg Barclay’s US Aggregate Bond Index as the bond benchmark. Unlike the historically estimated range of 2 to 6 years of equity duration, we observe a sign swing along with an extended period of zero to negative “duration”.
In his later book ‘Franchise value: A modern approach to security analysis’ (2004), Leibowitz in fact acknowledged these issues and decades-long paradox of going back to DDM as follows: “From standard DDMs, one would expect equities to exhibit super-sensitivity to changing interest rates. However, while equities do statistically exhibit some correlation with interest rates, it is quite low, very unstable, and even switches signs from one regime to another. In other words, the market experience has no resemblance to the extremely long ‘stretch durations’ predicted by the DDM…” and hardly resemblance of what he produced back in the 1980s.
THE NEW SCHOOL OF THEORY - FRANCHISE VALUE
A new framework, building on the foundation of DDM but not using the exact DDM, was proposed in this book. It is also a school of theory that we tend to share similar beliefs from a fundamental perspective, especially given the innovation driven structural transformations globally from conventional accounting, tangible asset based valuation approach, to intangible asset based valuation approach for new economy plays which is a much more complete and relevant approach. Two concepts were raised in this framework, which for simplicity can be thought of as a decomposition of a firm’s business value from what is already in existence versus what is perceived to happen in the future:
· The Tangible Value (TV) is derived from existing business operations and investments without additional further capital:
TV = r * Book Equity / k,
· The Franchise Value (FV) is associated with the firm’s future investments that leverage the firm’s unique characteristics into expected future growths
FV = Franchise Factor (FF) * Growth Equivalent (G) * r * Book Equity
Where r is the return-on-equity and k is the nominal risk-adjusted discount rate, or usually taken as the cost of equity capital; FF = (r-k)/rk and G = g/(k-g)
Derivations aside, there are a few rather intuitive conclusions based on the framework:
· TV has bond-like characteristics, and its sensitivity to interest rate changes, regardless of sources, behaves similar to coupon bonds
· FV, in contrast, is more associated with the source of interest rates – despite that FV is less sensitive to inflation as firms can partially flow through such into future business decisions, the nominal rate changes can be caused by movements in other macroeconomic variables – which then get directly or indirectly passed into the return on equity (ROE), growth, and cost of equity capital.
· In general, the greater portion of FV, the less sensitivity to interest rate changes. Unlike fixed income streams, companies in fact have the flexibility to adapt future strategies and investments for their franchises and the investors have the flexibility (liquidity) to update expected valuation accordingly.
THE “RELATIVE” PERSPECTIVE OF FUTURE VS. TODAY
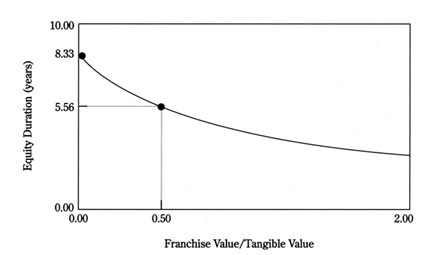
While the negative correlations may have distorted the historic award-winning findings in absolute terms, there are still interesting relationship we can observe from the chart above from a relative perspective. From the FV/TV framework described above we would expect growth stocks to have higher FV and therefore lower sensitivity to interest rate changes. Before we dive further into this concept of relative duration risk, or relative interest rate sensitivity, let us first derive the expression of the FV/TV using the previously defined variables in equation x. We get:

As we can see from the equation, the ratio of FV/TV is fundamentally dependent on three key elements:
· g: the firm’s growth rate
· k: the firm’s average cost of capital, which is used as the risk-adjusted discount rate
· r: the firm’s ROE, which in an ideal world should always be greater k for any new investments to make sense
With the decomposition of the Franchise Value framework into a concept of “relative duration risk”, we see the sign-distorted estimate of duration risk still nicely holds from a relative basis if we consider only the magnitude.
If we consider only the magnitude regardless of direction, it is consistent with what we have observed over the decade long data above if we compare the Nasdaq Index vs. the Dow Jones Industrial Average Index.
The “equity duration” of the S&P index revealed an interesting observation with regard to paradigm shifts as the composition of the index has shifted from traditional old economy companies (Financials, Energy, Industrials) to a technology dominated new norm, and therefore has moved increasingly closer to that of Nasdaq. Some related US-centric literature on equity duration of cyclical vs. non-cyclical sectors have also suggested shift from bonds to high-dividend-yield defensive stocks throughout the business cycles. In fact, traditional utility companies, which are often considered as defensive, yield-generating stocks, is a good example of companies whose business value are mostly tangible.
HOW ABOUT CHINA?
Applying the Original Leibowitz Relationship to Analyze a Relative Perspective of China vs. US
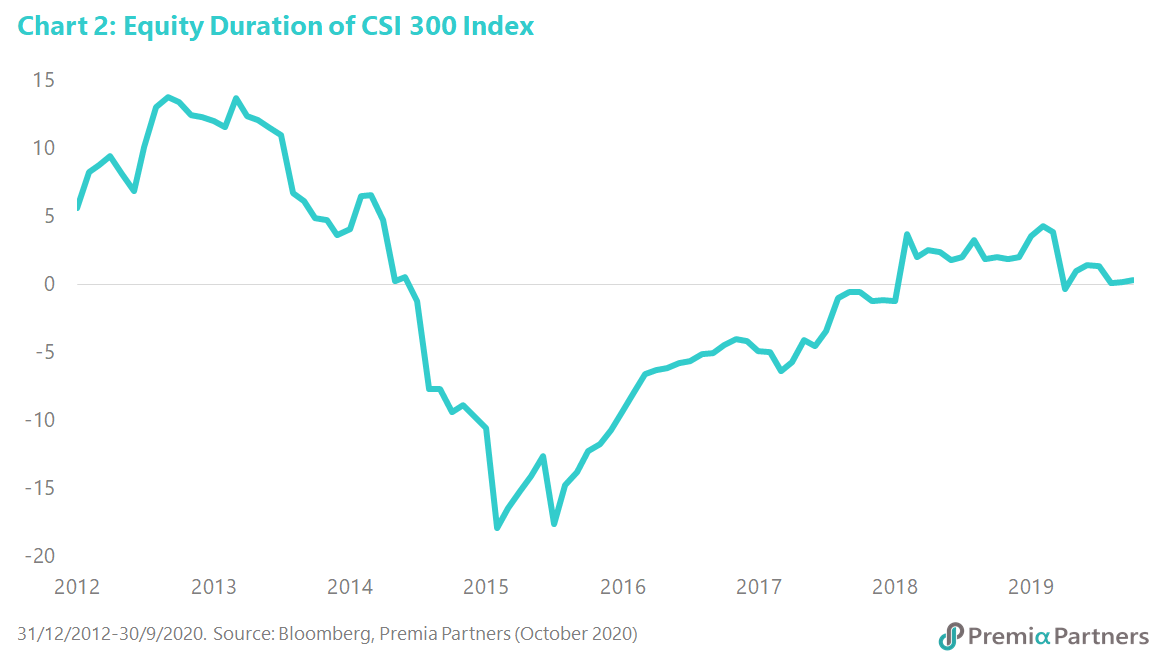
By applying a similar analysis, we observed similar pattern of the Chinese domestic A-shares flagship index CSI 300 versus the China aggregate bond index with sign swings as that of the US market (Chart 2). Further, the two markets’ estimated equity durations are very close using the original Leibowitz model, considering sensitivity to the respective domestic market only (0.33 for CSI 300 versus 0.44 for S&P 500 as of Sep 30th, 2020). One other interesting note is that the “equity duration” pattern of the Chinese equity market is very similar to that of the US during the late 2008 to early 2016, which was a period corresponding to the quantitative easing efforts.
As per its definition, key determinants in the traditional model include the correlation, the ratio of taking equity risks over bonds and average bond duration. We would first consider an isolated world where the “duration risk” in concern for the China market is merely of its domestic rates, the increasing cross-market correlations are kept in mind throughout the analysis but comes with a discussion on implications only towards the later sections.
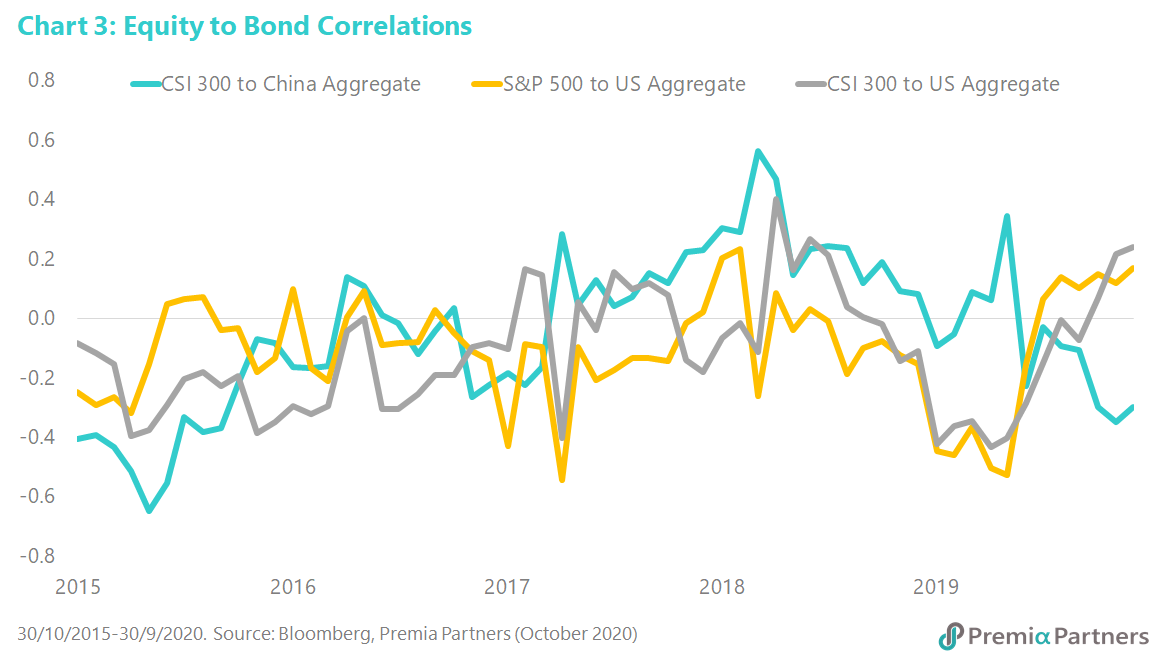
First, we examined changes in asset correlations of US Equity vs. US Aggregate Bonds, China A Equity vs. China Aggregate Bonds, and China A Equity vs. US Aggregate Bonds (Chart 3).
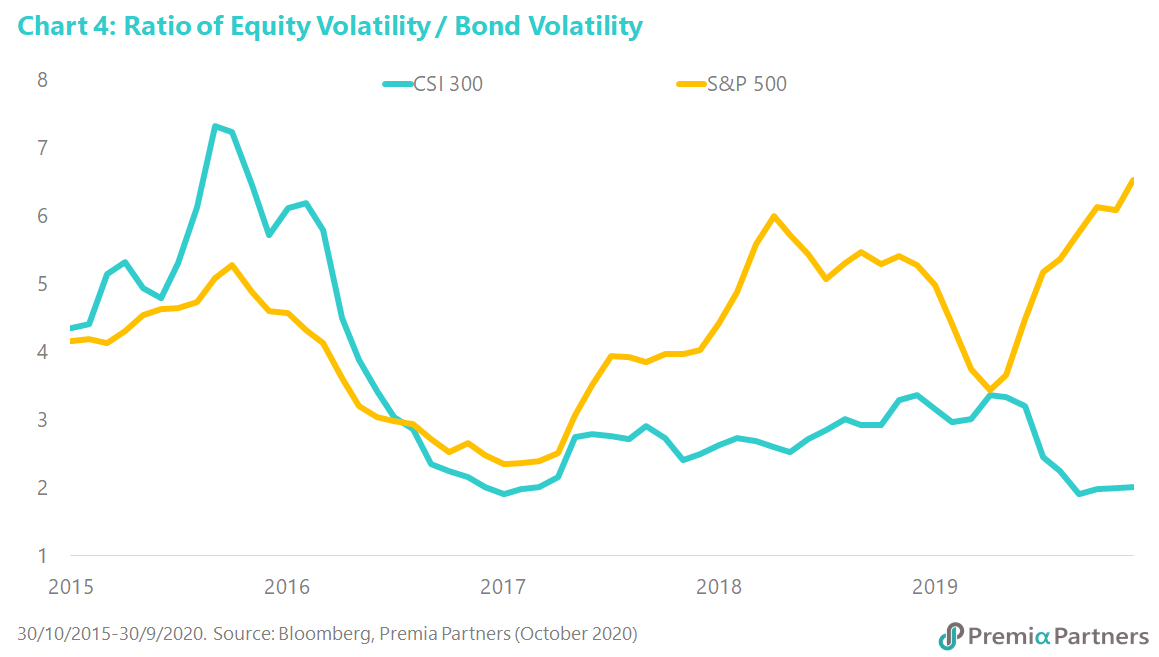
Next, we examine the shift of domestic equity risk over bond risk (“equity risk multiplier”) over time. In this case, the China vs. US results are dissimilar. For the US market, we observed a spike up to almost 7x YTD, which likely resulted from a combination of historical high of the S&P, extremely low interest rates, and risk-on vs. risk-off allocation decisions. The “equity risk multiplier” for China A shares, on the other hand, had been stable around 3x for the past three years before it recently went down to about 2x (Chart 4).
Lastly while the most straightforward determinant is average domestic bond duration, the duration of US Aggregate Bond Index is at 6.4 while the China Aggregate is around 5.4 as of Sep 30th, 2020. In fact, the actual tenure of Chinese corporates’ borrowing is likely even lower. This is unsurprising as the financial ecosystem in China is still in the process of market liberalization, and access to debt capital markets and bank borrowings have historically been more tightly regulated with funding availability typically tilted towards short-term borrowings only.
All in all, compared to the US market, China equity has comparable average correlation to domestic bonds (and currently lower), a lower “equity risk multiplier” to domestic bonds, and a lower bond duration. Therefore, from a relative perspective, we expect China equity to have lower duration risk than US equities.
If we were to consider the US interest rates and therefore US Aggregate bond as the subject matter to interest rate sensitivity instead, China equity duration risk is simply the US equity duration risk multiplied by China A shares equity beta to the US. A regression based on 5 years of historical data from Oct 2015 to Sep 2020 indicates a beta of 0.97, suggesting that the China A equities would have slightly lower duration risk than that of the US. For those who prefer to anchor on absolute numbers, this would translate to 0.44 * 0.97 = 0.42 vs. the previous figure of 0.33 that considered only domestic rates. The figure in reality probably falls somewhere in between the range with both domestic and US rates in play. Alternatively, one could also run regression analysis of equity performance in relation to both domestic and US interest rates to examine the interest sensitivities. We can thus induce from the relative perspective, the interest sensitivity of Chinese equity duration vs. the US is generally lower.
Applying the Franchise Value Model to analyze a relative perspective of the New vs. the Old
The second relative perspective we would like to address is that of the New vs. Old economy. Empirical evidence suggested that different sectors have varying degree of sensitivity to interest rates, associated to cyclicality and dividend yields. In developed economies like the US, high dividend defensive sectors like Utility would historically be considered long duration as they attract more capital inflows when bond interest rates get lowered. Studies have found similar patterns in other defensive sectors such as Staples and Healthcare.
We first attempted to analyze industry-related patterns in China for each major fiscal rate change periods in history (Chart 5):
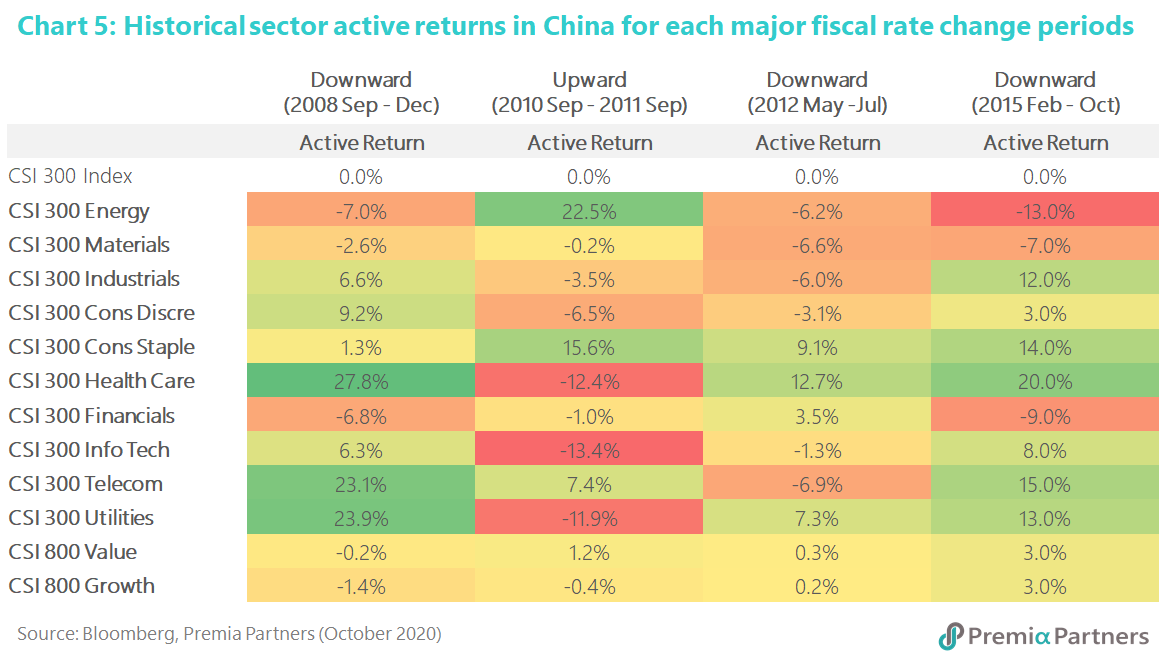
At a glance, we observed Utility and Healthcare seem to show consistently greater sensitivities while other sectors with large swings during certain periods such as Energy or IT may be due to mere volatility. We believe in fact one needs to be extremely cautious when interpretating the data above. First, this relationship shall not be taken as any sort of causality but just historical correlation. More importantly, if we take a more macro perspective above and beyond the numbers, there are a few things investors should notice when applying US or developed market concepts to China:
· The traditional definition of “Defensive” does not apply –
o Healthcare is a very young and fast-growing sector in China given the macro factors such as demographic development (aging population), urbanization and GDP per capital growth
o The low-volatility statistics also hardly apply to Chinese Consumer Staples. In fact, it contains stocks like liquor companies Moutai and Wuliangye which are retail favorites in China, much like Apple in the US
· The “Policy” effect most likely overrules the “Cyclicality” effect –
o Policy support can be huge tailwinds for certain sectors and outpower any other monetary or macroeconomic factors as these sectors typically would receive consistent policy support and better access to funding which are conducive to steady business growth – e.g. new energy, high-end manufacturing, technology.
o Some sectors are dominated by state-owned-enterprises (SOE), which can from time to time be subject to government directives as the ‘sacrificial lamb’ for “the people’s interest” over shareholder interests - e.g. Energy, Utilities, Financials. That said, the flip side of it is also that these are sectors that are “too important to fail” and would also typically be favored through tax subsidy, government contracts and other policy support measures.
o Thus, we cannot treat all SOEs nor non-SOEs as equals at all times, and it is necessary to address through the quantimental lens with local knowledge or “Chinese characteristics”.
Rather than using the traditional industry classification, we believe new economy sectors are those that generally tend to have less fixed assets (which would be associated with producing tangible value) but more investments into the future (which would hopefully turn to their franchise value). Thus, we take a more macro view of applying first principles to the component factors of g, k and r in the FV/TV ratios in order to develop our perspective on the New vs. the Old.
To examine the relationship of the change in FV/TV ratio with regard to the three factors each individually, we take the derivatives with respect to each as follows:

Where y =FV/TV, ci are non-negative constants for i = 1,2,3 per Franchise Value model definition
From the isolated relationships above, we can therefore expect companies with higher ROE, growth rate and lower cost of capital would tend to have higher FV and thus lower duration risk.
To analyze the equity duration in China, we first need to understand the “Chinese characteristics” of these 3 factors. We would like to focus on discussing the growth and cost of capital drivers as ROE is more of an end-product compared to the other two and relatively straightforward with global accounting standards applied.
Growth, as mentioned above, is as much driven by government policies as by fundamentals, if not more. The cost of capital for a Chinese corporate could also be very different from that of a US company. The Chinese regulators have tight control over companies’ access to capital markets through public offerings. On the other hand, access to debt capital markets are much harder for Chinese corporates versus that of US peers. Most of the debt financing comes from banks. For that reason, we in fact also analyzed the long-term Chinese equities performance versus the money supply (M2) though no significant evidence were found. In addition, the policy factor kicks in again as the government would occasionally instruct banks to expand (or tighten) financing to specific industries, or provide national or provincial subsidies in some cases to encourage and boost the expansion of certain sectors. ROE is more of an end-product compared to the other two and relatively straightforward with global accounting standards applied, but the important hidden factor here in China is Quality. During economic downturns, “Growth” companies that are either too small or extremely unprofitable would face going-concern issues and are unlikely to have adequate access to capital; likewise, highly-indebt companies would be subject to similar situations even if there is a leverage-inflated ROE.
As a result, high quality policy-supported growth companies in China shall have relatively favourable access to capital, better growth prospect and in general more robust, stable returns in the long run. To examine whether such hypothesis holds, we compared the index of our China New Economy strategy against that of the broad CSI 300 index (Chart 6):
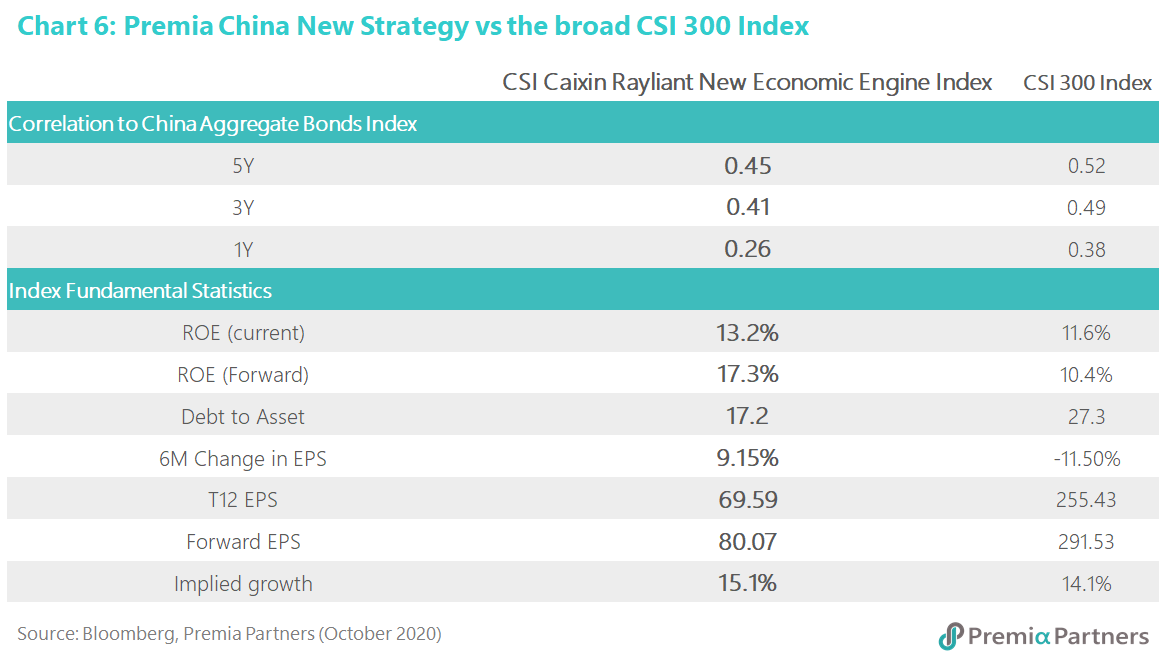
While this does not indicate causality or predictive power, the China New Economic Engine Index, which is constructed to capture light asset, high quality (low leverage, high profitability) policy-supported new economy companies in China, did experience lower correlation to bonds compared to CSI 300.
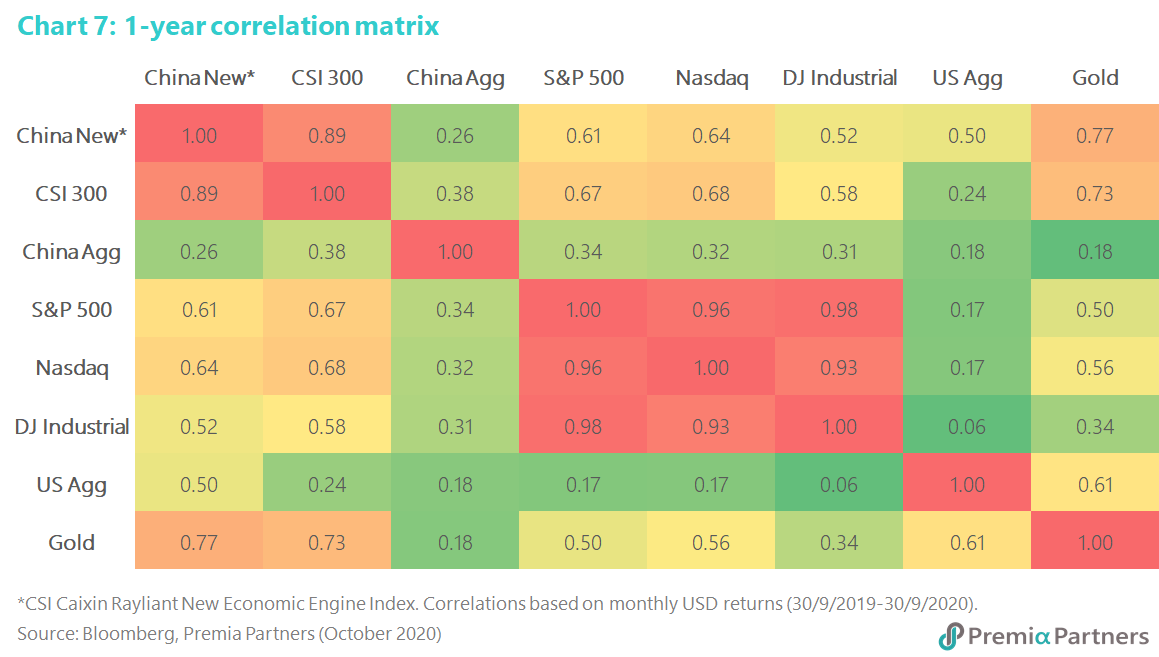
Relating back to the global scene, we take a total portfolio consideration to examine correlations of the broader range of global assets in the past twelve months (Chart 7). The movements of global asset correlations in the late COVID / post-COVID era has interesting observations. Notably, Gold experienced significantly higher correlation to other risky assets compared to the past when it is typically considered the choice of “flight-to-safety”. On the other hand, while correlation among global equity markets have increased, China Equities still exhibited relatively lower average correlation compared to the others. In particular, New China (which is represented with underlying index of our China New Economy strategy) demonstrated an average correlation of 0.42 to other global asset classes that is even lower than Gold (0.44), offering growth opportunities along with strong diversification benefits.
Other unique “Chinese characteristics” associated with equity durations
Observed correlations and economical intuitions aside, there is still little statistical significance from directly regressing the performance of the overall Chinese equity market against domestic and/or US interest rates. We think there are some other unique “Chinese characteristics” in play that may have distorted statistical relationships but are absolutely important for international investors to make note of – the most prominent ones would be the characteristics associated with the onshore Chinese equity capital market itself.
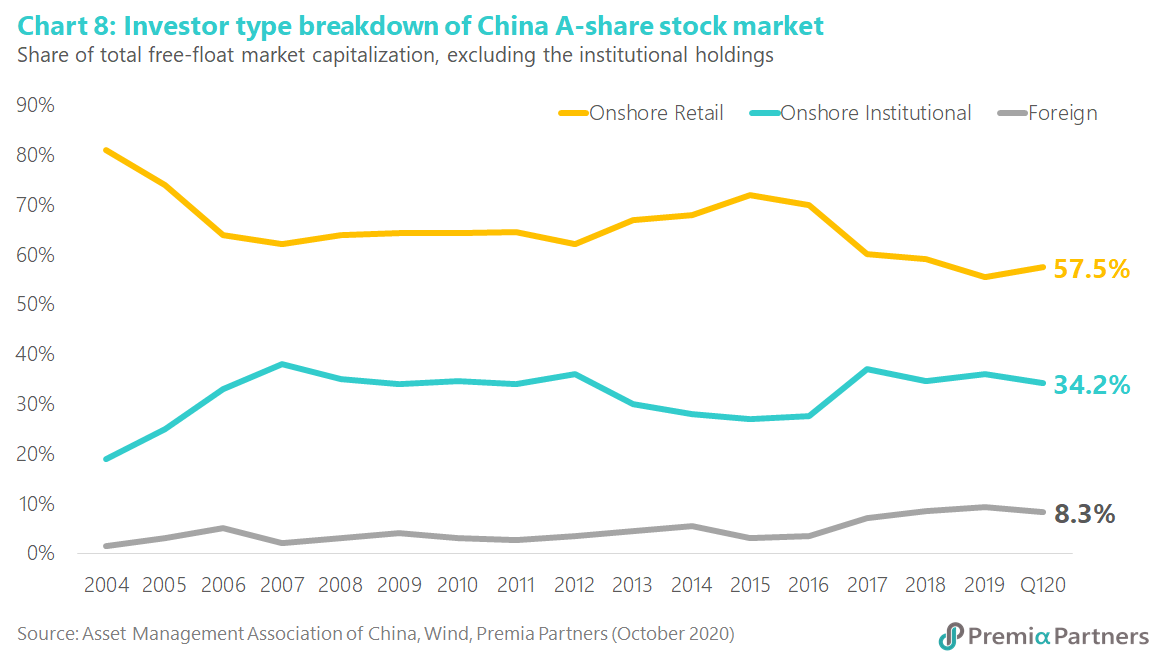
Unlike US equities, international access to China A shares only start to pick up in the recent decade from increasing QFII/RQFII quotas to launching stock connect programs, yet the overall foreign ownership of China A shares is still less than 10% of total free-float market capitalization (Chart 8). In addition, the China A shares market has been significantly driven by retail trading behavior compared to global counterparts. Decreased from over 80% in the early 2000s, retail investors’ share today is still greater than 50% of the total free-float market capitalization in China. Moreover, retail investors tend to trade stocks and even mutual funds more frequently, typically following news or themes. Nowadays, retail trading still accounts for about 80% of total value traded in the market. With the development of digitalization and financial technologies, investors in China can easily buy and sell mutual funds on their mobile phones through apps such as Alipay. A lot of local mutual fund managers therefore also tend to exhibit behaviors like retail investors to cater for the retail investor appetite. Many researchers have related studies on how such retail domination led to different market responses when applying findings from US or other developed markets to China, including our senior advisor Dr. Jason Hsu’s renowned paper “Anomalies in China A-shares” that served as the cornerstone to our two China A shares multifactor strategies. As index inclusion happens and the A-shares market increasingly open its doors to international investors, we would expect the share of foreign holdings to continue pick up. Unlike the retail, foreign institutional money is often considered as “smart money”. We noticed from flows that the top favorites of international “smart money” include a few familiar large-cap quality growth names such as Gree, Midea and CATL.
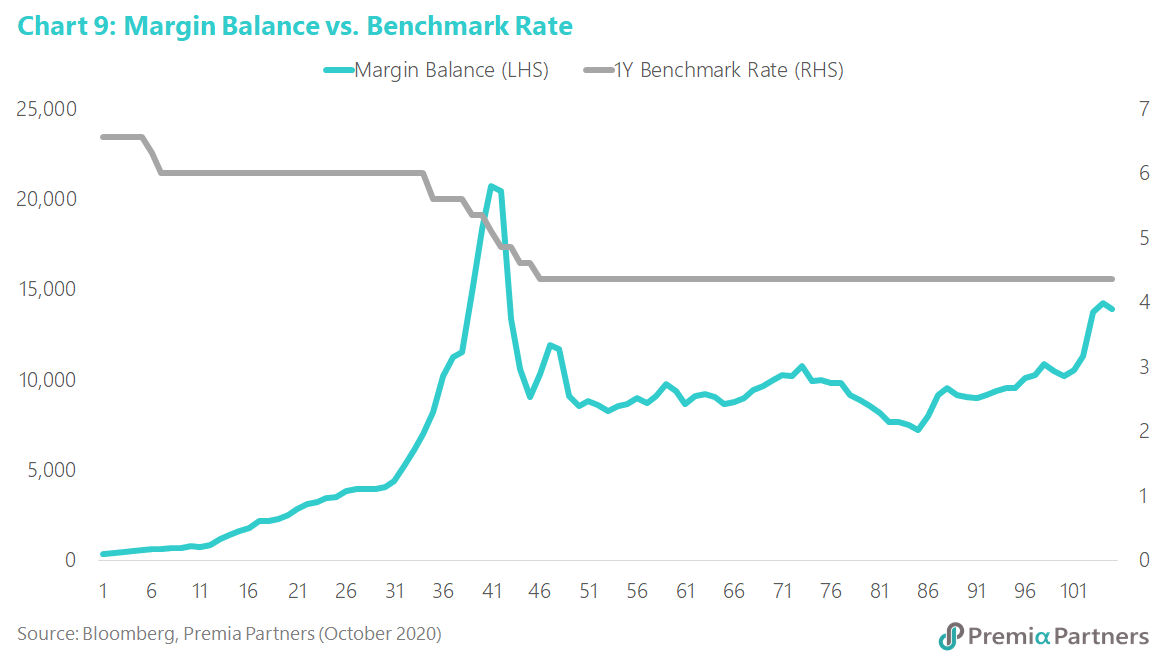
As such, interest rate sensitivity (or insensitivity) of the China A shares could come from any intermediate effect of interest rate changes to retail trading behavior. We examined the market’s total margin financing balance throughout the years versus the China’s 1-year benchmark rate as follows (Chart 9). Unlike the open market operations in the US, the Chinese would also pipe money into equity markets via guidance to bank lending or brokerage financings to encourage trading and therefore increase liquidity.
Furthermore, the change in interest rates could be priced into China’s equity market through other unique means in the financial system. Apart from equity capital markets and bank lending, listed companies could also obtain funding via packaged wealth management products and share pledges in the past throughout the whole “shadow banking” system, and all these shall have their own sensitivity to the domestic interest rate as well as other regulatory or policy changes. New economy growth companies whose value comes predominantly from their investments into future franchise value would also be exposed to different degrees of intermediate effect from the financial system. The more mature companies tend to have a larger portion of funding from bank loans or debt capital markets, and therefore relatively more sensitive to interest rate changes; younger growth companies, on the other hand, are likely to have a greater portion funded by equity and convertibles, which therefore would be less sensitive to interest rate changes but rather more sensitive to investor appetite and related capital flows.
CONCLUSIONS
From a total portfolio perspective, global asset owners and allocators are increasing wary about the overall portfolio sensitivity to interest rate changes and ultimately risk diversification. The concept of “equity duration” was raised long ago and has been subject to debate for decades. While some absolute calculations fail to work in today’s markets, we believe the economic and financial intuition underneath still hold. We took a renewed approach to analyze the relationships from a relative perspective and with an overarching objective of total portfolio risks in mind. With such, we arrive at the following key findings:
· China A equities are more moderately correlated to US equities, with a lower sensitivity to interest rate risks, and offer the appeal of lower correlated growth with US and developed market equities compared to most markets including in the recent year when correlation between global asset classes including gold surged.
· Given interest rate, exchange rate and capital market reforms and liberalization are still taking place, domestic consideration would be more relevant for China A equities when considering its equity risk duration, unlike in developed markets or places with currency board or quasi currency control in place and are subject to higher US interest rate sensitivity.
· In the extremely low rate environment, the US bond asset class is increasingly treated as a risk-off allocation. For investors seeking returns outside of US equities, China is becoming a top diversification destination.
· Growth and Quality are key factors driving a firm’s FV compared to TV, companies with positive Growth and Quality exposures would therefore tend to have relatively lower equity duration.
· In China, Quality Growth companies are also more likely to be beneficiaries of policy tailwinds, which could lead to much stronger impact over other macroeconomic factors when coming to equity performances.
· The cyclical vs. non-cyclical sector lens may not apply well for asset allocation in China; rather, the policy-effects and the retail-driven trading behaviour tend to favour thematic strategies. Manager’s knowledge in “Chinese characteristics” would therefore be very important when considering thematic exposures.