· In the last quarter of 2020, we observed continued factor rotation with LowRisk and Value factors finally picking up in a more pro-cyclical environment as the market readjusted valuations on the back of vaccine rollouts around the world.
· Despite trending down in Q4, Growth and Quality factors were the best performing factors in 2020, maintaining their leads for the third year in a row since 2018.
· Size was the worst performer among all factors in 2020, as liquidity and flow driven trades provided stronger momentum tailwinds for larger companies during the broad market boom.
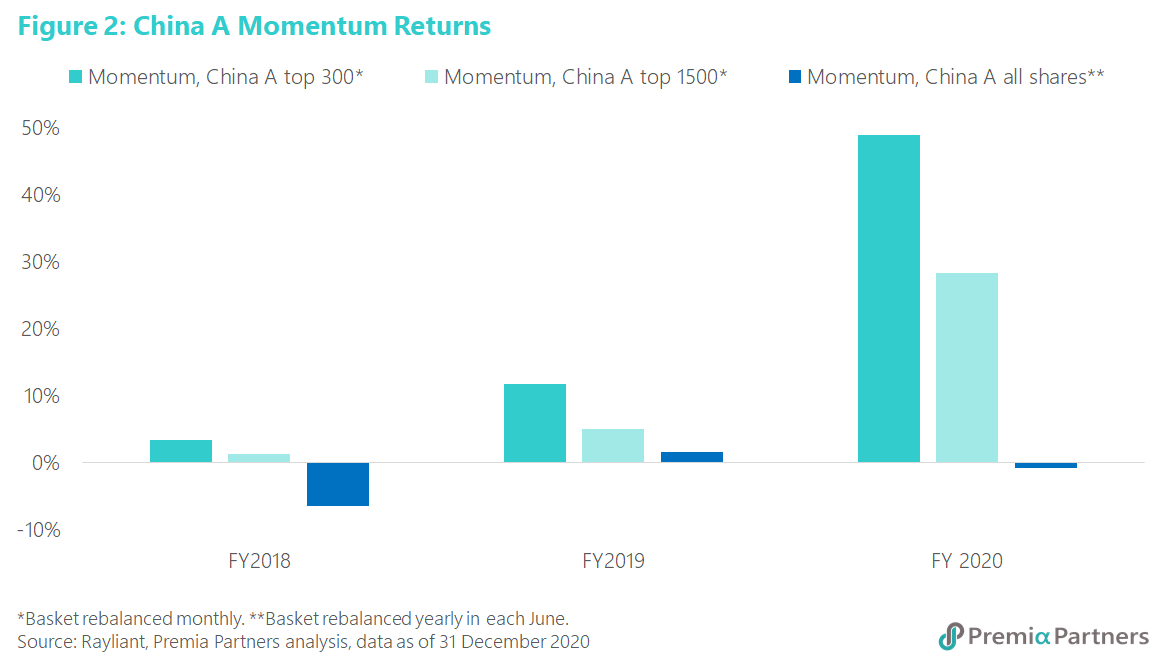
· 2020 was the first year when we observed strong factor return for momentum among large-cap stocks, driven by Yale Professor Robert Shiller’s narrative economics theory and the retail mania.
· The two-speed economy continued as we saw large performance dispersion between factor and sector exposures. Quality new economy exposures have demonstrated robust growth.
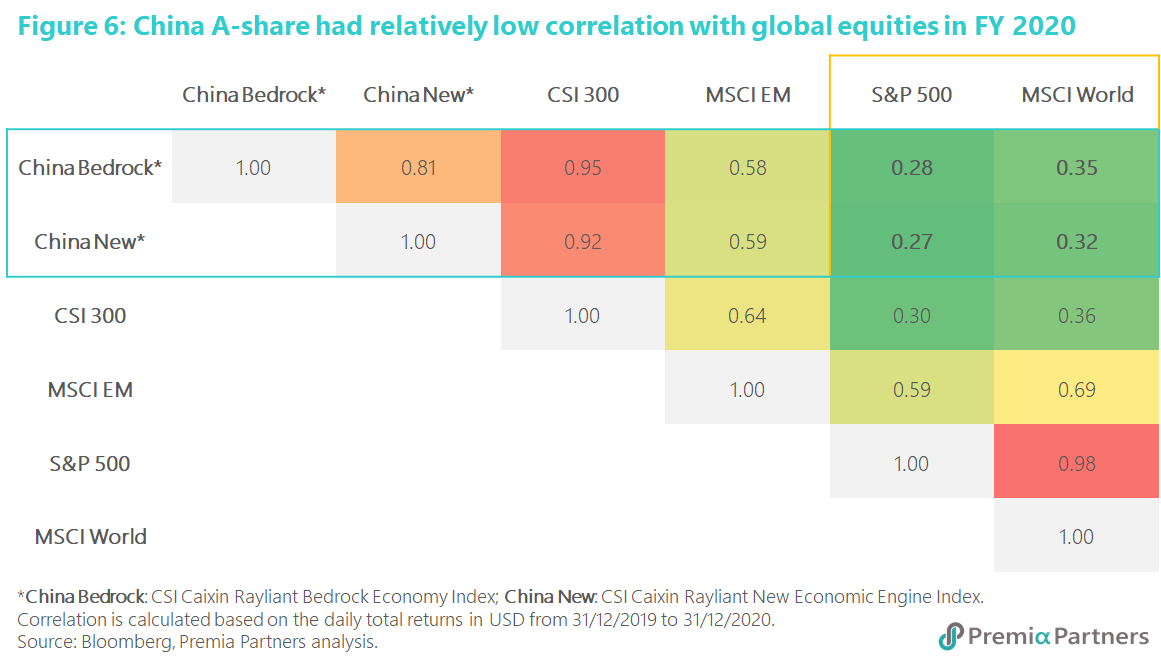
· Compared to the rest of the world, China which emerged from the pandemic and reopened first has also been one of the best performing markets globally. In addition, China A shares’ relative low correlation with the global markets makes it an especially valuable building block for global asset allocators as we entered 2021 with a more volatile market with renewed uncertainties.
Recap of Q4 and FY 2020
Being the first-in-first-out, China has been the first one to reopen and recover from the pandemic last year. While the recovery has been uneven and is still underway going into 2021, in Q4 we observed sector and factor rotation started to kick in, with Value and LowRisk being the best performers toward the year end (Figure 1).
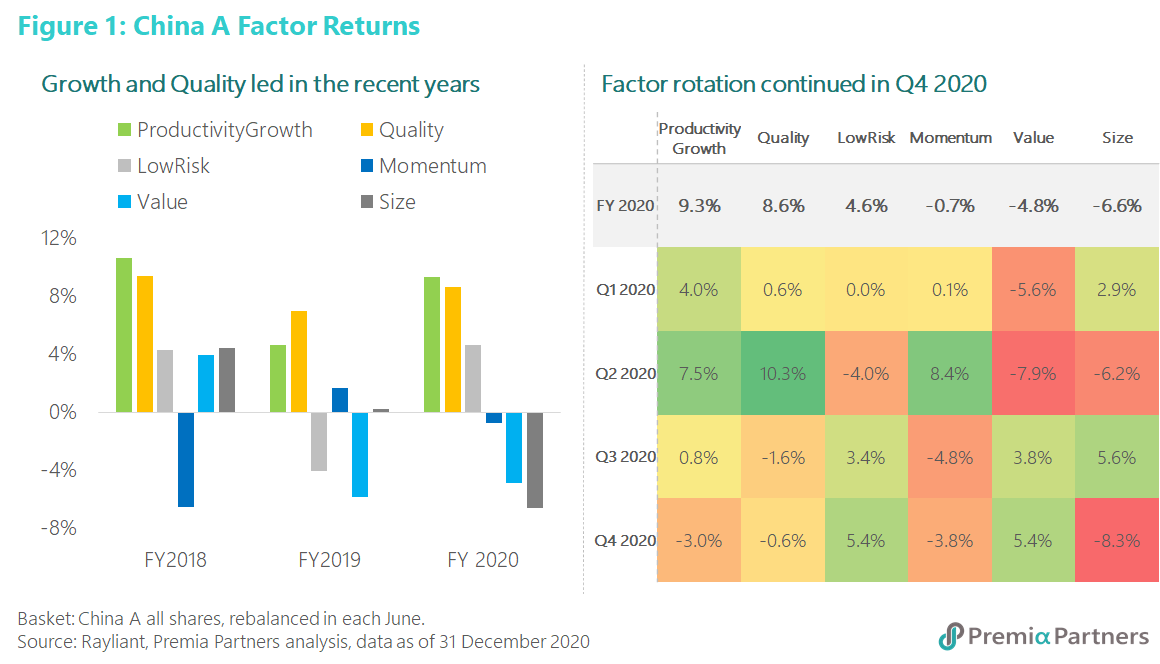
That said, not all cheap stocks have turned around. For instance, after the brief sector rotation into (small) Size along with cyclicals as reopening trades, Size lost its steam from Q4 and ended the year as the worst performing factor. Rather, as Yale Professor Robert Shiller’s narrative economics theory develops, fuelled by the retail mania and influence from investment KOLs (Key Opinion Leaders), large size and household name brands (especially the liquor names) with more prominent narratives gained strong momentum in Q4 compared to small size names that were under continued stress for earnings during the painstaking pandemic and global supply chain recovery. In fact, contrary to the past when momentum did not produce meaningful positive return, 2020 was the first year when we observed strong factor return for momentum among large-cap stocks, which had 49% total return last year (Figure 2).
Meanwhile, notwithstanding the scale back by -3.0% and -0.6% in Q4 respectively, Growth and Quality were by all means the best performing factors in 2020 on full year basis. In fact, Growth and Quality factors have been the most robust China A factors for the past three years, supported by low interest rate/ ample liquidity, policy support and global macro environment. The moderate correction after the long streak of strong positive returns provided a healthy reset before resuming positive trajectory supported by attractive earnings growth, which is to be differentiated from momentum crash for those retail favourites stretched beyond historical average or forward earnings estimates.
LowRisk also scored a positive premium in 2H 2020, as volatility (price movement) and momentum (velocity of price movement) reached new heights after the long equity market rally, and the Value factor also started to turnaround with positive returns supported by the rotation trades in 2H despite overall still negative throughout the full year.
Factor Behaviour before/after the COVID Crisis
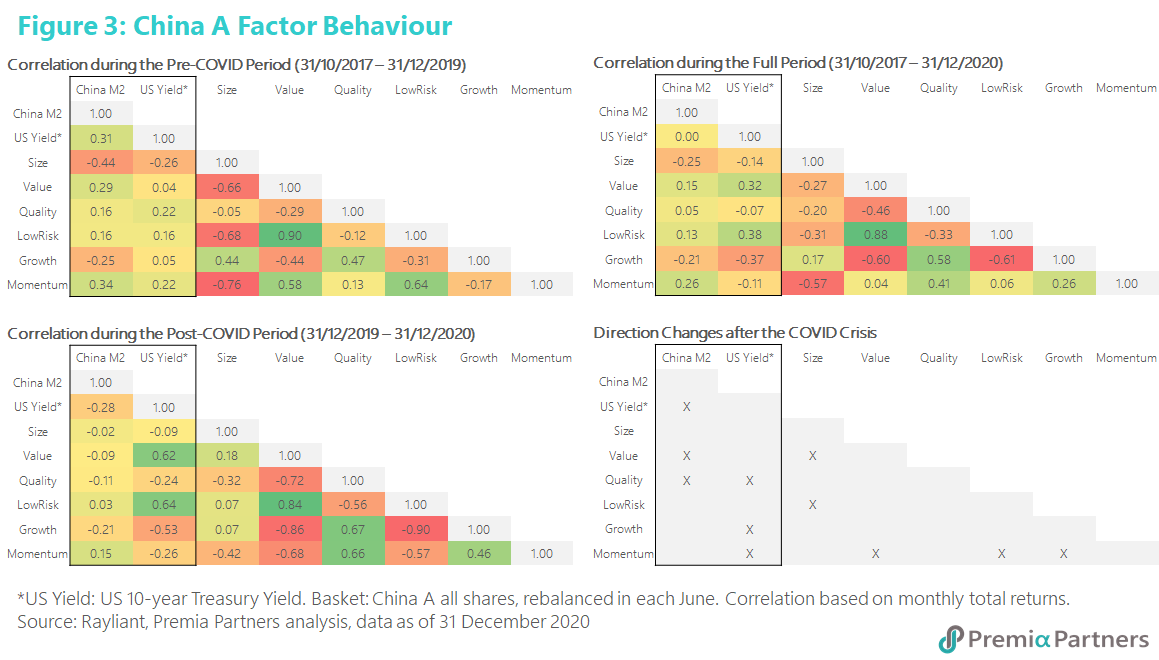
Conventional wisdom often categorise sectors and factors as well into cyclical versus non-cyclical buckets. However, the “Policy” effect most likely overrules the “Cyclicality” effect for the China A-share market as we mentioned in the “Equity Duration: What cease to hold and what still does?”. To examine the behaviour of our China A factors facing the changes of China’s policy, we use China M2 money supply and the US 10-year treasury yield as the reference indicators. In addition, 2020 was undoubtedly a special year for not only the economy but also the capital market; we then view the factor behaviour changes from the pre-COVID period to the post-COVID period. Our observations from October 2017 to December 2020 (the period since our two China A ETFs’ inception) are as follows (Figure 3):
- China M2 money supply had positive relationship with the US 10-year treasury yield during the pre-COVID period, but the correlation turned negative after the COVID crisis. This might be reflected in the divergence of monetary policies taken by the US (or developed markets) which have been pumping liquidity for COVID recovery, while China has been employing a lot more moderate policies.
- Most of the China A factors moved together with China M2 money supply, except for Size and Growth, during the pre-COVID period; however, they switched to have negative correlation with M2 after the COVID in 2020, except for LowRisk and Momentum.
- Momentum is the factor that behaved most differently during the post-COVID period. Momentum’s correlation turned negative with Value and LowRisk, while it rotated to positive relationship with Growth after the COVID. This explained that the investors favoured the Growth stocks, and had less interests in the Value and LowRisk ones during the pandemic when global equities markets also went on unprecedented rally.
- Size was likely to move in the same direction with Value and LowRisk during the COVID, which was opposite to its behaviour before.
- Most of the factor-pair correlations are negative/low positive during the full period examined which also explains the rotation effect we saw and supports the benefit of employing a multi-factor approach; the exception to highlight in terms of pair-wise correlations are that of Value and LowRisk (0.88) and a moderate correlation of 0.58 between Quality and Growth.
Premia multi-factor China A shares ETFs
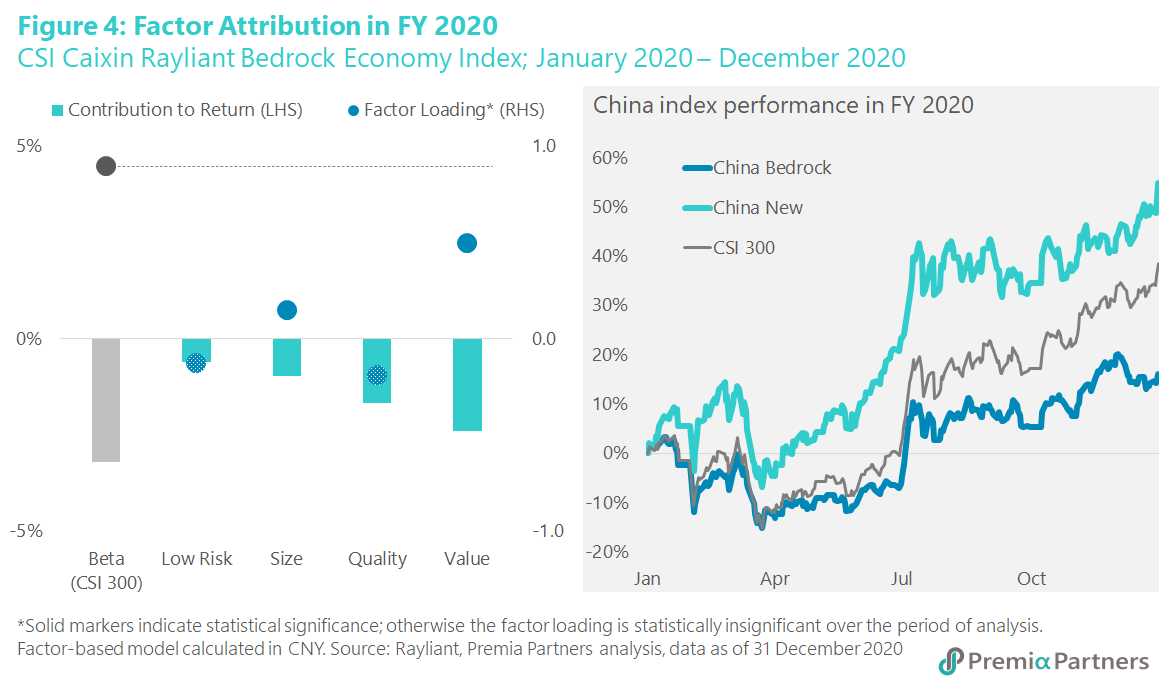
The CSI Caixin Rayliant Bedrock Economy Index, which is tracked by our China Bedrock ETF strategy (2803 HK) underperformed the CSI 300 index in 2020. The underperformance is primarily attributed to the positive factor loadings on the two worst performing factors – Value and Size which continued to fall out of favour in 2020 during the broad market rally given the ample liquidity under quantitative easing around the world (Figure 4). However, given the long broad market rally already, we expect when overall market correction happens, Value and Size (the latter of which also tends to benefit in pro-cyclical environment) given the more attractive valuation would likely gain better reception during periods of sector rotation for cyclical and Value in particular would be more defensive during down markets.
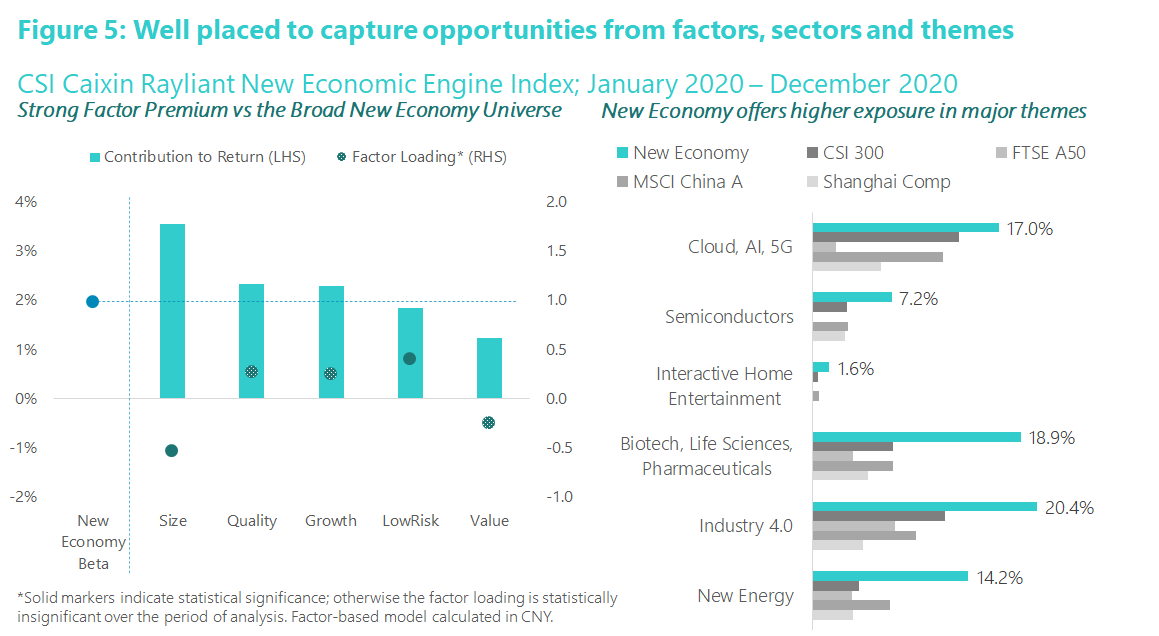
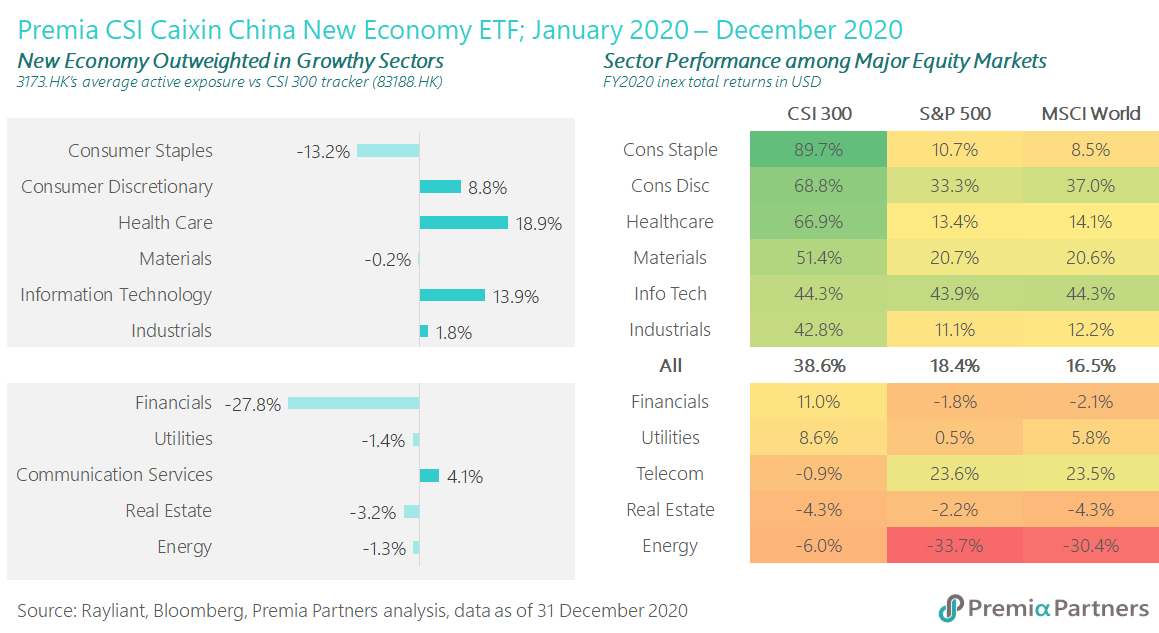
Meanwhile, the CSI Caixin Rayliant New Economic Engine Index, which is tracked by our China New Economy ETF strategy (3173 HK), demonstrated strong outperformance over the CSI 300. The outperformance is primarily attributed to its new economic sector exposures such as 5G & Cloud, Industrial 4.0, life sciences and new energy etc, and further enhanced with its favourable exposure towards Quality and Growth and negative loadings on Value and Size when compared to the broad universe of new economy stocks (Figure 5).
Benefited both from new inflows and market movement as more global investors started to adjust for opportunities from China new economy sectors especially the aforesaid themes, this strategy has gained significant traction among global investors and grown from ~US$90 million in March to ~US$370 million in AuM as of 31st December 2020, which also became the 4th largest China A-share ETF in Hong Kong.
2021 marks the 100th anniversary of the Chinese Communist Party, and also the first implementation year of the new 14th Five Year Plan (FYP). This is of great significance as China started to as a US$10,000 GDP per capita economy – thus the FYP emphasis on development as a moderately prosperous, modern society. The China New Economy strategy is well positioned to capture those with supportive policy tailwinds that we mentioned in the previous article How do we decipher “Dual Circulation” for our China strategies.
As discussed in our earlier article Pressing on from the unprecedented 2020: Outlook 2021 (Part 1 – China), with steady recovery underway and kick-off of the 14th five-year plan, the overall market sentiment for China A shares is expected to be positive. As global central banks start to contemplate taking off the pedals for liquidity life support, and with renewed inflation and interest rate expectations as vaccine started to roll out globally, we expect the Quality factor would be an important double act for both Value and Growth strategies, as investors start to adjust portfolios in their flight to quality against possible headwinds and market correction. Those that are able to offer and deliver consistent earnings growth and credible narratives of policy support would be the likely beneficiaries in this bifurcated world.
Lower correlation and diversification benefits from using China A as building blocks
While China was among the best performing single equity market in 2020, given the tangible recovery and domestic drivers, its relative strengths remain and it is expected to continue to be the growth engine amid structural weakness in USD and the low growth, low yield environments globally. Based on this, we want to further highlight China A shares’ diversification benefit to global investors as we observed low correlations of China A vs. US and world equities. Both of our China Bedrock and China New Economy, in particular, demonstrated even lower correlations compared to the CSI 300 index (Figure 6). As investors contemplate adjusting asset allocation for the new year under the COVID recovery and asset bubble lens, and are wary about existing overweight positions for US or other DM equity exposure, our China A strategies would be useful building blocks to consider.