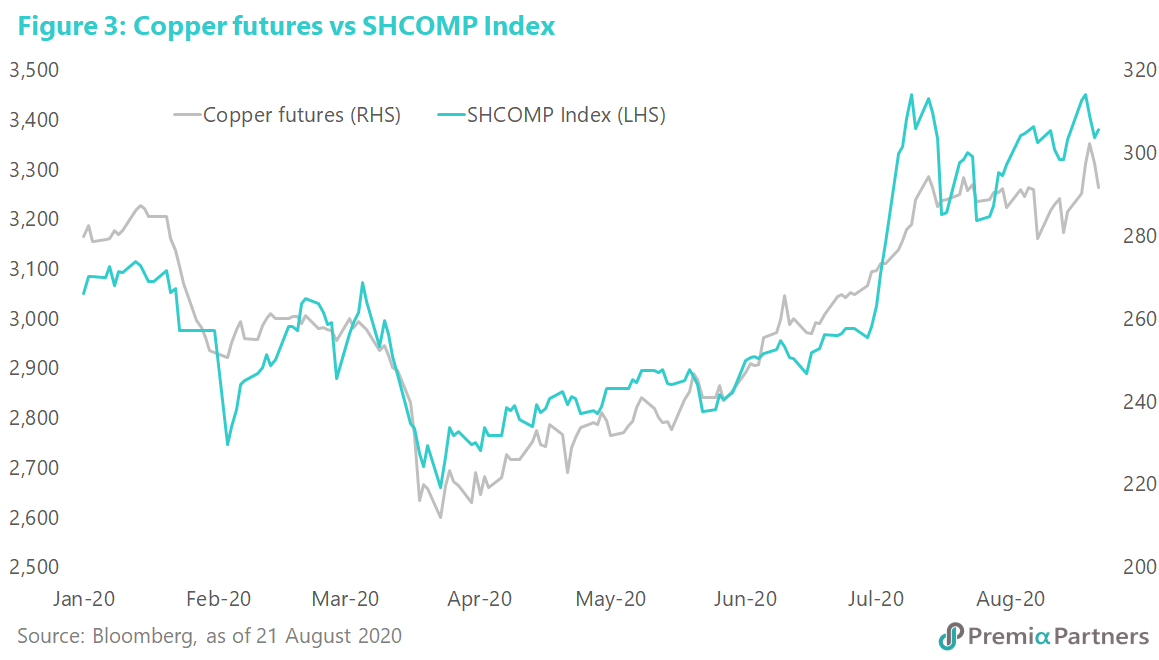
The spread between the China 10-year Government Bond yield minus the US Treasury 10-year yield hit a peak of 244 basis points early in August, surpassing the prior, 2011 high of 234 basis points. It has since eased a bit but still sits at a pretty wide spread of 233 basis points. Not coincidentally, the spread widening started after COVID-19 hit (figure 1).
What does this tell us?
· The differences in the way the United States and China have respectively managed the pandemic have had massive economic ramifications. The US is still deep in the worst recession since the Great Depression. The Chinese economy rebounded sharply in 2Q20.
· US focus on misery alleviation instead of aggressive virus suppression means it will need a lot more of both fiscal and monetary policy support for a lot longer than China.
· As a result, there are bigger policy buffers available to Chinese policy makers versus the “bottom of the barrel” choices left for the US.
· The economic growth differential between China and the US will likely widen in coming years as a result of the policy choices of recent months.
· This supports the case for Chinese equities outperformance in coming years.
Different approaches to pandemic management have resulted in divergent economic performances – deep recession in the US, V-shaped rebound in China. The widening of the yield spread goes to the choices China and the United States made on managing the pandemic and its economic consequences.
China went decisively for aggressive suppression of the virus, and accepted its short-term economic costs. The result was earlier reopening of its economy. The US vacillated between virus suppression and premature reopening of its economy, with State-by-State differences in how it was handled. As a result, the US now leads the world in the number of confirmed COVID-19 cases, at 5.4 million, ahead of Brazil’s 3.4 million and India’s 2.8 million.
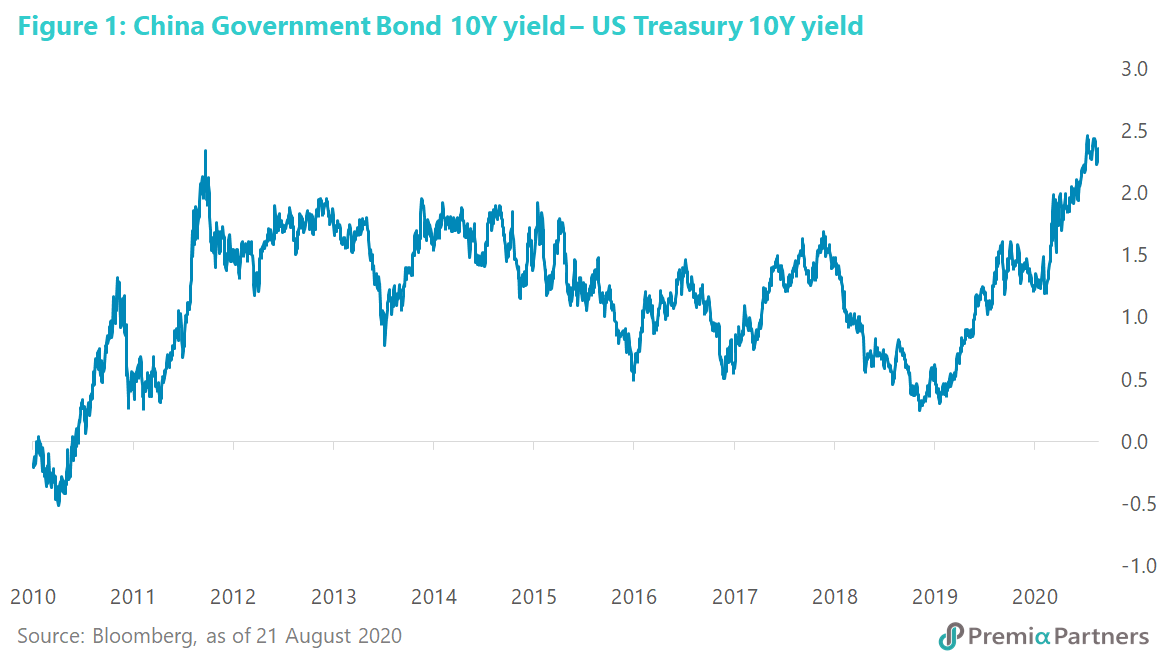
The economic consequences are obvious. In 2Q20, China recorded 3.2% growth y/y. The US recorded 9.5% contraction y/y (figure 2).
Chinese exports have climbed out of the deep slump of 1Q20, with total exports up 6.1% y/y in July. Industrial production has gone from deep contraction of 13.5% y/y in February to 4.8% growth in June. And the services sector has gone from 13% y/y decline in February to 2.3% growth y/y in June.
The market is also telling us something about future growth. These are 10-year bond differentials. So, they are also speaking of the market’s expectations of growth prospects in China Vs the US for many years to come. (See our 13 May 2020 Insight: Will China’s GDP overtake the US this decade?)
While the Federal Reserve remains ultra “accommodative”, the People’s Bank of China keeps its policy “powder” dry. By getting on top of the pandemic early, the Chinese government and the PBOC were not forced into the extreme welfare spending and monetary easing (interest rate cuts and monetary expansion) undertaken by Developed Market central banks. Instead the focus was on debt forbearance (instead of interest rate cuts) and infrastructure and property investment (instead of welfare). And that final difference – investment versus welfare spending – will likely have implications for future productivity and economic growth.
Further, as a result, Chinese policy makers have more “ammunition” to stimulate the economy in the future should it be needed:
· The PBOC has held its Reserve Requirement Ratio steady at 12.5%, while the Federal Reserve has cut its reserve requirements on all transaction accounts to zero, as part of its pandemic response. (Prior to March 26, net transaction account balances above the so-called “low reserve tranche” were subject to a reserve requirement ratio of 10%.)
· The PBOC’s benchmark, 1-Year Loan Prime Rate is now at 3.85%. It had been cut by only 30 basis points this year. The Fed on other hand cut the Fed Funds Target Rate 100 basis points since the pandemic, down to zero.
· China’s Premier Li Keqiang said in a report in May the country had set a budget deficit target of “at least” 3.6% of GDP for 2020, up from 2.8% last year. Research by Bank of Finland (Finland’s central bank) estimated the budget deficit after accounting for “transfers from other sources”, should be around 6.5% of GDP. Even assuming this larger estimate, it is dwarfed by the US budget deficit of 18% of GDP for fiscal year 2020. That is the US Congressional Budget Office’s projection.
China’s equity market should gain growing recognition as a “recovery play” on the strength of its economy, policy firepower, and future growth potential. When the mania surrounding “pandemic stocks” (“StayHome/”WFH”/tech) run out of puff, (see our 12 August insight: Buying the recovery not the pandemic ) market attention will likely switch to laggard “recovery stocks” and Emerging Markets, of which China accounts for around 40% on the MSCI index.
The yield hunger in Developed Markets, driven by zero and negative policy rates, will be exacerbated by the heightened valuations (and lowered dividend yields) for DM equities.
The MSCI Emerging Markets Index offers 2.3% estimated dividend yields for this financial year. Chinese equities (CSI 300) offer an estimated dividend yield of around 2%. Against that, the MSCI USA offers an estimated dividend yield of 1.7%, and the S&P 500 Tech sector only 1%.
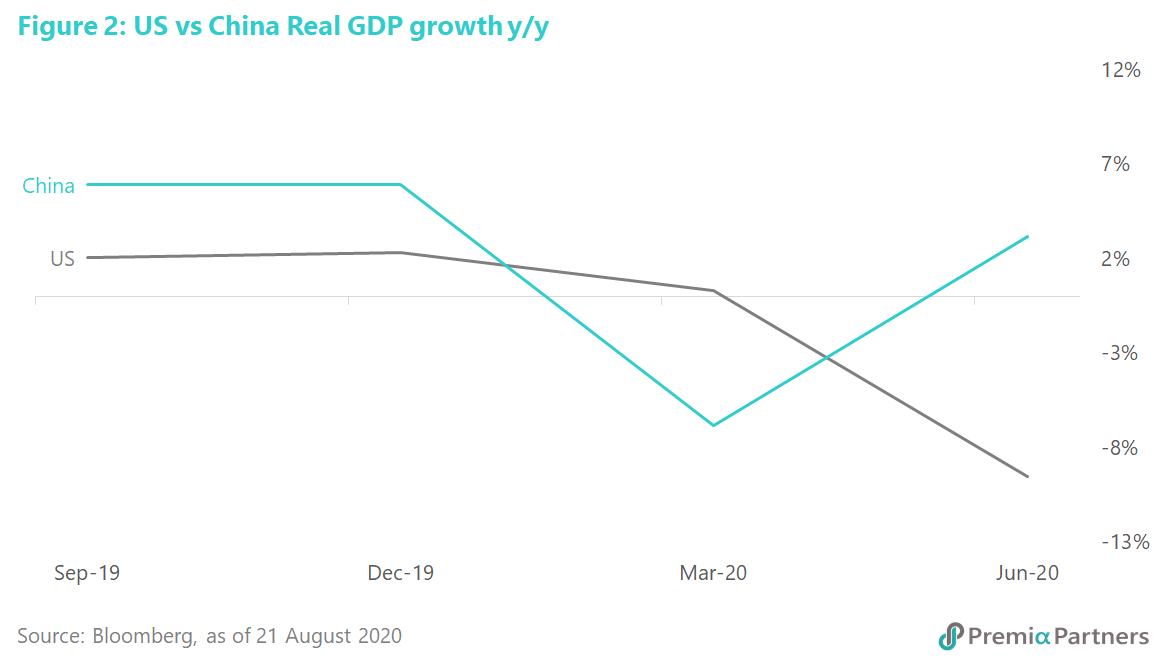
Finally, below is a chart for Chinese equities sceptics – those who reckon the market is “engineered”. The Shanghai Composite’s gains of recent months have been confirmed by the corresponding gains in copper futures (figure 3).
Both are recovery plays.