In the language of the cycles of “fire and ice”, Developed Markets have been reining in their economies to douse the fires, while China is now stimulating its economy to break the ice.
This is not to say with certainty that DM cannot deliver “Goldilocks”. Stranger things have happened. It is about probabilities, pricing and risks. US valuations have already priced in Goldilocks. Indeed, they are now pricing aggressive rate cuts. Therein lies significant risk of disappointing expectations.
It is useful to also note the secular trends around which cycles mean revert. Betting against secular trends heightens cyclical risks. The reverse can also be true. In the US, the secular trends in government debt, US Treasury issuance and government bond yields are dangerous for the asset market. The US Dollar strength may have exhausted its cycle and may be about to resume a secular downtrend. In Japan, eight years of negative rates are about to come to an end, but more than that, it could signal the end of a secular trend of declining, zero and then negative rates that started in the early 1990s. Meanwhile, the cyclical rally in the Nikkei 225 sits uncomfortably with a secular stagnation in the nominal GDP. In China, the reverse is true. The cyclical decline in the CSI 300 is an extreme divergence against China’s rising nominal GDP.
Bullish everything sentiment – what do you do for an encore? Bullish sentiment toward US equities – reflected in the CBOE VIX trading around the cyclical lows recorded in almost a quarter of a century – is driven by the assumption that the US inflationary cycle is ending. Similarly, US credit spreads – both high yield and investment grade – are now approaching the cyclical lows of the past quarter century, suggesting the market is dismissive of the possibility of a recession. Taking that a step further, the market believes the Fed can deliver interest rate cuts amidst ongoing economic and earnings growth. The same theme is also being played out in Europe, where the VStoxx, the Euro Stoxx 50 volatility index, is also approaching long-term cyclical lows. Nikkei volatility, while not quite approaching cyclical lows, is unremarkable – calm.
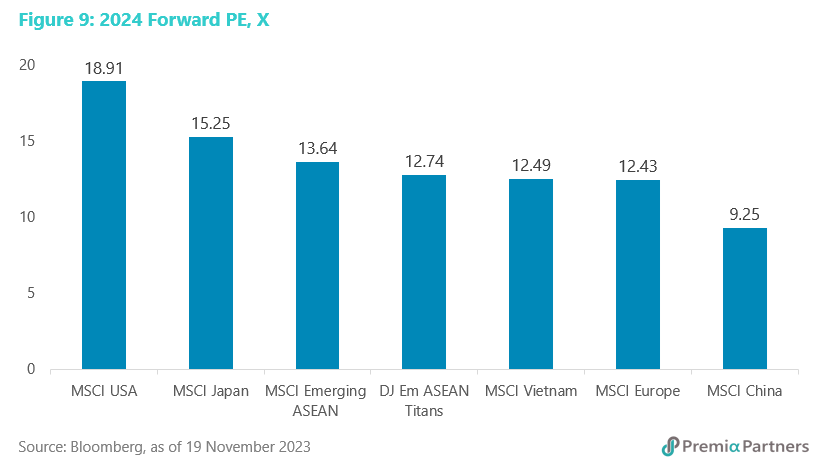
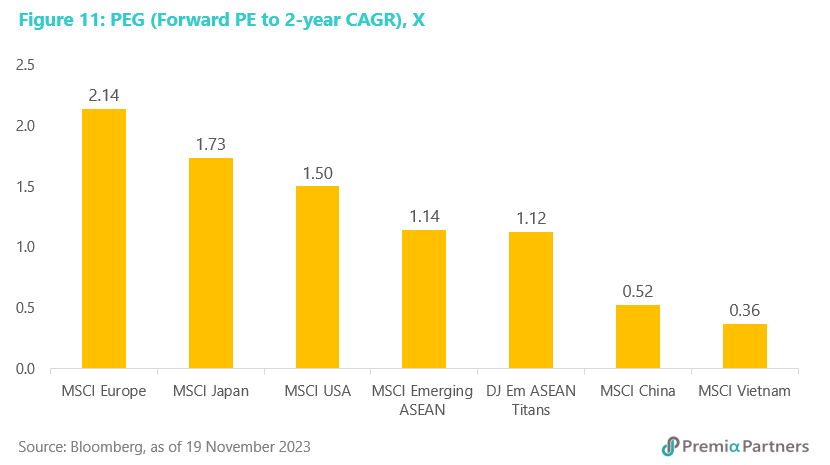
The extremes in sentiment are also reflected in relative valuations, with the MSCI USA trading at 19.0x forward earnings and MSCI China on 9.0x and Dow Jones Emerging Market ASEAN Titans at 12.0x. The PEG ratios also speak of the same extremes – 1.5x for MSCI USA, 1.7x for MSCI Japan, and 2.1x for MSCI Europe, versus 0.5x for MSCI China, 1.1x for DJ EM ASEAN Titans, and 0.4 x for MSCI Vietnam.
All of which begs the question: What would justify a repeat of these extremes in sentiment?
United States
Cycle transition from Goldilocks to recession. Transitions in the cycle can throw up mixed data. Turning points are often messy, unfolding in fits and starts, before the underlying trend is more clearly formed. Our sense is there will likely be a recession in the US in 2024.
The Sahm Rule indicator (which signals the start of a recession when the 3-month moving average of the employment rate rises by 0.50 percentage points or more relative to the minimum of the 3-month averages from the previous 12 months) is suggesting a recession is not far away. At the start of the year, that difference (between the 3-month average and the minimum of the 3-month averages over the preceding 12 months) was negative 0.07 percentage points. It hit +0.33 in October before pulling back to +0.30 in November. Such is the messiness of turning points. While the Rule uses +0.5 percentage points as its recession benchmark, the US economy has entered recessions at lower levels – at +0.40 percentage points in 2007; +0.30 percentage points in March 2001; and at zero percentage points in July 1990.
The Conference Board’s Leading Economic Index is signalling a recession in 1H24, with GDP growth of 0.8% for the full year. The IMF is expecting 1.5%, but even that is not inconsistent with a recession.
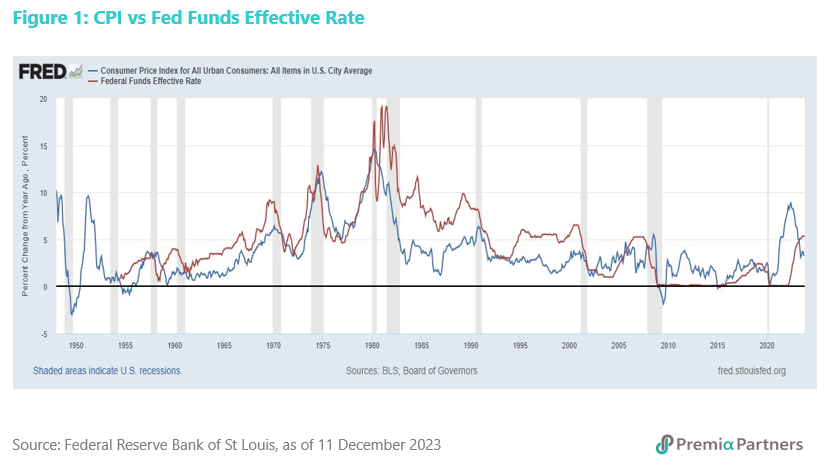
Immaculate disinflation is rare. Painless disinflation is historically atypical. The only exception in post-war US history was the disinflation that started in April 1951, and since the Fed started publishing its rates data in1954, there has been only one instance of the Fed embarking on a rate cutting cycle that did not coincide with or result shortly thereafter in a recession. That one occasion was late-1966 to late-1967, when premature rate cutting cycle was followed by almost three years of higher inflation and higher rates, culminating in the recession of 1969-1970.
Aggressive rate cutting by the Fed can make what is coming a mild recession, but risks reigniting core inflation. It is worth reminding that core PCE inflation will likely end 2023 at around 3.4% y/y – a long way off from the Fed’s 2.0% target.
The US consumer, who accounts for around 70% of the GDP, is running out of money. Household savings in the US – boosted by lockdown-enforced cuts in spending and government transfer payments – have normalised to pre-pandemic levels. Economic activity in the US in 2022-2023 benefited from consumers returning with a vengeance. In the process, US households have drawn down the savings rate as a percentage of disposable income very much below pre-pandemic levels, while the equivalent rate in other major Developed Market economies remained above pre-pandemic levels. Beyond that, credit card and other forms of revolving credit have exploded, both in absolute terms and relative to income. Shop until you drop, so the saying goes. The US consumer may be about to drop.
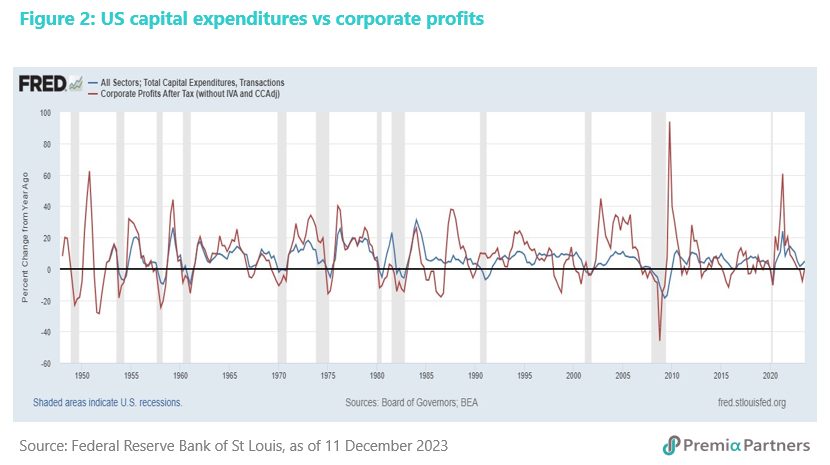
Expected earnings recovery depends on Goldilocks. The market currently expects the MSCI USA to produce 11% earnings growth for 2024, after an end to the earnings recession from 4Q22 to 2Q23. Something to watch for is US capital expenditures, which have been in a cyclical downturn. It is correlated to US corporate profits. There has been a small uptick in y/y capital expenditure growth in 2Q23 and 3Q23.
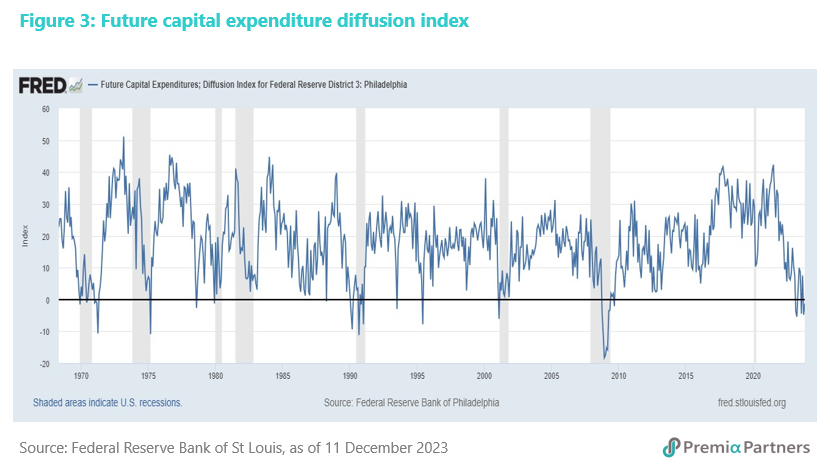
However, the Future Capital Expenditure Diffusion Index, which forecasts the change in capex over the next six months, is still in negative territory, suggesting contraction risk ahead.
There is a balance at play here between rate cuts and recession. Persistently high rates will discourage a reversal of the capex cycle. Yet, rate cuts as a result of a recession may not encourage a return of capex either.
A problem with Goldilocks is the expectation of rate cuts without a recession. The swaps and futures markets are currently pricing 110 basis points of rate cuts by end-2024 and that is four rate cuts. But the equities and credit markets are expecting no recession. That is a tough one to reconcile. Typically, the Fed delivers rate cuts into a recession. In 2007, rate cuts preceded recession by around four months; in year 2000, they preceded recession by two months; in 1989 they came about a year before recession; in 1981, the cuts started only a month before recession; in 1980, the cuts came in the midst of a recession; and likewise in 1974, 1970, 1960, and 1957.
Secular trend negative for the US – surge in government debt, Treasury issuance, and implications for yields. This is a risk for all US risk assets, but particularly for credits, where spreads are already close to being as tight as they have ever been. At the heart of this is the surge in US government spending and debt since the start of the pandemic, which has driven a sharp rise in US government debt from US$23.2 trillion at the start of 2020 to US$33.8 trillion currently (December 2023). But the Federal Reserve has been running down its holdings of US Treasuries and Agency debt; commercial banks are holdings less US Treasury and Agency securities; and the total foreign holdings of US Treasuries has been stagnant.
From the start of 2022 to October 2023, the total US public debt outstanding rose US$3.9 trillion ($29.6 trillion to $33.5 trillion). However, we estimate that the combined holdings of US Treasuries and Agency debt by the Fed, US commercial banks, and foreigners fell around US$1.46 trillion. (Note that the latest foreign holdings data is for July, but given the general trend since January 2022, it would seem reasonable to assume continuation of that sideways drift in the total holdings.)
So that means over that period there was an additional US$5.36 trillion for the rest of the market (ex-Fed, US commercial banks and foreigners) to absorb. For context, that is almost six years of incremental US federal government debt held by the public, averaged over the ten years (2009 to 2019) before the pandemic. That was a lot to absorb by a combination of private US investors (funds and individual investors) and US state/local governments.
Then there is the massive amount of maturing US government debt to refinance. The Federal Reserve Bank of St Louis published a paper in June which broke down the percentage of the Government’s “fixed rate marketable US Dollar debt” (FRMUSD) that is maturing and in need to refinancing in coming years. Stripping out the non-marketable and variable rate debt, the FRMUSD base is US$21.4 trillion. According to the paper, 51% of that debt matures between 2023 and 2025. That is US$10.9 trillion. Even worse, this figure does not take into account the short-term (1-year) securities yet to be issued, and that could be significant: This refinancing requirement this year was estimated at around US$6.4 trillion. Around US$3.5 trillion to US$3.6 trillion – more than half – is from 1-year debt. These figures are conservative because they were compiled from end-2022 data. So, they would not have captured short-term debt issued in 2023.
Euro Area
Cycle transition from recession to “slugflation”? European equities are now trading off the assumption that the worst is over – that it is now in the midst of a shallow, technical recession (3Q23 was negative), with recovery in 2024. However, the Euro Area’s cyclical change is likely towards sluggish/minimal growth with inflation above 3.0%. Let’s call it “slugflation”. Its cyclical change is likely to be towards even less favourable outcomes than for the US, in both GDP growth (lower) and inflation (higher). The IMF is calling for 1.2% growth and 3.3% headline inflation.
The ECB’s preference to follow the Fed risks more damage to the economy in 2024. A risk to Euro Area growth in 2024 is the ECB’s history of lagging the Fed in both hiking and cutting rates. Whether it is a function of the greater complexity/diversity of the EA economy or a reluctance to act ahead of the world’s largest economy, this is a historical reality. And this could lead an economy that is evidently weaker than the US (in cyclical growth terms) to wait too long for the ECB to cut rates. The risk is then not just “slugflation” but a deeper recession.
Japan
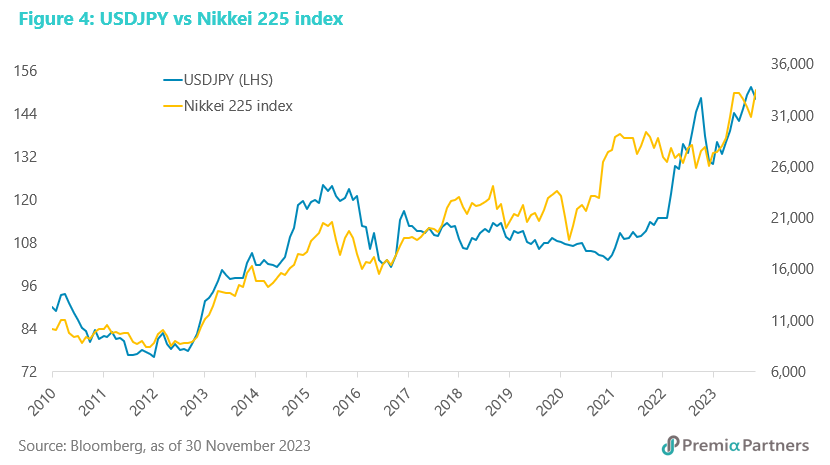
Cycle transition to triple exits from negative rates, yield curve control and weak Yen. Japan’s cyclical change looks the most precarious among the major Developed Market economies. The Nikkei 225 was the best performer among the three big DM markets for the year to date, and it was driven by aggressive Yen depreciation and the well-established correlation between USDJPY and the Nikkei 225.
There was nothing new nor clever about that. The problem is this is not a sustainable because of its inflation and financial stability implications.
A decade-long cheap Yen cycle may have reached its limits. What will require a lot more thinking and dexterity from Japanese policy makers than that decade-old “enyasu” (cheap yen) trick will be how Japan exits from negative interest rates, yield curve control, and a shrinking Yen. In any event, the end of rate hikes in the US may have already started a cyclical retreat in the USDJPY and is forcing an exit from “enyasu” by default.
Best outcome for Japan – a moderate recession. If the BOJ stumbles through this, Japan will go through a moderate recession, with higher than accustomed inflation. At the IMF’s 2024 GDP growth forecast of 1.0%, Japan will almost certainly enter a recession. Indeed, for 3Q23, Japan’s GDP contracted by a much larger than expected 2.1% (annualised). This is sharp reversal from 4.5% growth in 2Q23. Inflation should moderate with that likely recession but it will likely be still well above the BOJ’s target of 2.0%. We are expecting something around 2.5%.
If the BOJ fumbles the exit from yield curve control, the surge in JGB yields could trigger financial crisis, and not just in Japan.
Bank of Japan’s US$8 trillion gamble – how to cap the 10-year JGB yield without a cap. In November, the Bank of Japan took another step in its attempts to remove yield curve control (YCC) on the US$8 trillion pool of JGBs, by redefining the 1.0% cap on the 10-year JGB yield as a “reference point”. The background to this is that the BOJ lifted the yield “cap” from zero to 0.5% in January this year and later to 1.0% middle of this year.
The BOJ is walking a very fine line in stepping back from intervening in the JGB market without triggering a surge in the 10-year yield which would likely prove financially catastrophic for the Japanese economy and global financial markets.
BOJ’s three big reasons for getting rid of YCC include the risk of capital flight. The BOJ has three big reasons to get rid of YCC: 1) It already owns more than half the US$8 trillion JGB market. For just liquidity purposes, it cannot keep buying unlimited amounts of JGBs on a daily basis. It cannot own the whole JGB market. 2) It also cannot have a huge and possibly (long-term) widening differential between the 10-year UST yield and the 10-year JGB yield because of its effects on devaluing the JPY and ever higher imported inflation. 3) If the JPY is devalued even more aggressively, with rapidly rising inflation, the fear of hyperinflation could trigger massive capital flight, possibly forcing the government into capital control.
At stake – Japanese government debt sustainability. The gamble is not just about control over the US$8 trillion JGB market. It is also about debt sustainability for the Japanese Government. For the global financial markets, it is also about the total of US$9 trillion in foreign assets held by Japanese institutions and households.
Revenge of the “trilemma” – why the BOJ cannot keep intervening in the JGB and JPY markets. If the JPY weakens too much, it could trigger capital flight in search of currency stability. If the 10-year JGB yield rises too much, it could trigger weakness in global markets as Japanese repatriate their funds. Call this the revenge of the “trilemma”. This is also referred to as the “impossible trinity” – about how an economy cannot control its rates/yields; its currency; and keep an open capital account. So far, the BOJ has gotten away with Mission Impossible. But it too must realise it is not sustainable. Now, can it unwind its impossible control of the impossible trinity?
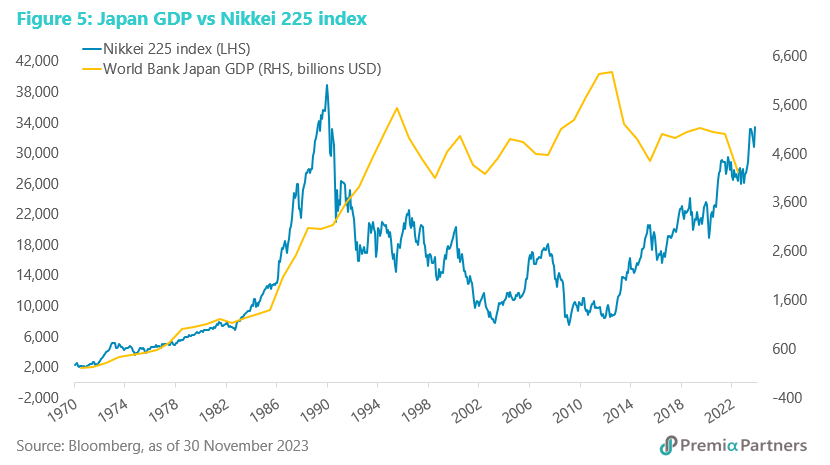
Secular trend negative for Japan – surging stock index, stagnant GDP. The Nikkei 225 neatly tracked the rise of Japan’s nominal GDP over the quarter century from 1960. Then the bubble era saw the Nikkei 225 diverge wildly above nominal GDP until end-1989. It then “mean reverted” downwards for almost two decades from 1990. We may now be near the end of a 12-year mean reversion (up) against a stagnant nominal GDP which had been going sideways since 1996.
China
July may have marked a turning point in the cycle for China. A new stimulus cycle has started in China, even as data is showing tentative signs of a bottoming of the cycle. With consumer price inflation likely to end 2023 at less than 1.0%, and expected to be around 1.5% for 2024, China is at the very early stage of a new cycle. It has a lot of room for stimulus.
The July Politburo Meeting was an important turning point in the cycle, with the Politburo emphasising “the need to actively expand domestic demand, give full play to the fundamental role of consumption in driving economic growth, expand consumption by increasing residents' income…” It also said it was “necessary to better leverage the driving role of government investment and accelerate the issuance and use of local government special bonds.”
Since then, the government has moved to lift fiscal and monetary support for the economy, with a rise in the fiscal deficit with an unusual issuance of RMB 1 trillion in sovereign bonds for infrastructure spending.
On the monetary front, further to the two rounds of cuts to interest rates and the Required Reserve Ratio (RRR) since last May, the People’s Bank of China (PBOC) has been boosting liquidity in recent months through the Medium-Term Lending Facility (MLF) and open market operations. In November, the PBOC injected RMB 600 billion through the MLF, the largest monthly injection in seven years.
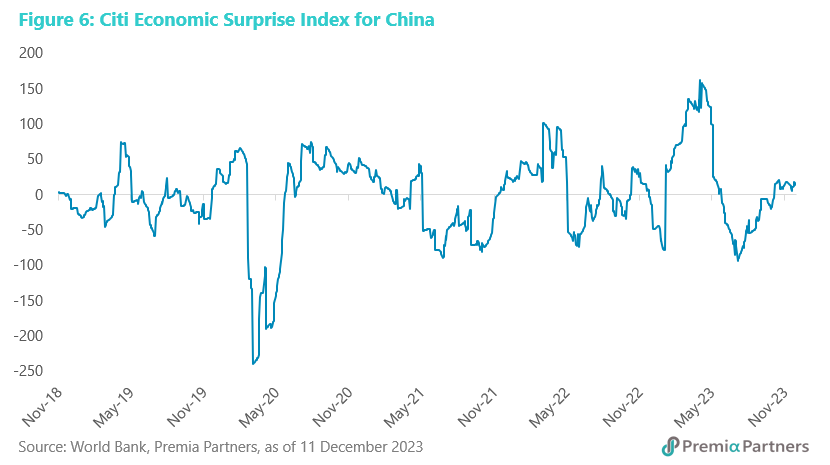
Interestingly, and this may be coincidental, the Citigroup Economic Surprise Index for China put in its cyclical low in deep negative in July and the index reading is now positive.
China’s economic data is not as good as the market would like but not as bad as the media headlines might lead you to believe. Retail sales growth (y/y) has been picking up since July. If July marked the low this year, it would have been a much higher low than those in 2022.
July was important for another data set – China’s export growth. It marked the lowest point/turning point in the cycle with 14.3% y/y contraction. This has now reversed to a small 0.5% y/y growth for November. Part of this decline in exports in 1H23 and the recovery in 2H23 was related to the “tech recession” in 1H23, which saw major layoffs of workers in the tech sector. However, Bernstein Technology analysts, who have been tracking the retrenchments, reported in August that the layoffs have “slowed to a trickle.” They pronounced that the tech job recession was over.
For industrial production, there is an apparent uptrend in growth (y/y) from December of 2022.
Fixed asset investment growth should put in a bottom soon as proceeds of bond issuances flow into capital expenditures. As the lag from bond issuance translating into investment spending fades, we could on hindsight see that the 10-months to October fixed asset investment growth of 2.9% y/y was close to the bottom of that cycle.
The PBOC is also working to put a floor on property sales. In the property sector, the PBOC is also working to put a floor on the down-cycle in sales. The central bank has been encouraging more cities to lower or abolish the mortgage rate floor for first-time home buyers since the start of the year. As of the end of September, the rate moderation has affected more than RMB 22 trillion of existing loans for first-time home buyers, with the weighted average interest rate lowered to 4.27% after the change, down 73 basis points on average compared to before the change. It helped borrowers save up to RMB 170 billion in interest payments, benefiting 150 million individuals.
Secular trend positive for China – mean reversion around a rising nominal GDP. The CSI 300 is overdue for a mean reversion back up against the economy’s rising secular trend.
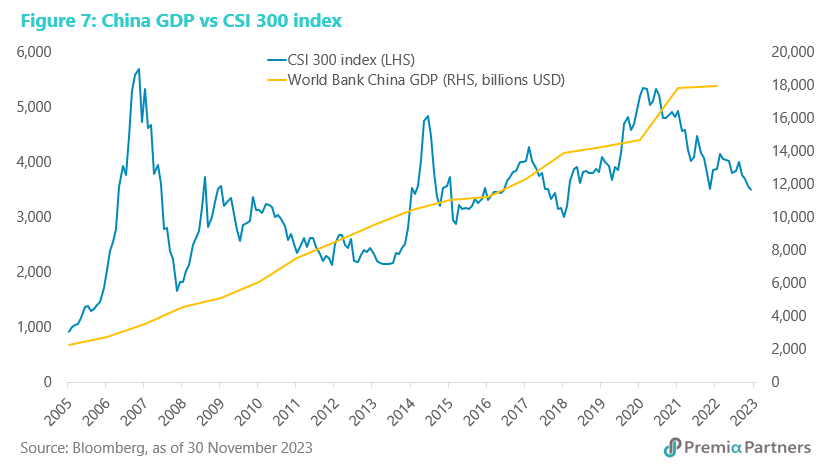
It is possible the market fears secular economic stagnation ala Japan. This is unlikely for reasons we outlined earlier this year (Why China 2023 is not Japan 1990).
The IMF does not appear to agree with the secular stagnation thesis either. The IMF is forecasting China’s GDP to rise from US$17.7 trillion this year to US$23.6 trillion by 2028 – one third larger in five years.
Emerging ASEAN
One of very few winners in economic growth in 2024. The Emerging ASEAN economies of Indonesia, Malaysia, the Philippines, Thailand and Vietnam stand out as likely economic growth winners in 2024, likely benefiting from a turning in its interest rate hiking cycle, lower inflation and a weakening of the US Dollar. The rate hikes in September-October in Indonesia, the Philippines and Thailand are likely the last in this cycle. Malaysia, it appears to us, ended its rate hiking cycle mid-year, while Vietnam has started a rate cutting cycle.
The real Goldilocks? The IMF is forecasting stronger economic growth in 2024 for Malaysia, Thailand, the Philippines and Vietnam, with stable growth for Indonesia. And those forecasts would have been on the assumption of slower growth for China, decelerating from 5.0% to 4.2%. On the stimulus underway, we expect China should outperform the IMF forecast, closer to the 5.0% Government target. That should give Emerging ASEAN an added fillip for GDP growth for 2024. That amidst likely lower consumer inflation for Indonesia, Malaysia, and Philippines, with stable inflation for Thailand and Vietnam.
Vietnam – the standout growth story in ASEAN. The Government has set its GDP growth target for 2024 at between 6.0% to 6.5% - quite a step up from the IMF forecast of 4.7% for 2023. (The government’s target for 2023 is 5.0%.) Even if it only achieves the IMF’s forecast of 5.8% for 2024, that is still quite an achievement, given the expectation of stable inflation of 3.4%. Vietnam’s cycle transition started early in 2023, with the State Bank of Vietnam decisively slashing rates from 6.0% to 4.5% between March and June. Looking ahead, a 32.0% lift in the average public sector salary in 2024 will help consumption. Also, the National Assembly has directed the Government to boost loans with lower interest rates to support growth.
Secular trend positive for Emerging ASEAN – turning point in the US Dollar cycle. The US Dollar bull cycle may be turning with the Fed on hold and with expectations of rate cuts in 2024. Indeed, the US Dollar may be resuming its secular downtrend from its 1985 peak. Since 1978, the Dollar Index DXY has moved up and down in long cycles of 5 to 7 years. The current cycle, which broke out of a “bottom triangle” pattern in 2014, is now 9-10 years old – very long in the tooth, so to speak. That is useful to note because DXY bull cycles have tended to be accompanied by Emerging Market equities underperformance versus Developed Markets (proxy: MSCI World). The reverse has tended to be true – DXY bear markets has tended to be accompanied by EM equities outperformance.
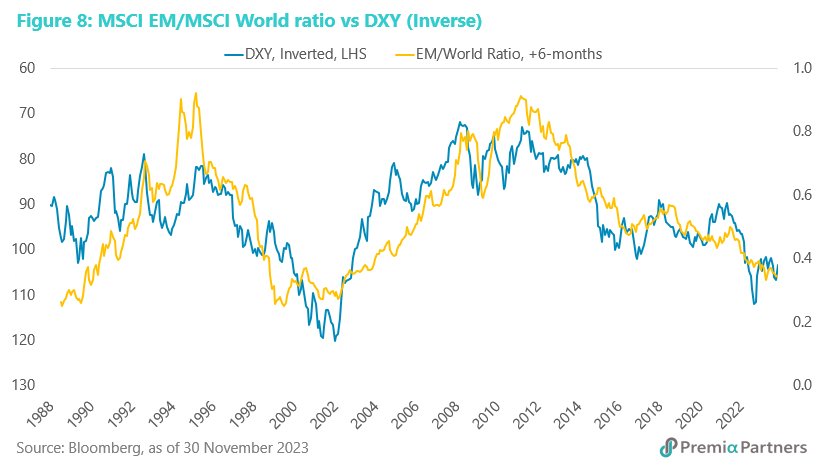
This is a secular tailwind for the already favourable Emerging ASEAN cycle.
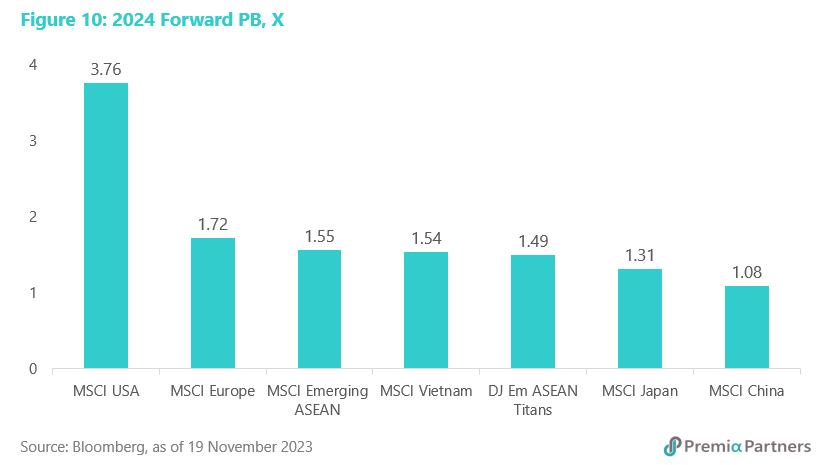
Valuations
Extremes in sentiment are reflected in extremes in under-valuation and over-valuation. In simple PE and PB terms, the over valuation is greatest for the US and the undervaluation is at the most extreme for China. That overvaluation (US) and undervaluation (China) is still true, after adjusting for earnings growth expected over the coming two years, and that reflects the turning of the growth cycle we wrote about above. Note that adjusted for earnings growth, Europe stands out as the most expensive and Vietnam stands out as the cheapest in the pack. The charts below speak for themselves.