The international media reckoned a front-page opinion/editorial in the China Securities Journal calling for a “healthy bull market” to create “new opportunities in crisis” being responsible for last week’s red-hot run-up in the Shanghai Composite Index.
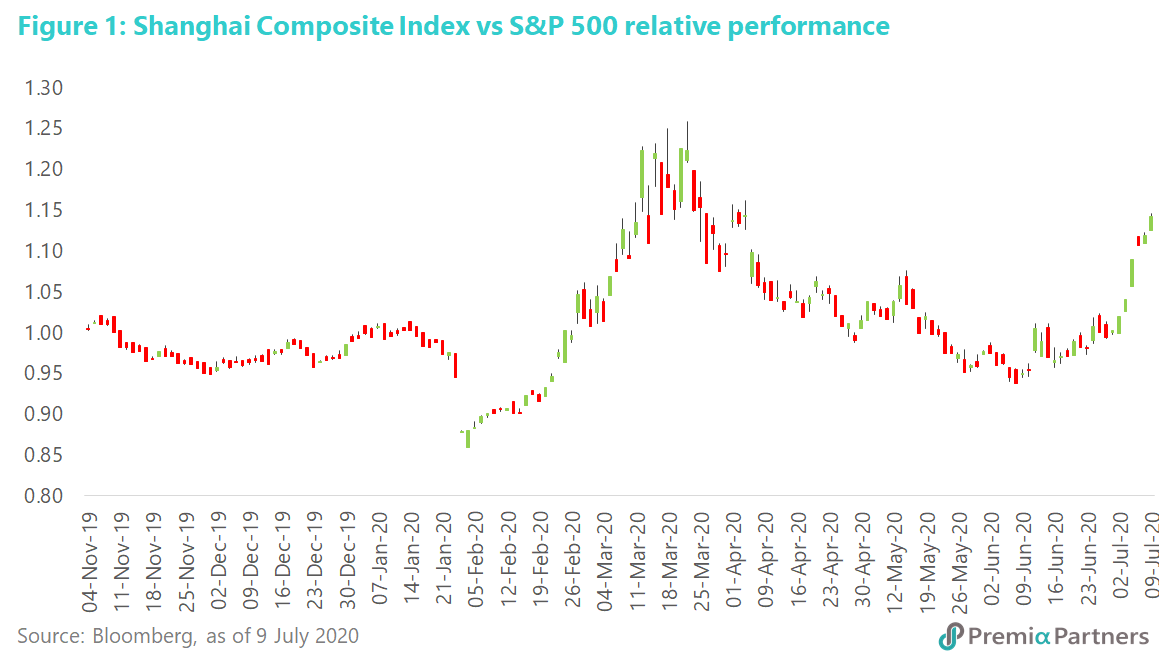
It may be the case, but note that the Shanghai Composite had started another cycle of outperformance against the S&P 500 from June 8. The almost vertical ascent of the index started July 1, before the China Securities Journal editorial.
Perhaps there are less “exciting”, but more enduring, explanations for the surge in Chinese stocks.
1) The Shanghai Composite Index runs cycles of outperformance and underperformance against the S&P 500. It had started another cycle of outperformance early last month. (Figure 1) As the S&P 500 struggles under the weight of the heady valuations of its leaders – Microsoft, Apple and FANG stocks and as the Dow Jones starts slipping despite a rampant Nasdaq – investors beyond China have started looking at the Shanghai Stock Exchange.
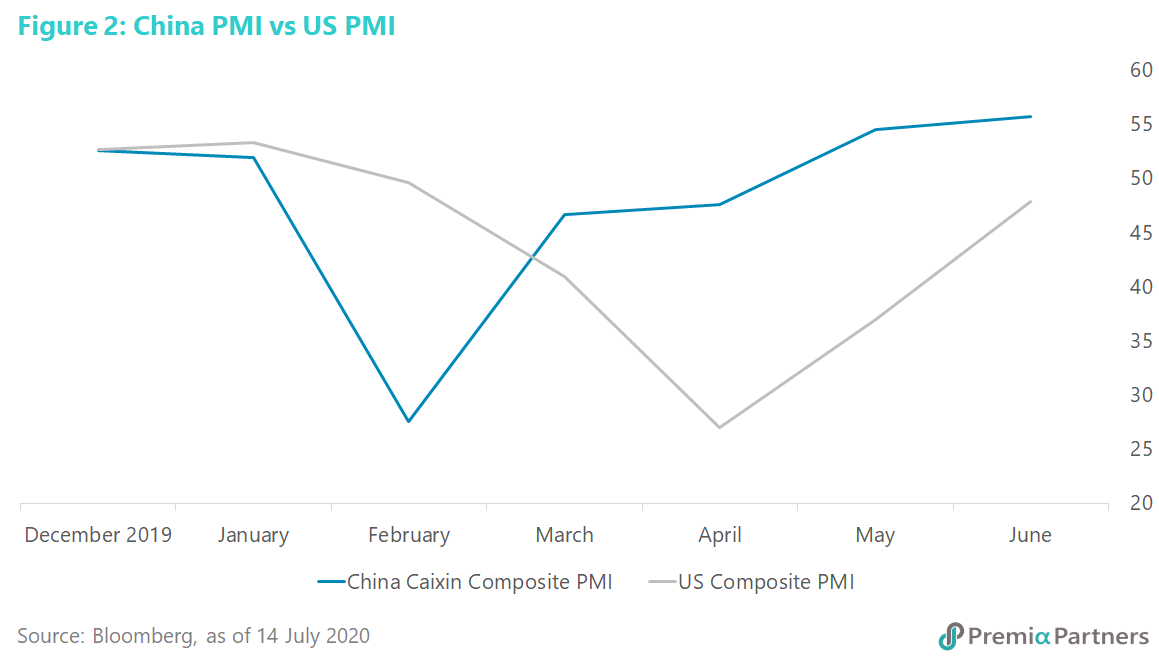
2) As Bill Clinton famously said “it’s the economy stupid.” Nobody stupid here of course, because the Chinese economy has recovered earlier and faster than the US economy. The Caixin Composite Purchasing Managers Index has been back in growth since May, while the US Composite PMI is still in contraction (Figure 2). Meanwhile, TomTom data tells us that Shanghai traffic is pretty much back to 2019 averages. However, New York traffic is still struggling at a bit above half of where it was in 2019, despite President Trump’s aggressive attempts to reopen society and the economy.
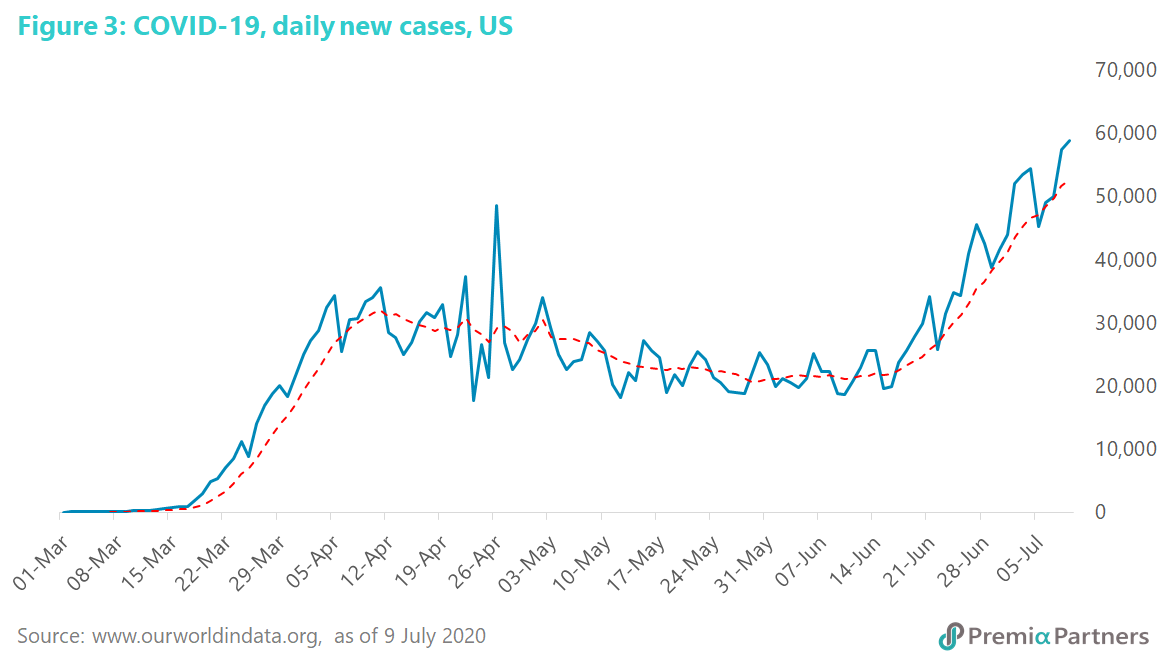
3) We might also add “it’s the pandemic…….” One chart that has gone as vertical as the Shanghai Composite Index is the number of new confirmed cases of COVID-19 in the US. Wave 2 in the US has gone way past the peak of wave 1, with the US at last count recording 59,000 new cases in a single day. Meanwhile, China has brought its daily new cases down to only 10-30 per day through aggressive suppression. (Figure 3)
4) Follow the profits. According to independent research group, TS Lombard: “Balance-sheet data for Chinese industrial firms in May show a sharp increase in profits.” Growth was up 6% yoy from -35% yoy in March. May marked the first positive profit growth for large industrial enterprises this year and appears to support forecasts of a “V-shaped” recovery, the research house said.
5) Relative valuations. The forward PE valuation for the MSCI China index is 13.9x, versus 19.2x for the MSCI ACWI, and 22.3x for MSCI USA. The PBV for MSCI China is 1.9x. It is 2.3x for MSCI ACWI and 3.7x for MSCI USA.
Of course, this does not mean that the Shanghai Comp’s red-hot performance of the past week can continue unabated. Yet, it does suggest there are good reasons for international investors to pause the bubble-like FANGS-plus trade and look elsewhere for growth at a reasonable price.