US valuation is way above the 10-year average. According to Factset, the S&P 500 is now trading at a forward PE ratio of 22x, compared to its 5-year average of 17x and its 10-year average of 15x. Chinese equities, with the CSI 300 now at a trailing 12-month P/E of 17x, is around the middle of its 10-year range of 9x to 28x.
While the top five stocks – Facebook, Apple, Amazon, Alphabet (Google) & Microsoft – have played a significant role in this overvaluation, other sectors have also contributed to the rise in valuations during the pandemic. These are the tech, communication services and consumer discretionary sectors.
Few are denying US tech is a bubble but many want to continue playing it. While tech stocks could push higher on the “Stay/Home”/”WFH” theme, they are a bubble. Few are denying that but many are playing the overshoot of fair valuation nevertheless.
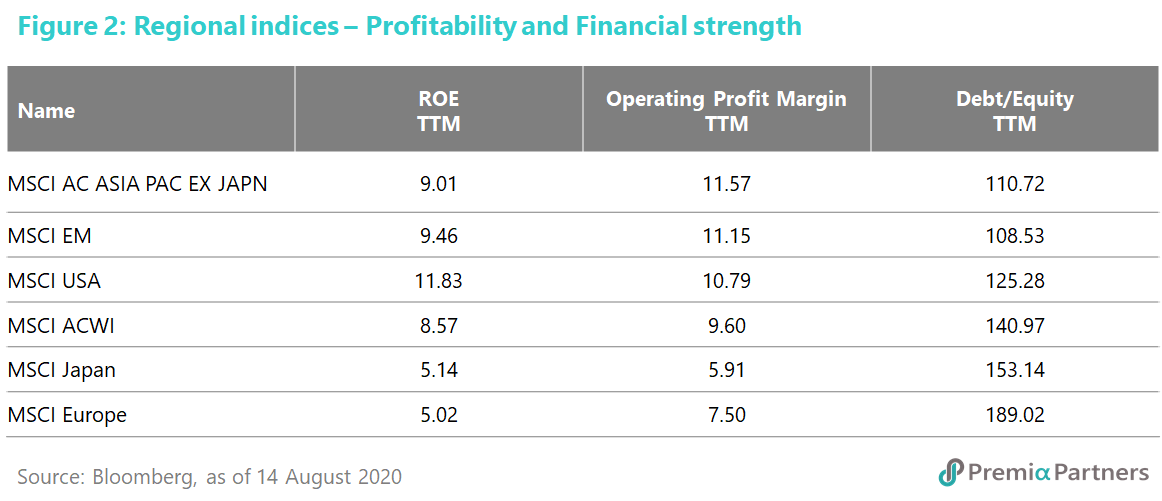
Finding that “sweet spot” between value and quality. Emerging Markets and Asia ex-Japan (proxies: MSCI Emerging Markets and MSCI AC Asia Pacific ex-Japan) offer some of the best valuations among the regional indices and the US. (Figure 1).
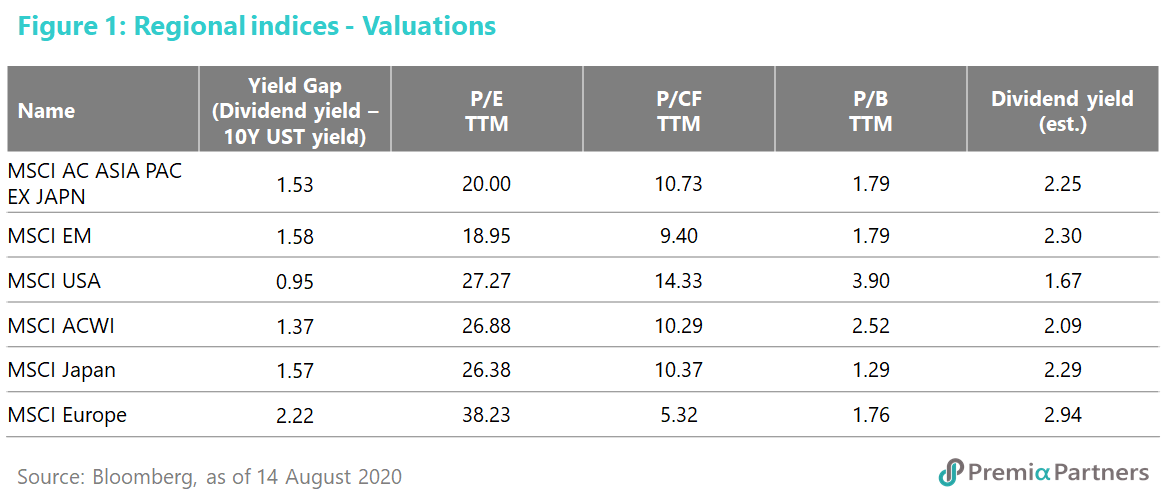
Europe and Japan are either comparable or score lower on some valuation measures but the offset is lower profitability and higher debt to equity ratios.
For example, Japan (MSCI Japan) stands out for its lower P/B ratio (but is more expensive on a P/E basis and pretty much lineball with EM and Asia ex-Japan on other valuation measures). However, it suffers greatly from lower returns on equity and operating profit margins and it has less balance sheet strength, with a much higher debt-to-equity ratio (figure 2).
Conversely, US equities (MSCI USA) offer higher ROE and OPM, but carry higher debt to equity ratios and demand much higher valuations.
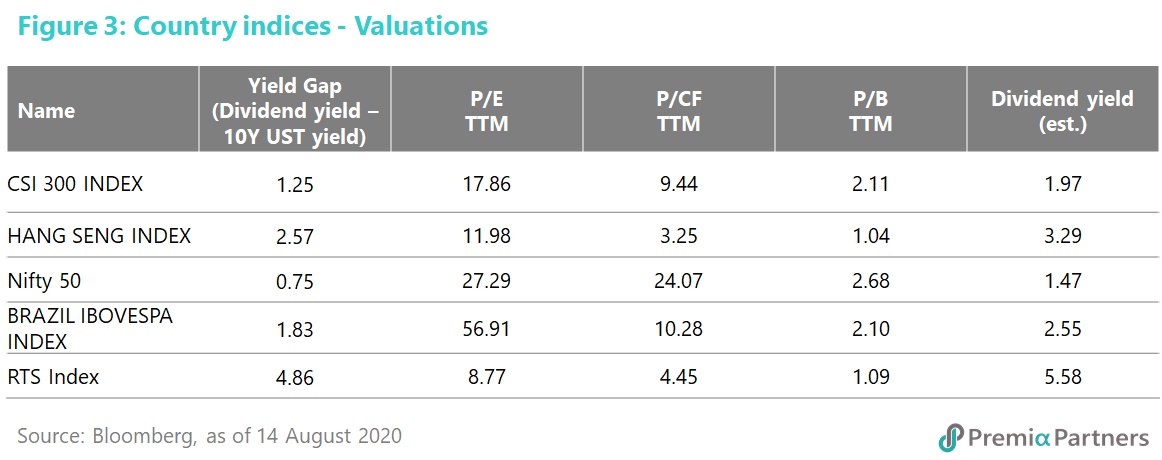
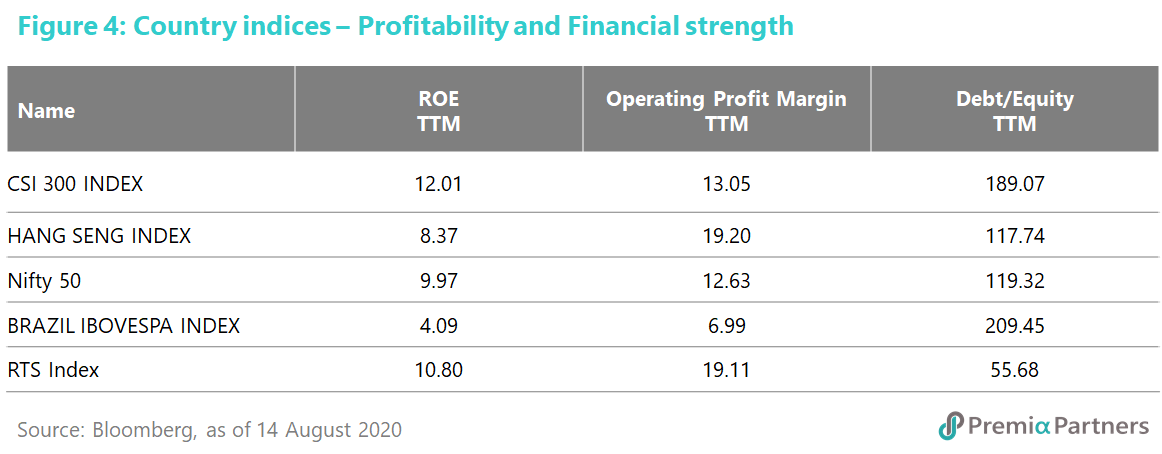
China, HK equities as the best EM proxy plays now. Drilling down into Emerging Markets and Asia ex-Japan, we find that China and HK equities sit in that same “sweet spot” between valuations, profitability and balance sheet strength (figure 3).
Looking at other BRIC markets, only Russia stands out as offering lower valuations than China and Hong Kong equities and also higher profitability and lower debt/equity (figure 4). The “catch” there though is Russia’s chronically low GDP growth rate compared to China. In any event, the energy sector accounts for over half of the MSCI Russia index, and there are alternative plays for this amongst the oil majors.
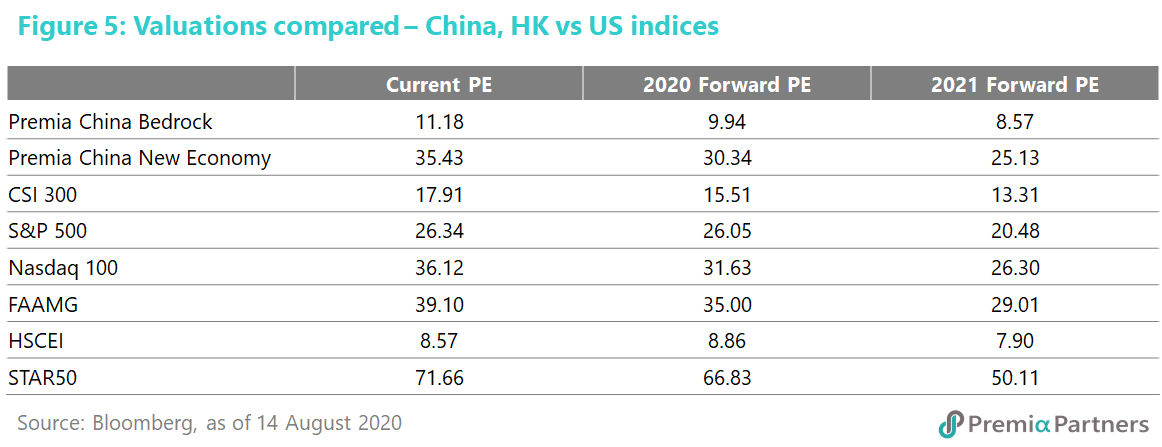
China Vs US equities – looking forward at valuations and PEGs. The above valuation measures – with the exception of dividend yields – are backward looking. A forward-looking “reality check” reveals much the same story.
China and HK equities offer better value in “like-for-like” (for example, we line up Nasdaq 100 & FAAMG against China New Economy) comparisons (figure 5).
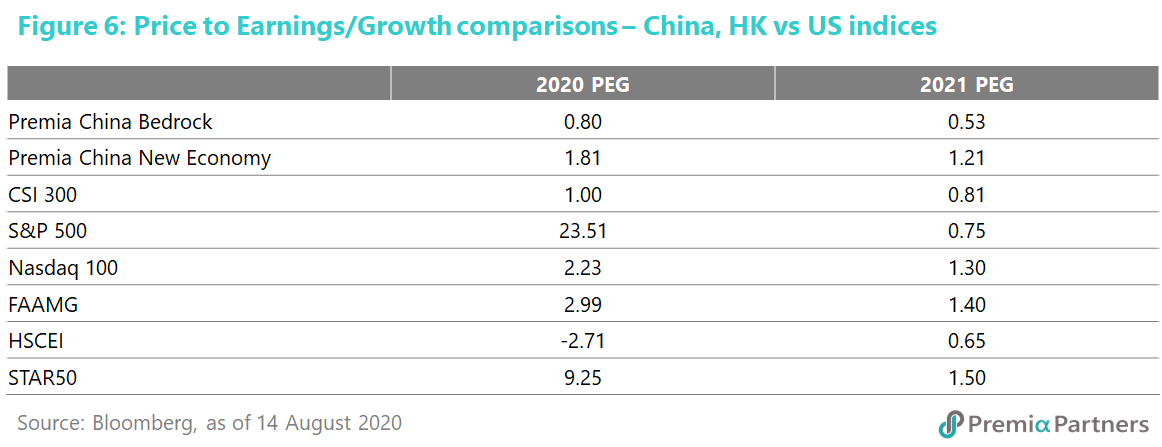
On growth-adjusted valuations – using the Price-to-Earnings/Growth or PEG ratio – Chinese equities look even more compelling. That is driven by China’s economic growth potential versus the US.
That’s a theme that also relates to the epidemiological and economic management of the pandemic in the two countries: China choosing to focus aggressively on containment of the virus over massive fiscal stimulus, and the US failing to contain the virus but engaging in unprecedented fiscal spending and monetary expansion, which then fuels selling of the US Dollar, another negative for US equities.