
Summary
Expect lower returns next year. The “triple peaks” in economic growth, earnings growth and policy stimulus will likely result in much lower returns for US equities in 2022. Indeed, we see persistently high inflation – which will likely run hotter in the US than Europe and Japan – causing greater volatility as US equities are put on tenterhooks over the timing and magnitude of rate hikes.
Omicron won’t buy the market much more time from rate hikes. While it is possible that the emergence of the highly transmissible Omicron variant could buy some time from rate hikes, high inflation will likely limit the amount of time that can be borrowed. Markets anticipate months ahead anyway. The further we progress towards mid-2022, the more unsettled markets will likely get.
Why US could underperform vis-à-vis Europe and Japan. The US market’s greater exposure to growth stocks – that is, mostly tech – will make them more vulnerable to earnings duration risk than other Developed Markets.
European and Japanese equities are likely to outperform the US, given the likelihood of lower rates of inflation, leaving them at zero (rates and yields) for longer. Their lower valuations and greater exposure to value stocks will also help.
Chinese equities, as reflected by the CSI 300 index – appear to be on the cusp of a reversal for 2022 on easier financial conditions. China’s policy restraint – while DM central banks were engaging in unprecedented policy stimulus during the pandemic – means it can now engage in counter-cyclical stimulus as the US starts tightening. The early December 50-basis point cut in most Chinese banks’ Required Reserve Ratio (RRR) likely signaled the start of an easing cycle – albeit cautious easing – in China. Perhaps not coincidentally, the Politburo followed that up with a statement of intent to “promote the healthy development” of the property sector. The above could be the trigger for a reversal in sentiment towards an equities market that is already technically oversold and trading at very low valuations.
US Dollar could weaken on inflation rather than strengthen on higher Treasury yields. Over short periods of time, higher yields at the short end of the Treasury yield curve can be supportive of the US Dollar. But over longer time frames, periods of sustained high inflation have been negative for the US Dollar. The secular decline of the US Dollar Index, which we believe started in 2017, looks set to resume again very soon, running through the course of 2022. The likely higher inflation in 2022 could nullify increases in UST yields. The flood of US Dollars created by the unprecedented monetary expansion of 2020-2021 will overhang the value of the currency against the majors.
Emerging Markets usually do better during periods of Dollar weakness but this time we could see a new twist – favouring China. In both absolute and relative performance (vis-à-vis the US market), the MSCI Emerging Markets Index tends to do better during periods of Dollar weakness. But this time, the combination of generally low vaccination rates, high inflation and upward pressures on interest rates leaves most EM economies with less policy space to manoeuver. This leaves us with China as the preferred proxy, as it has more fiscal and monetary space than most others within EM.
Triple Peaks Meet Omicron
Omicron may not be a gamechanger, but it won’t be helpful either. The rise of new “variants of concern” was always a known threat. Hence, a 2-steps forward, 1-step back shuffle towards reopening was always the likely process anyway. Omicron is not a gamechanger. Yes, it has the potential to force some economies back into lockdowns, but it won’t reverse the trend towards reopening. Vaccines will be reworked in coming months. Indeed, Pfizer said it could deliver an updated vaccine to deal with Omicron within 100 days, if the new variant was resistant to the current version. Treatments are also being worked on.
Fed funds futures pricing of rate hikes by mid-2022 went down as a reaction to Omicron but has come back up again. Just as Omicron won’t reverse the course on reopening, it won’t reverse the direction of rates and yields in the US either. It may buy a little bit of time but the writing on rates and yields is on the wall – they look set to go yet higher. The Fed funds futures pricing of a 25-basis point rate hike by June 2022 has moved around a bit since the emergence of Omicron, but it is not much changed from a month ago. Indeed, pricing of a 50-basis point hike had gone up from 11% early November to 24% one month later. We are not underplaying the health threat posed by Omicron. An early study (by Professor Nishiura Hiroshi from Kyoto University) suggests it is 4.2x more transmissible than Delta. Against that, early evidence from South Africa suggests it is less deadly. Yet, even with a smaller percentage of hospitalisations but a vastly larger case load, hospitals will be overwhelmed. Already, early evidence suggests a surge in “excess deaths” in South Africa. While it may be traumatic – and early in the year we could see some repricing downwards (again) of rate hike probabilities – it won’t change the “two-steps forward, one step back” path out of the pandemic.
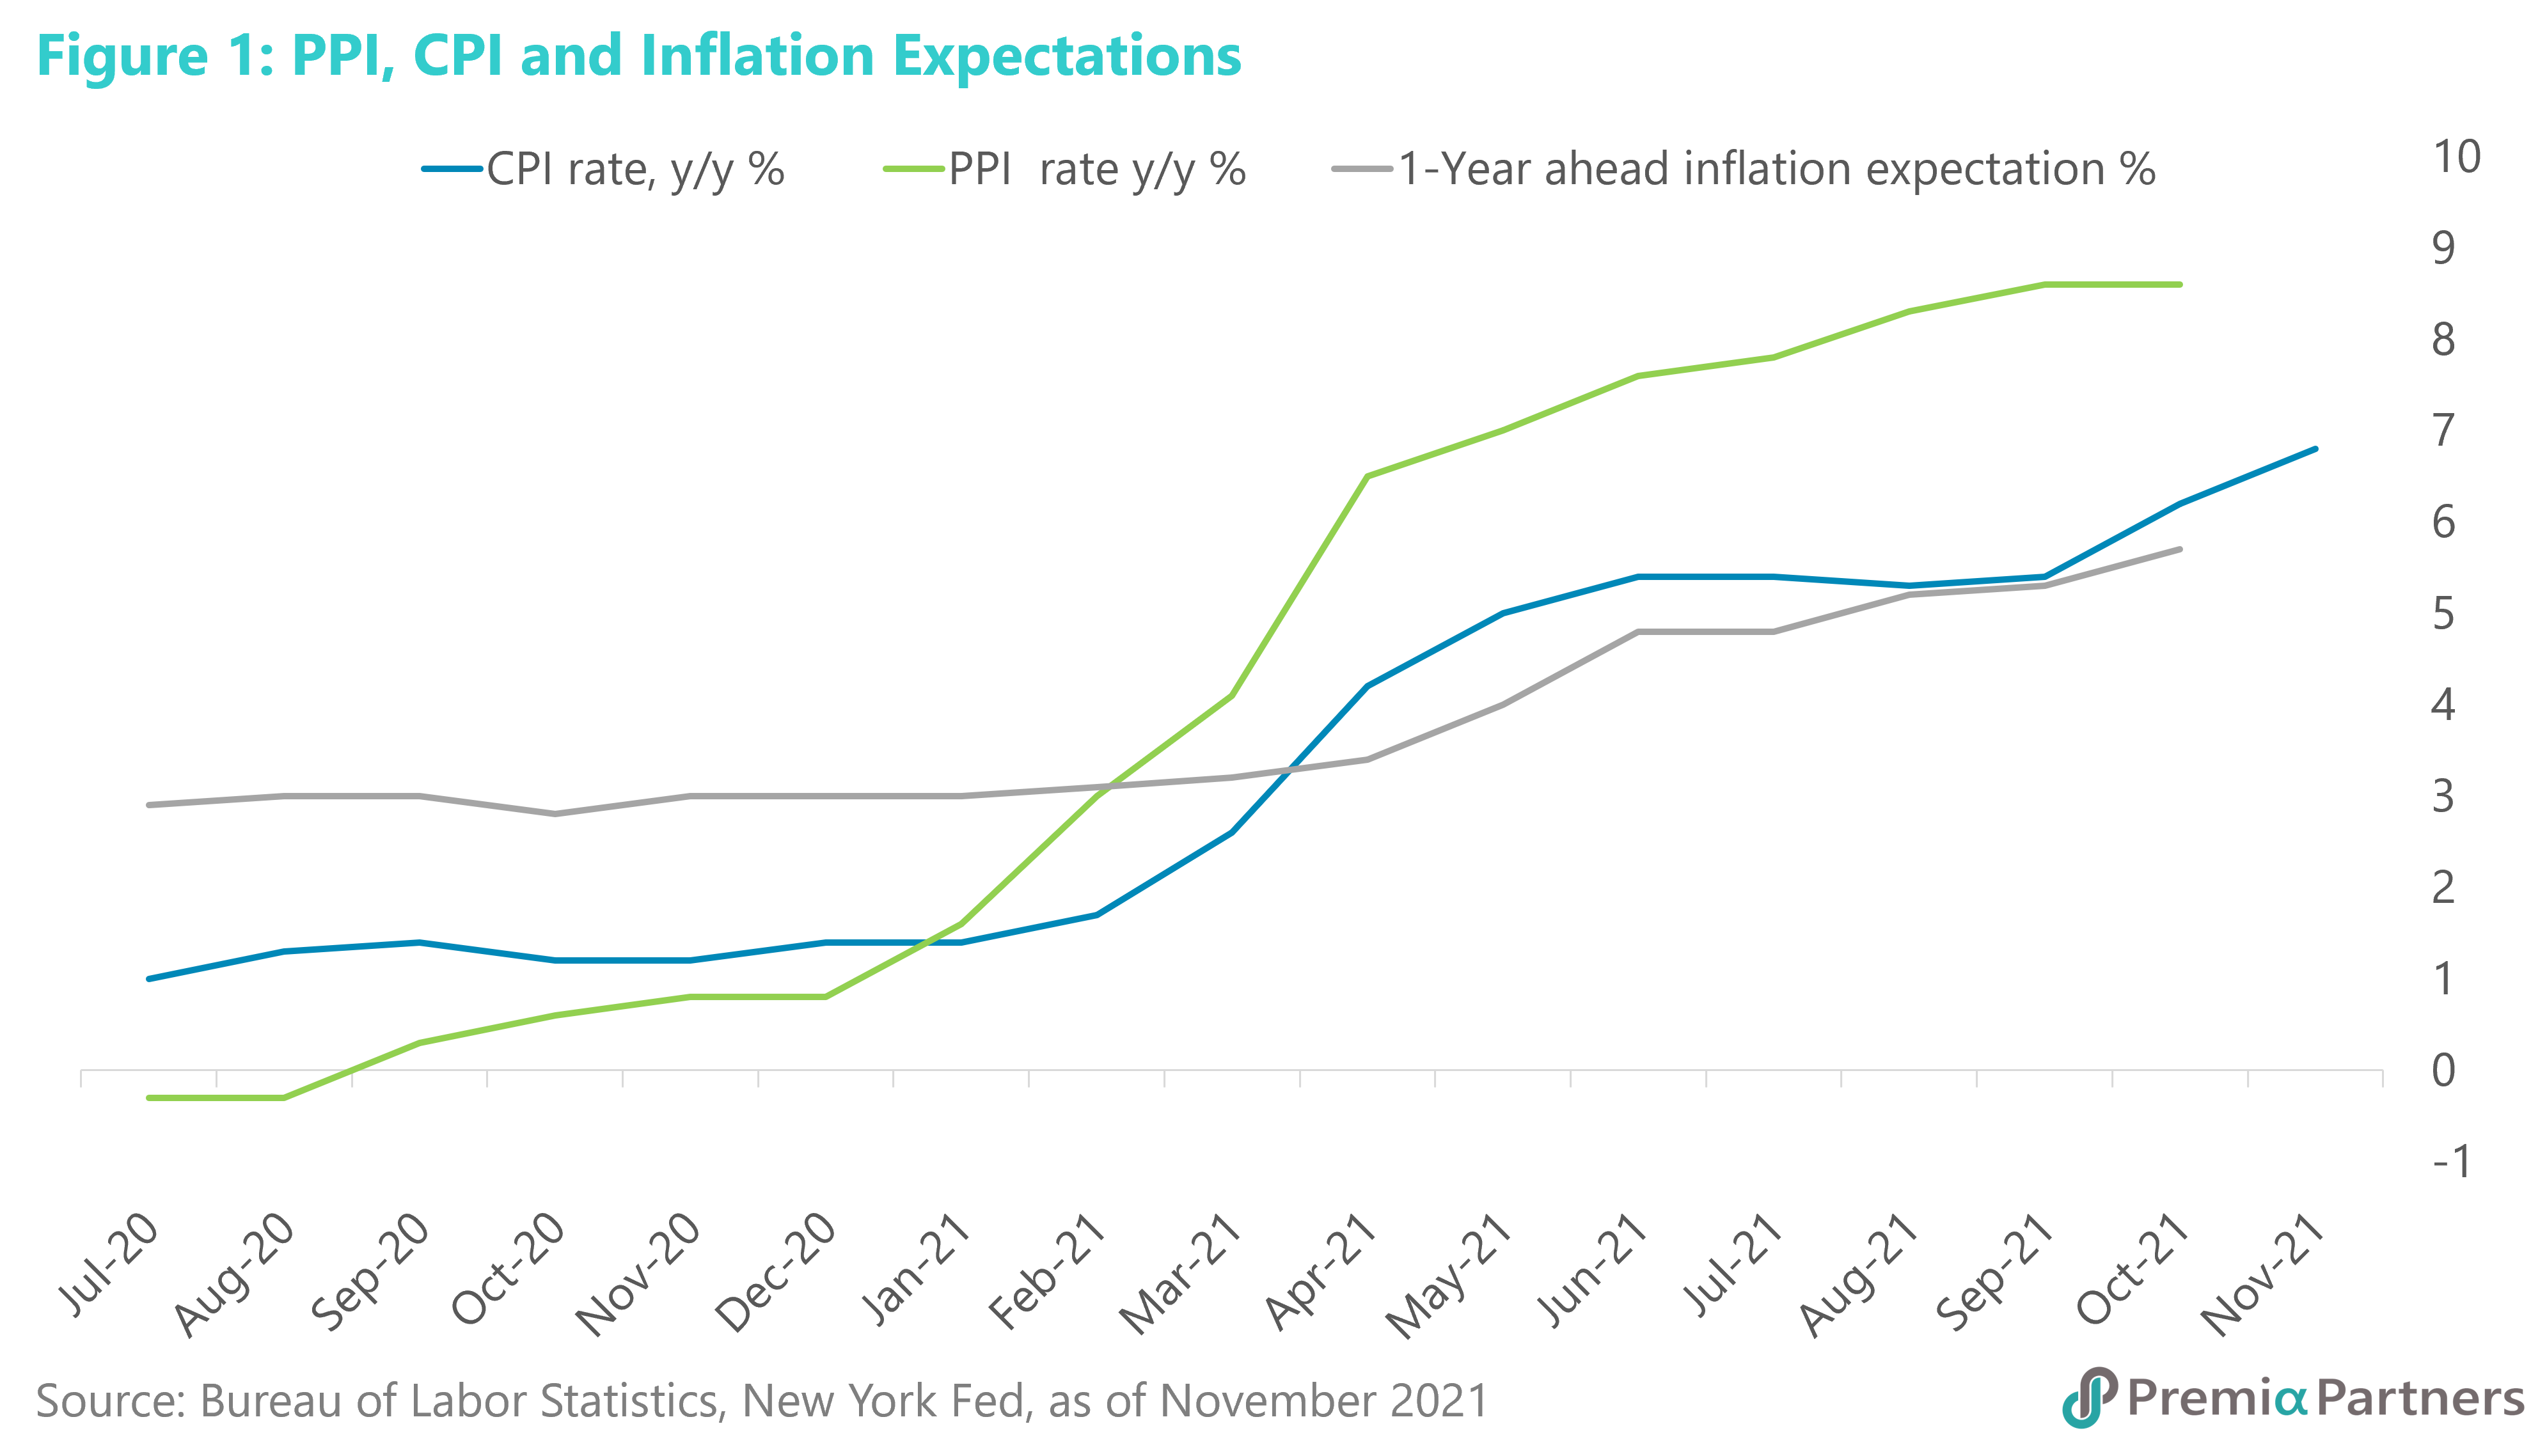
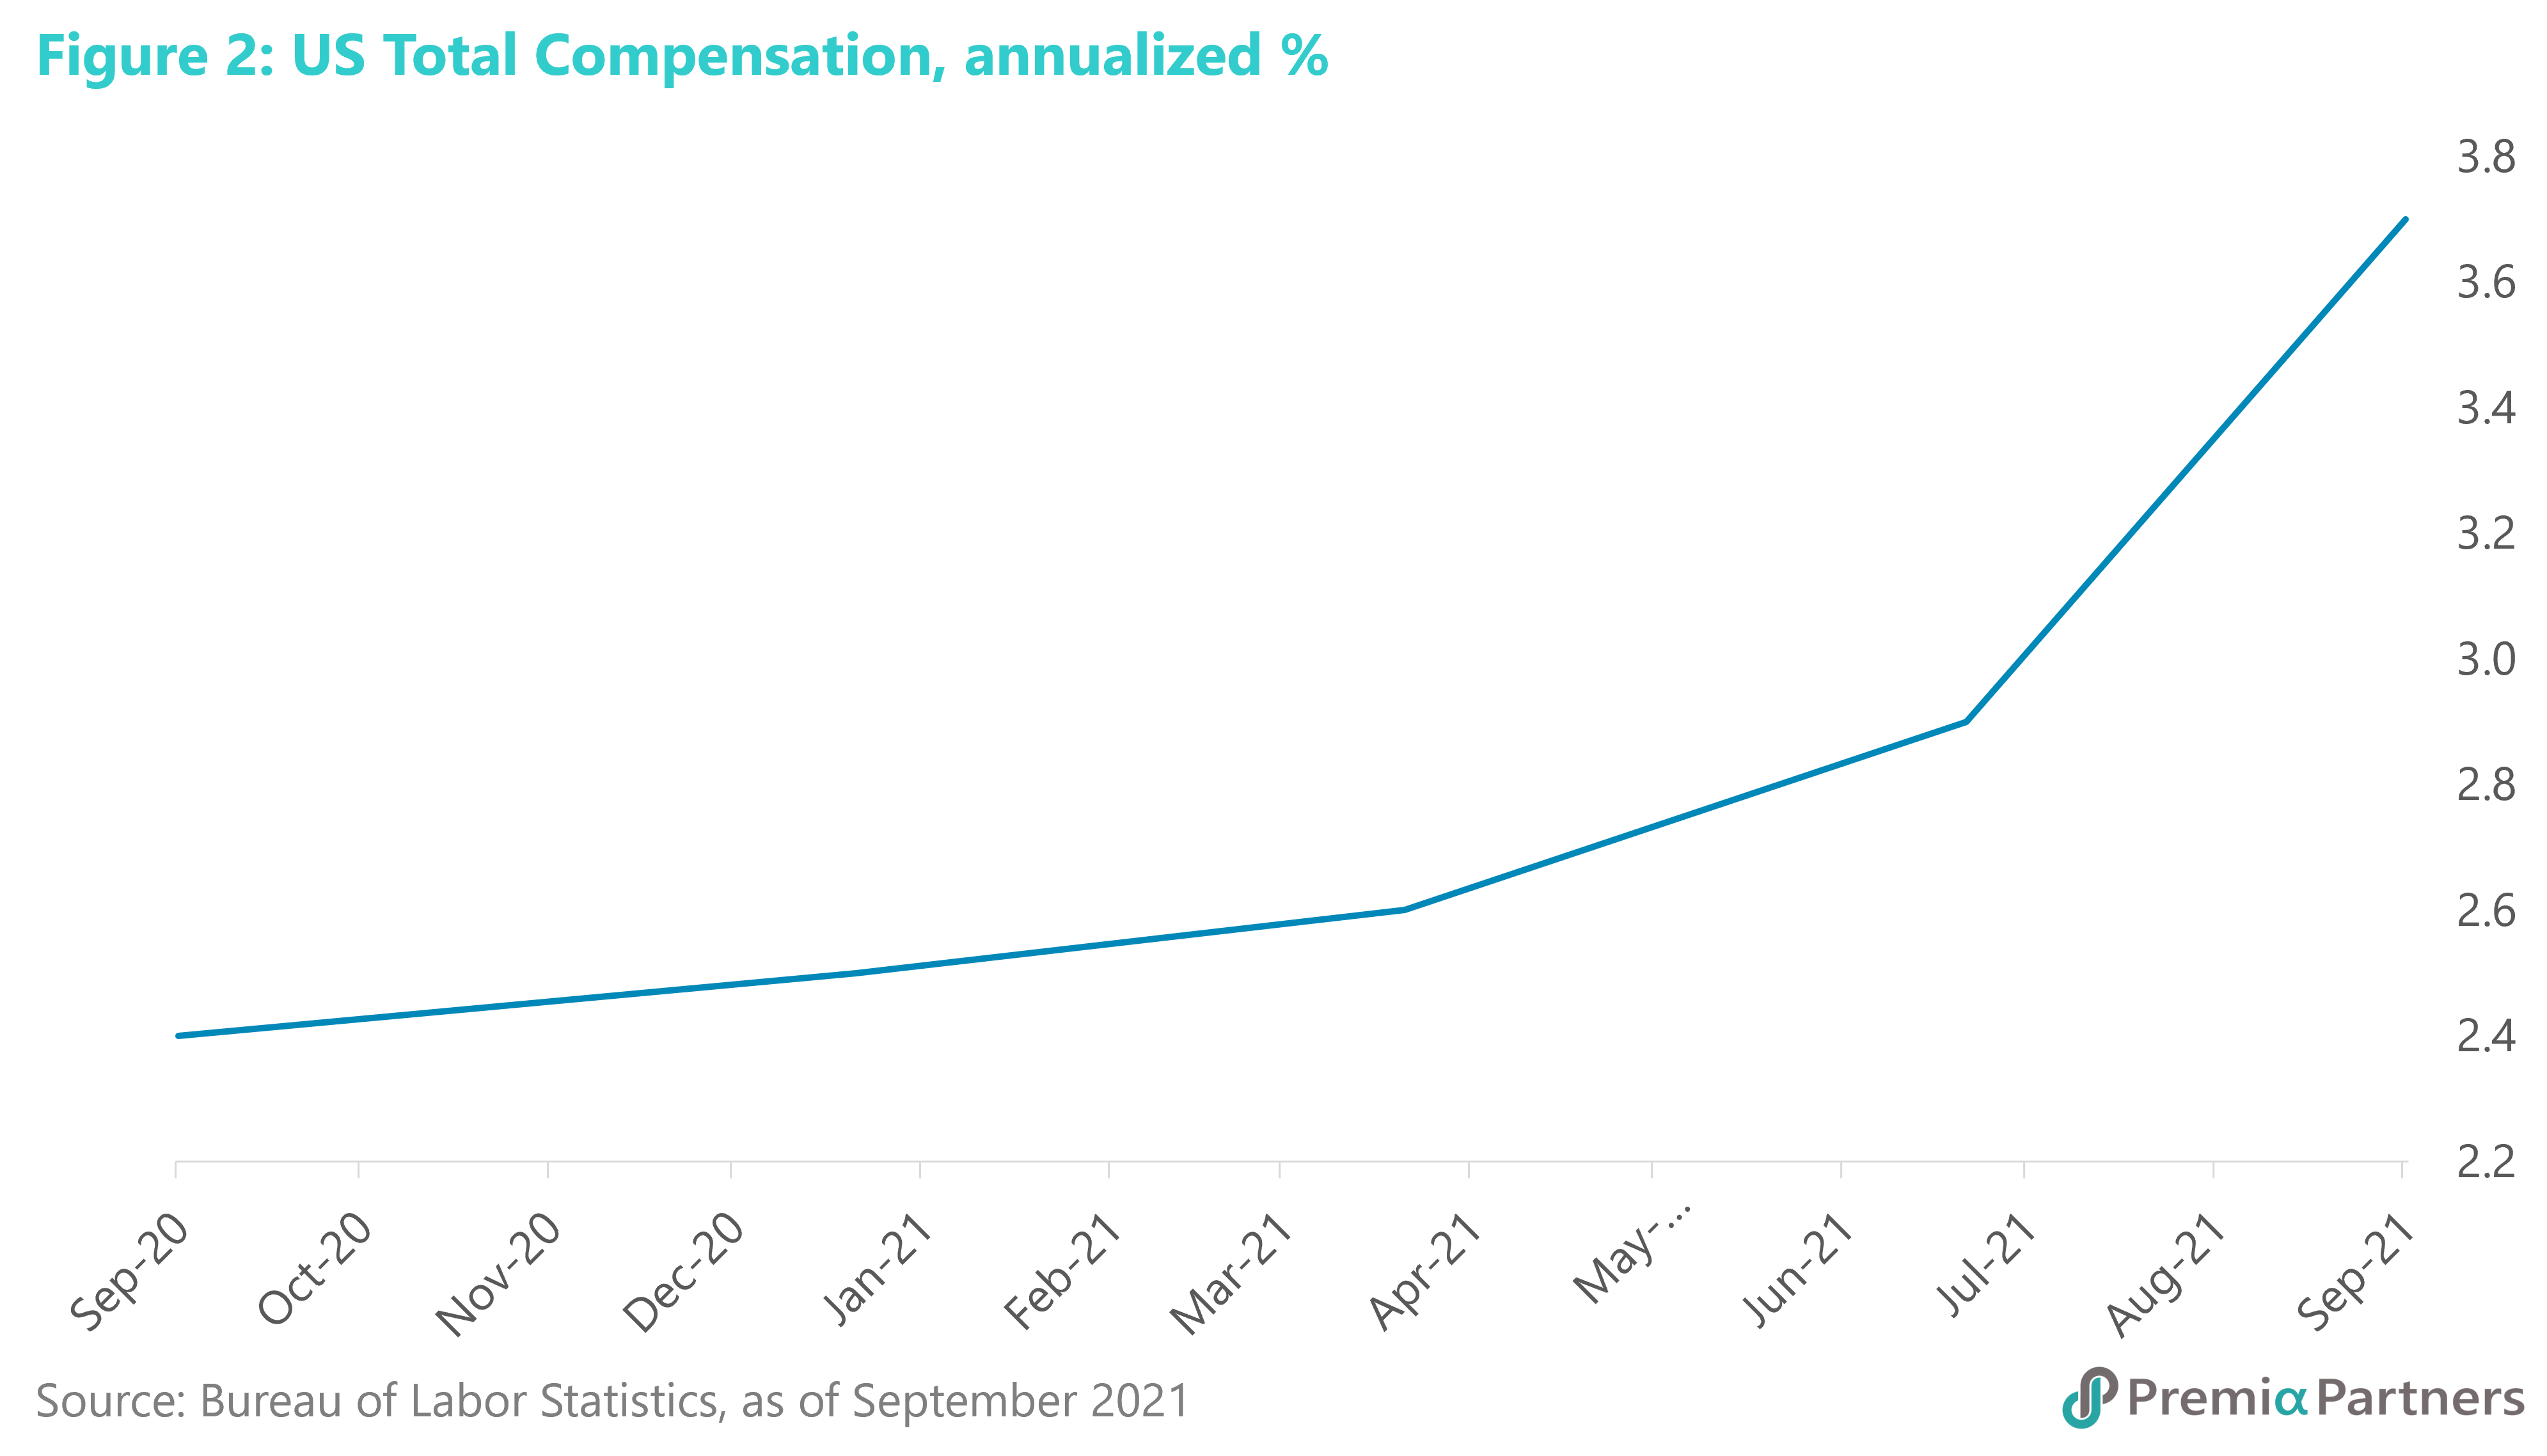
Indeed, Omicron could catch the Fed in a pincer movement between higher prices and slower growth. As we had written previously, https://www.premia-partners.com/insight/us-equities-the-challenge-of-scaling-the-triple-peaks the US market was already facing the “triple peaks” of economic growth, earnings growth and policy stimulus. What Omicron could do is slow US economic growth for 1-2 quarters until new vaccines and/or booster shots are delivered. That’s climbing down further from the peak of economic and earnings growth. But at the same time, it could worsen supply chain problems, aggravating inflation, and leaving the Fed with very little room to move. The inflation problem has not been transitory as previously dismissed by the Fed and US Treasury. Indeed, it may be embedding itself as producer price surges, higher consumer price inflation, higher inflation expectations and increased compensation (wages and benefits) feed on one another (figures 1, 2).
Asset Allocation – transition to tightening, pivot from US equities
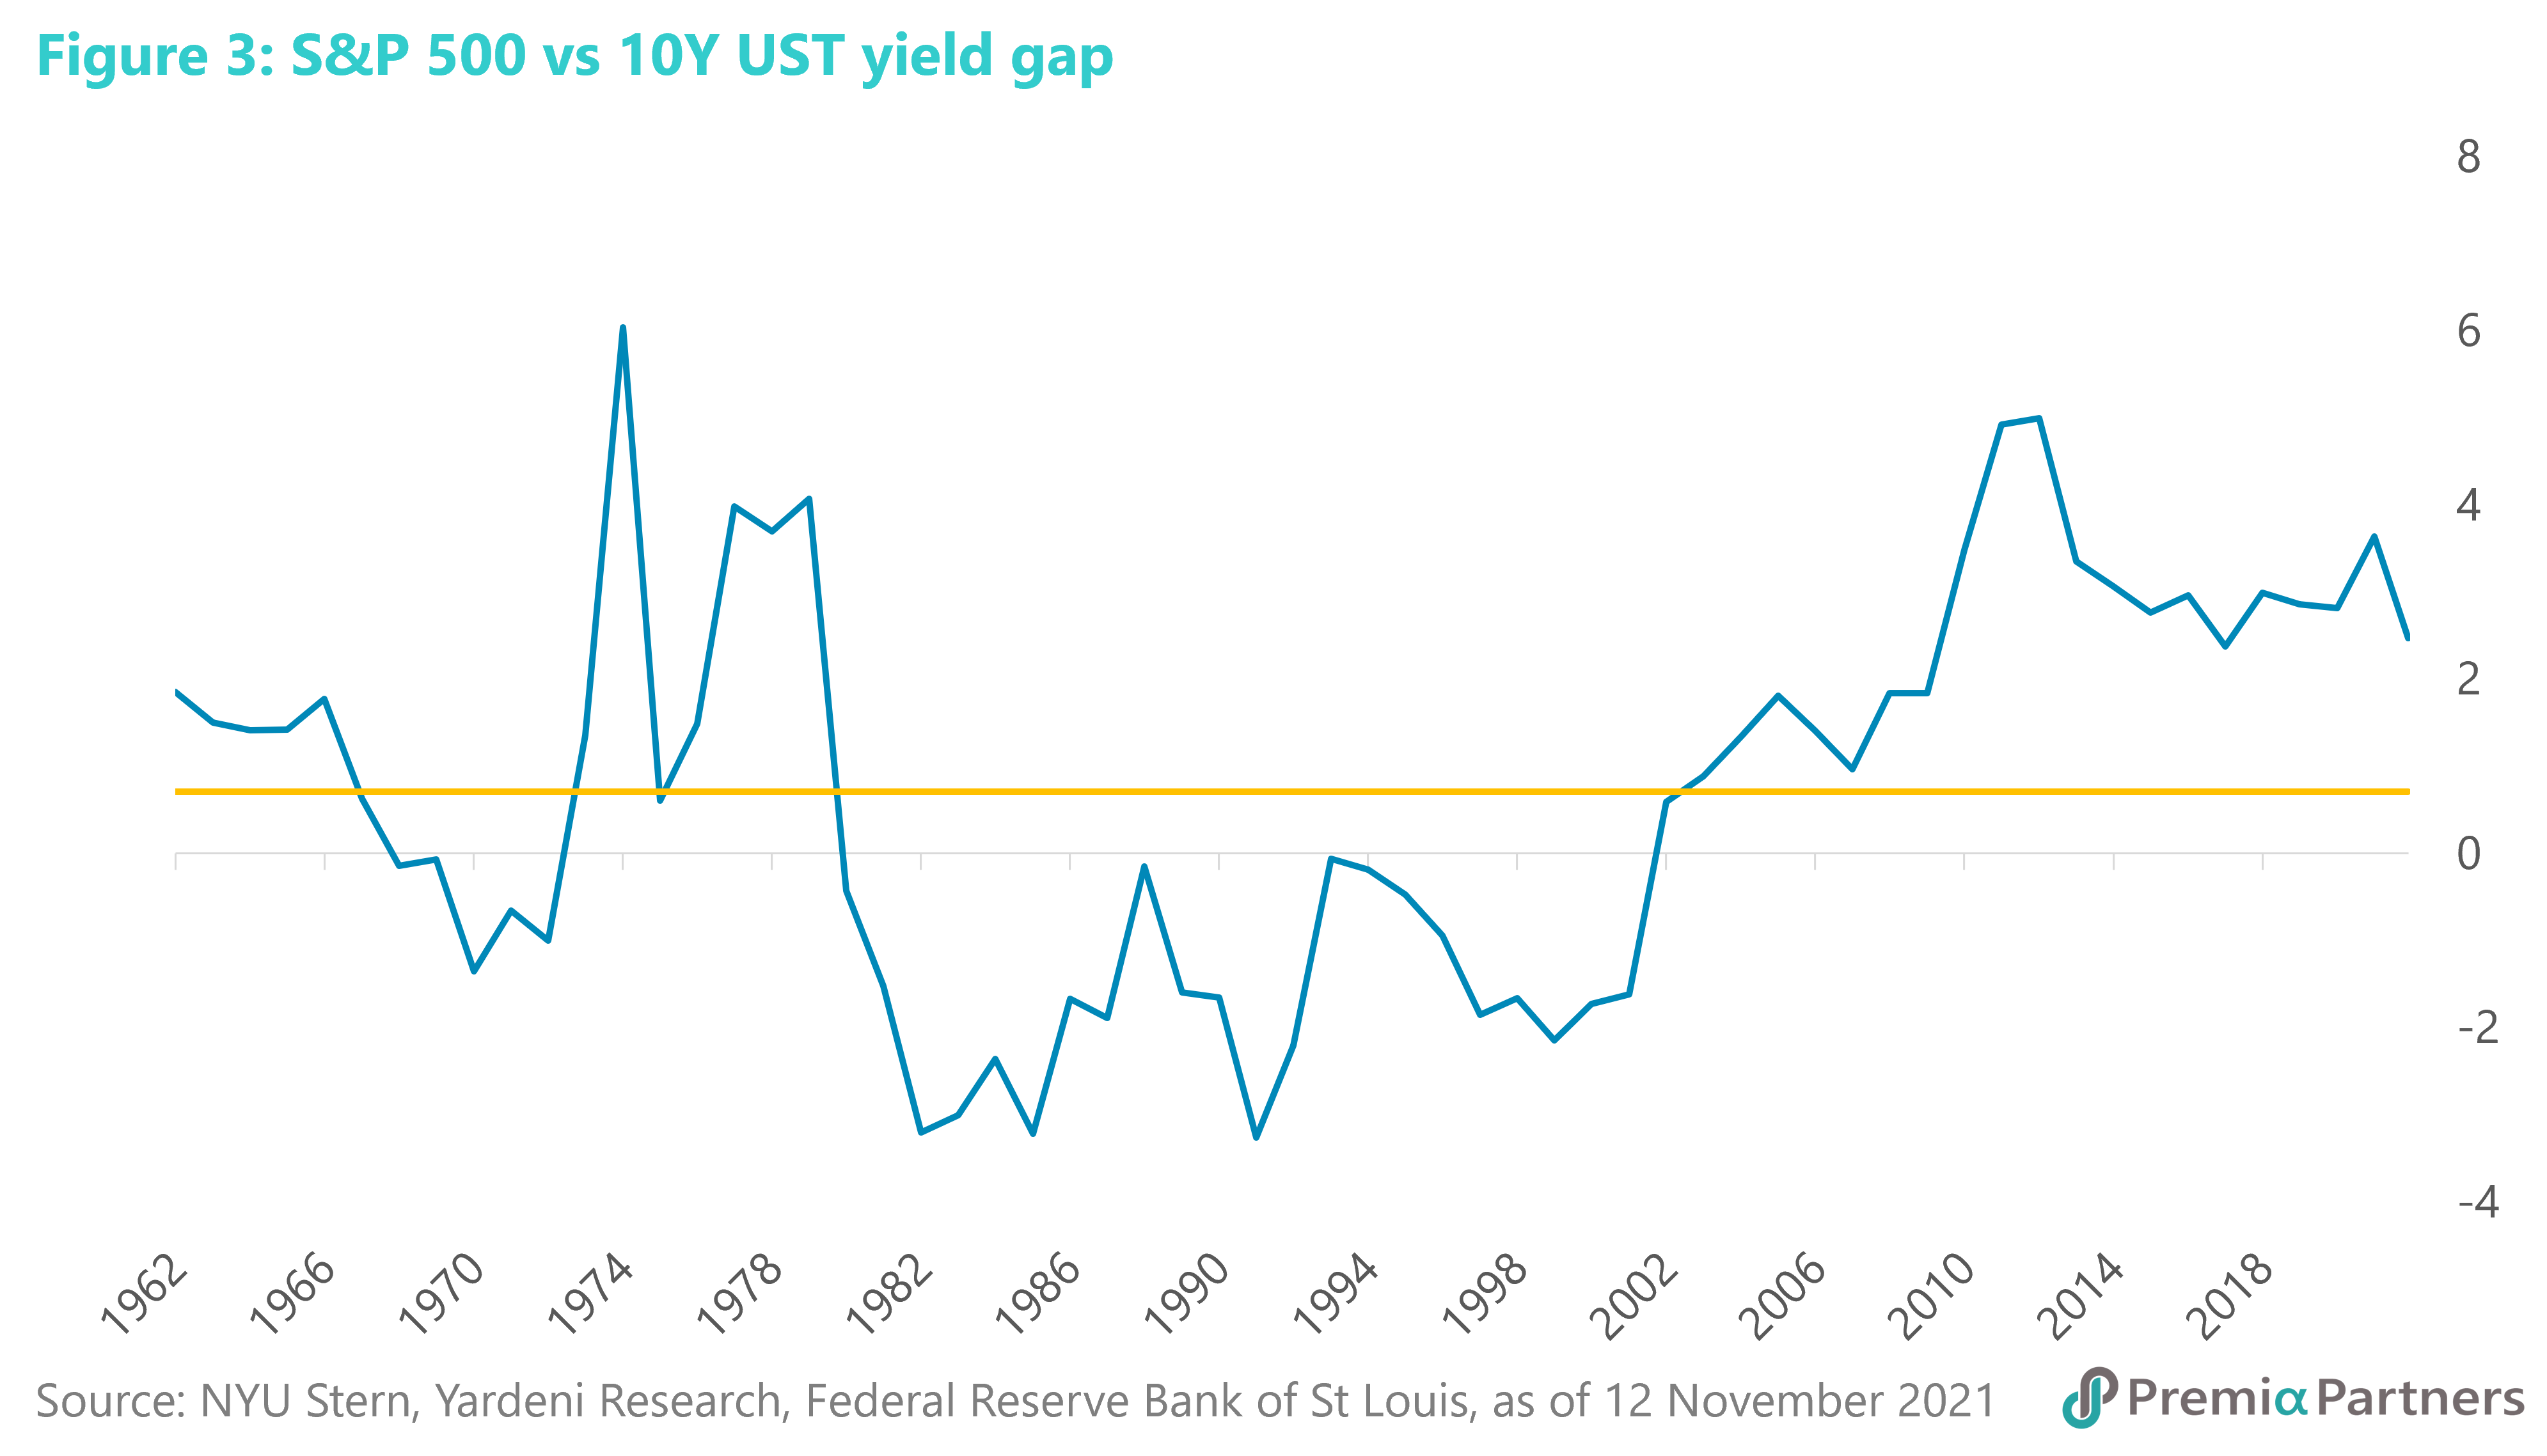
Underweight US: High stock valuations and the prospect of higher rates will limit gains this year. With a still sizeable gap between the S&P 500 equities earnings yield and the 10Y UST yield, a bear market does not appear imminent. The current forward earnings yield stands at 4.7%, against the 10Y UST yield of 1.48%, giving investors a positive yield gap of 322 basis points. The 20-year average for this yield gap is around 250 basis points. The more recent bear markets of years 2000, 2008, 1990, and 1987 were preceded by that yield gap falling to or below 200 basis points. Even from a trailing earnings perspective, the situation is not alarming yet. The trailing earnings yield for the S&P 500 is currently around 4% versus a 10Y UST yield of around 1.5%, leaving the market with a positive yield gap of 250 basis points versus a six-decade average of around 70 basis points (figure 3).
But to be clear, the saving grace for US stocks is not their valuation. At 21x NTM earnings, it is way more expensive than European and Japanese equities.
The saving grace is the still low risk-free rate, as reflected by the 10Y UST yield. However, that will change as the months move on. The prospect of higher yields and slower earnings growth will limit gains.
Bifurcating US inflation into cost-push and demand-pull is not particularly helpful at this time. Both cost-push and demand-pull inflation are feeding on one another. This is not just the result of supply chains broken by the pandemic. There are also coincidental factors driving energy prices higher, driven to a significant extent, ironically, by energy transition causing underinvestment in fossil fuels, putting more oligopoly power in the hands of OPEC+. Food prices had also been rising from early 2019, aggravated by animal disease and extreme weather. On the demand side, extreme fiscal stimulus in the US has seen a surge in cash sitting in household bank accounts, which would have contributed to the grab for goods, since services had been curtailed.
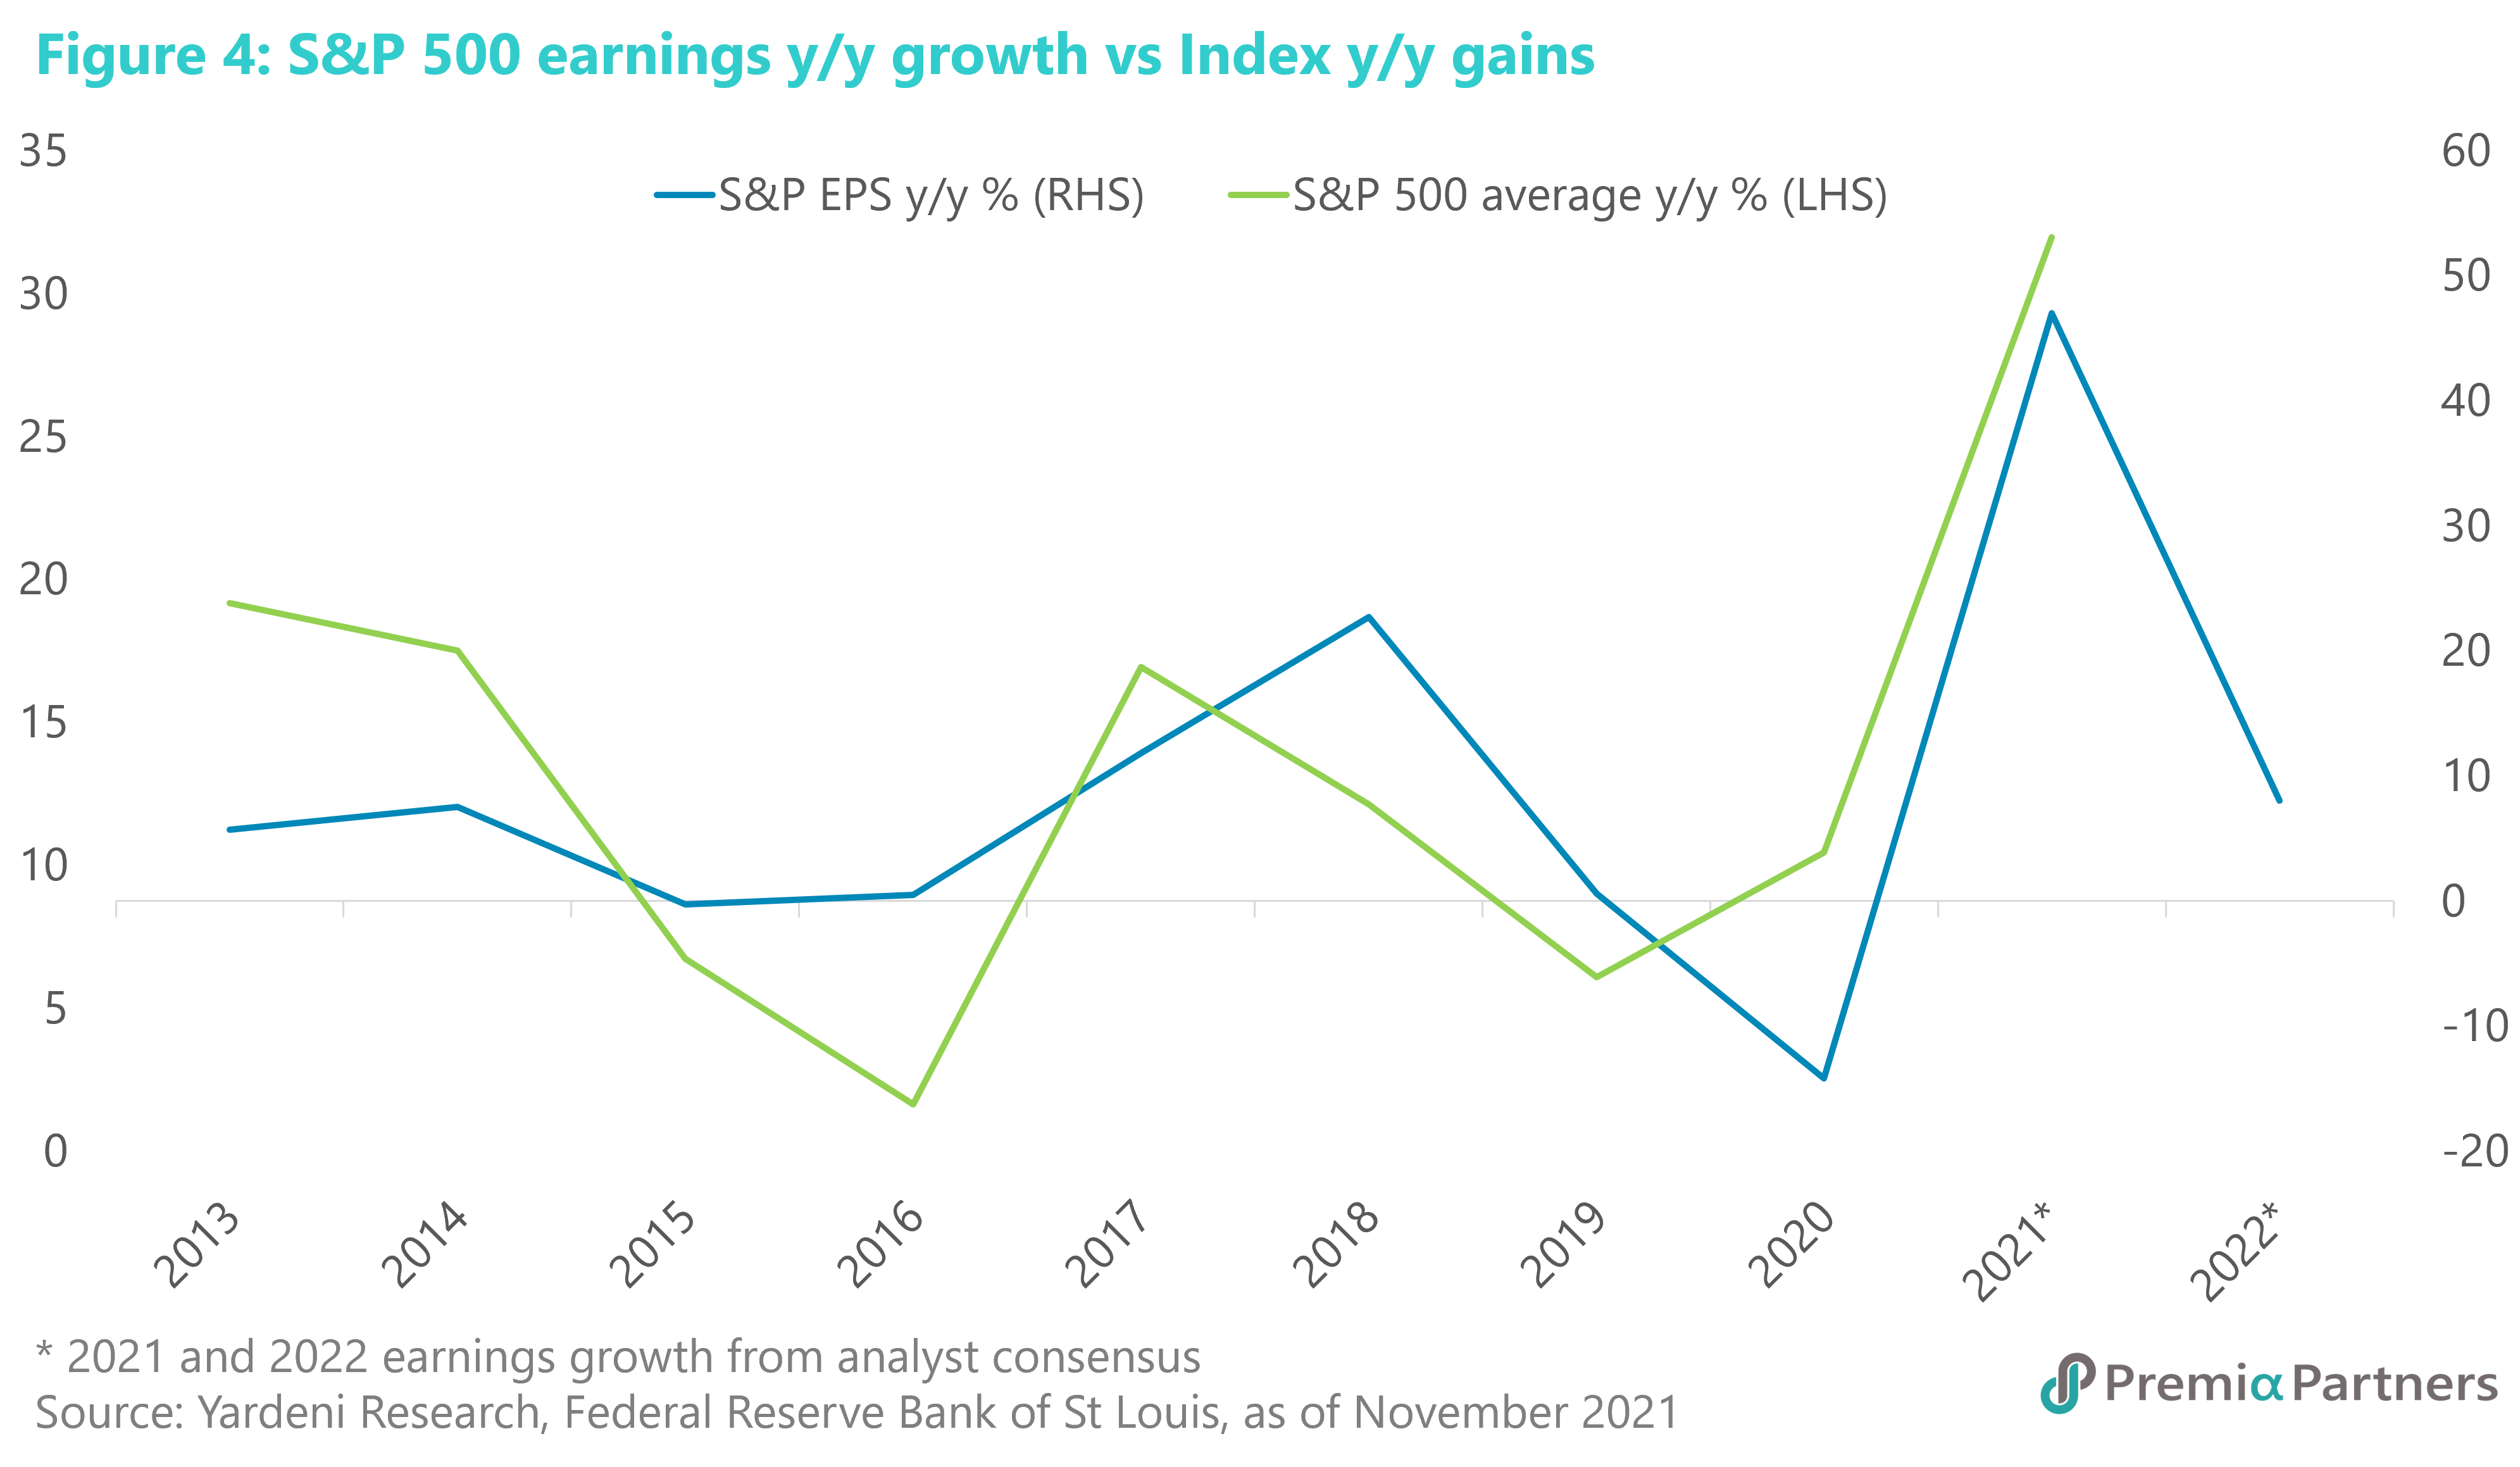
But of course, inflation rising in line with economic growth (hence giving companies rising volumes, defensible margins and strong earnings growth) is way more preferable to inflation rising despite slowing economic growth (hence leaving companies with less defensible margins and slower earnings growth). We had the former – pro-cyclical inflation – in 2021. We are likely to get the latter – counter-cyclical inflation – in 2022, as we climb off from the peaks of economic growth and stimulus. Bottom line: earnings growth will ease dramatically, and with that we see much smaller gains in US equities (figure 4).
Also, higher yields will likely hurt “growth” stocks more than “value” stocks, given that tech stocks have longer earnings duration than value stocks. This is the result of tech stocks having more of their earnings in the more distant future. There is an argument that the payback period – defined here as the number of years of earnings required to cover investments – for the Nasdaq 100 is not much longer than for the S&P 500, given the higher earnings growth for tech stocks. But that is a comparison against a broader S&P 500, rather than the value stock subset. Anyway, in markets, perception is key. Over the past year, the Nasdaq 100 has had a vastly higher beta to 7-10 year USTs. We wouldn’t bet on these arguments (worthy though they may be) changing market behaviour anytime soon.
Indeed, we see a bottoming out of value versus growth stocks’ relative performance. The higher proportion of growth stocks in the US market – a big boost for outperformance during pandemic lockdowns – will turn into a drag on reopening.
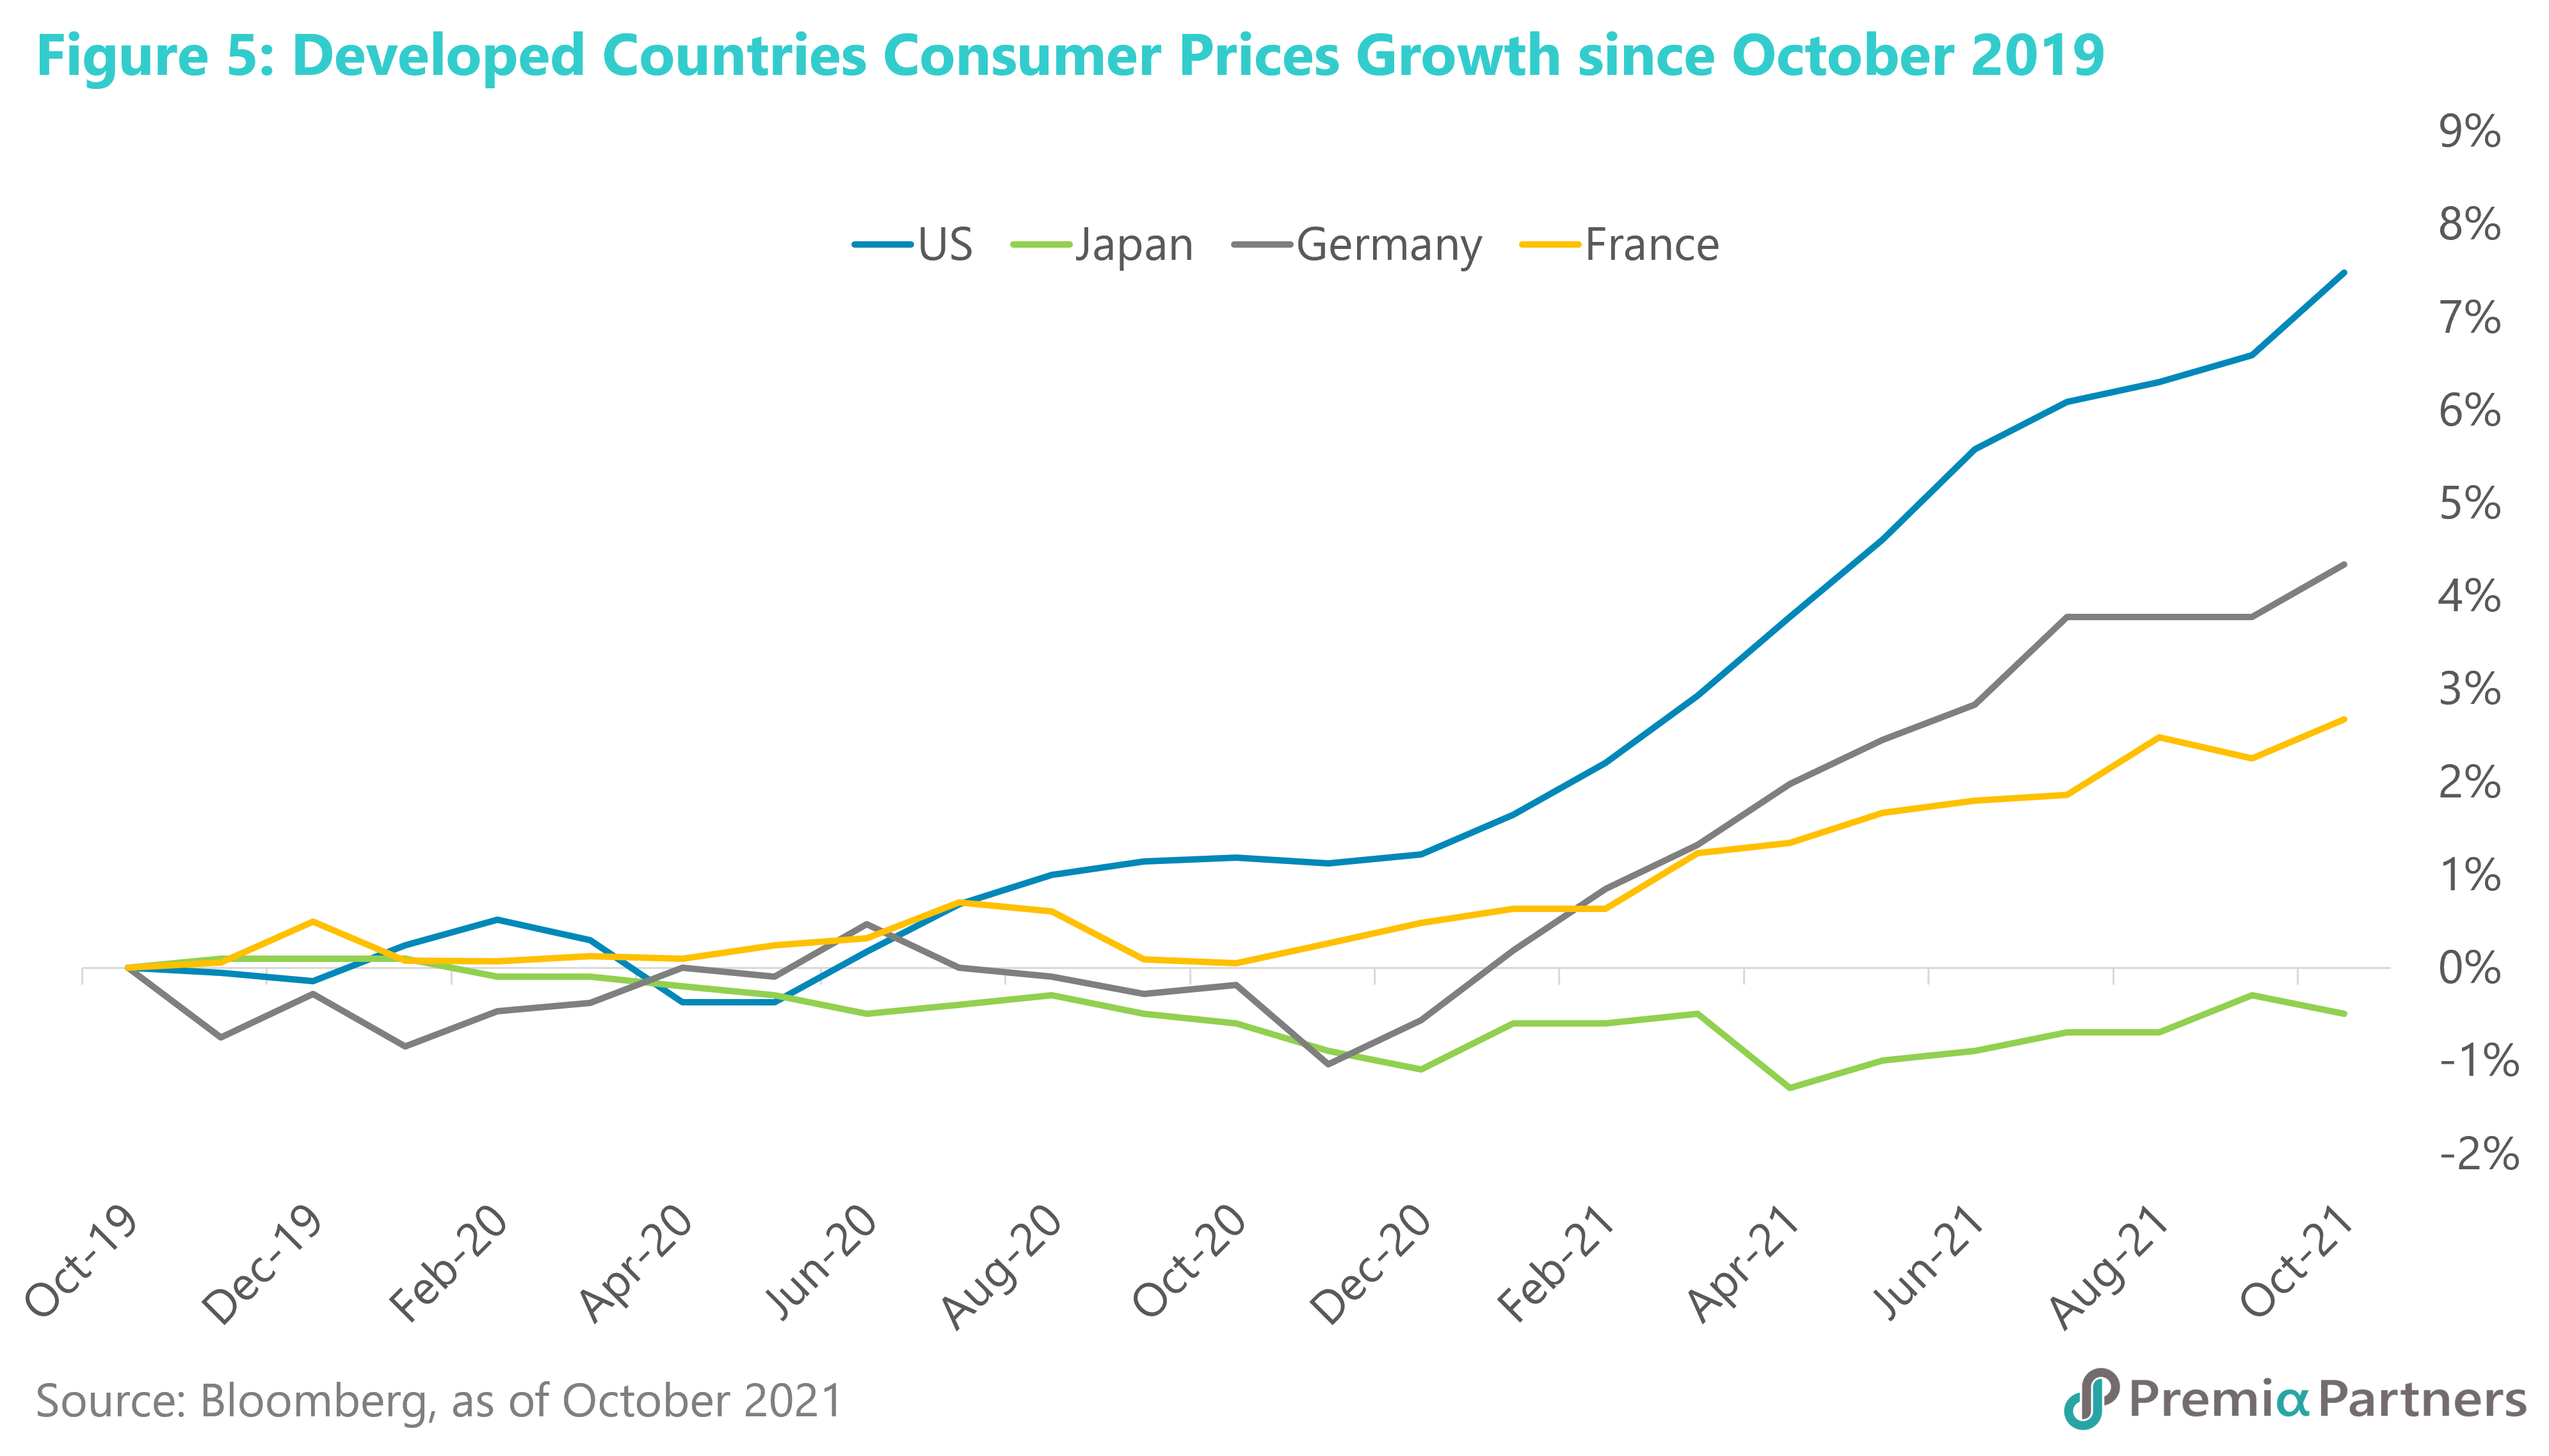
Neutral weight for European and Japanese equities on zero for longer. US inflation is running ahead of European and Japanese inflation (figure 5). There is greater risk of second round effects in the US, given the substantial rise in days lost through industrial disputes there, and the surge in total compensation. In contrast, Euro Area negotiated wages – which had declined since the start of the pandemic – have yet to show any turnaround. In Japan, a recent Reuters survey found more than half of companies intend to freeze wages next year and 4% wanted to cut them.
All this means much less pressure on the European Central Bank and the Bank of Japan to tighten policy compared to the Fed. That is reflected in the 10Y UST Yield of around 1.5% versus -0.35% for the 10-year Bund and zero for the 10-year JGB.
Those zero and sub-zero 10Y government bond yields leave European and Japanese equities with larger positive yield gaps favouring equities – around 7.4% for MSCI Europe and 7.1% for MSCI Japan. To recap, US equities are currently trading at a 4.7% yield gap by comparison.
The higher percentage of Europe and Japan’s exports to China (relative to the total) compared to the percentage of US exports to China is another positive, given the turning of the policy cycle in China. Europe sends around 11% of its exports to China. Japan is almost double that at 20%. The US sends around 8%-9% of its exports to China.
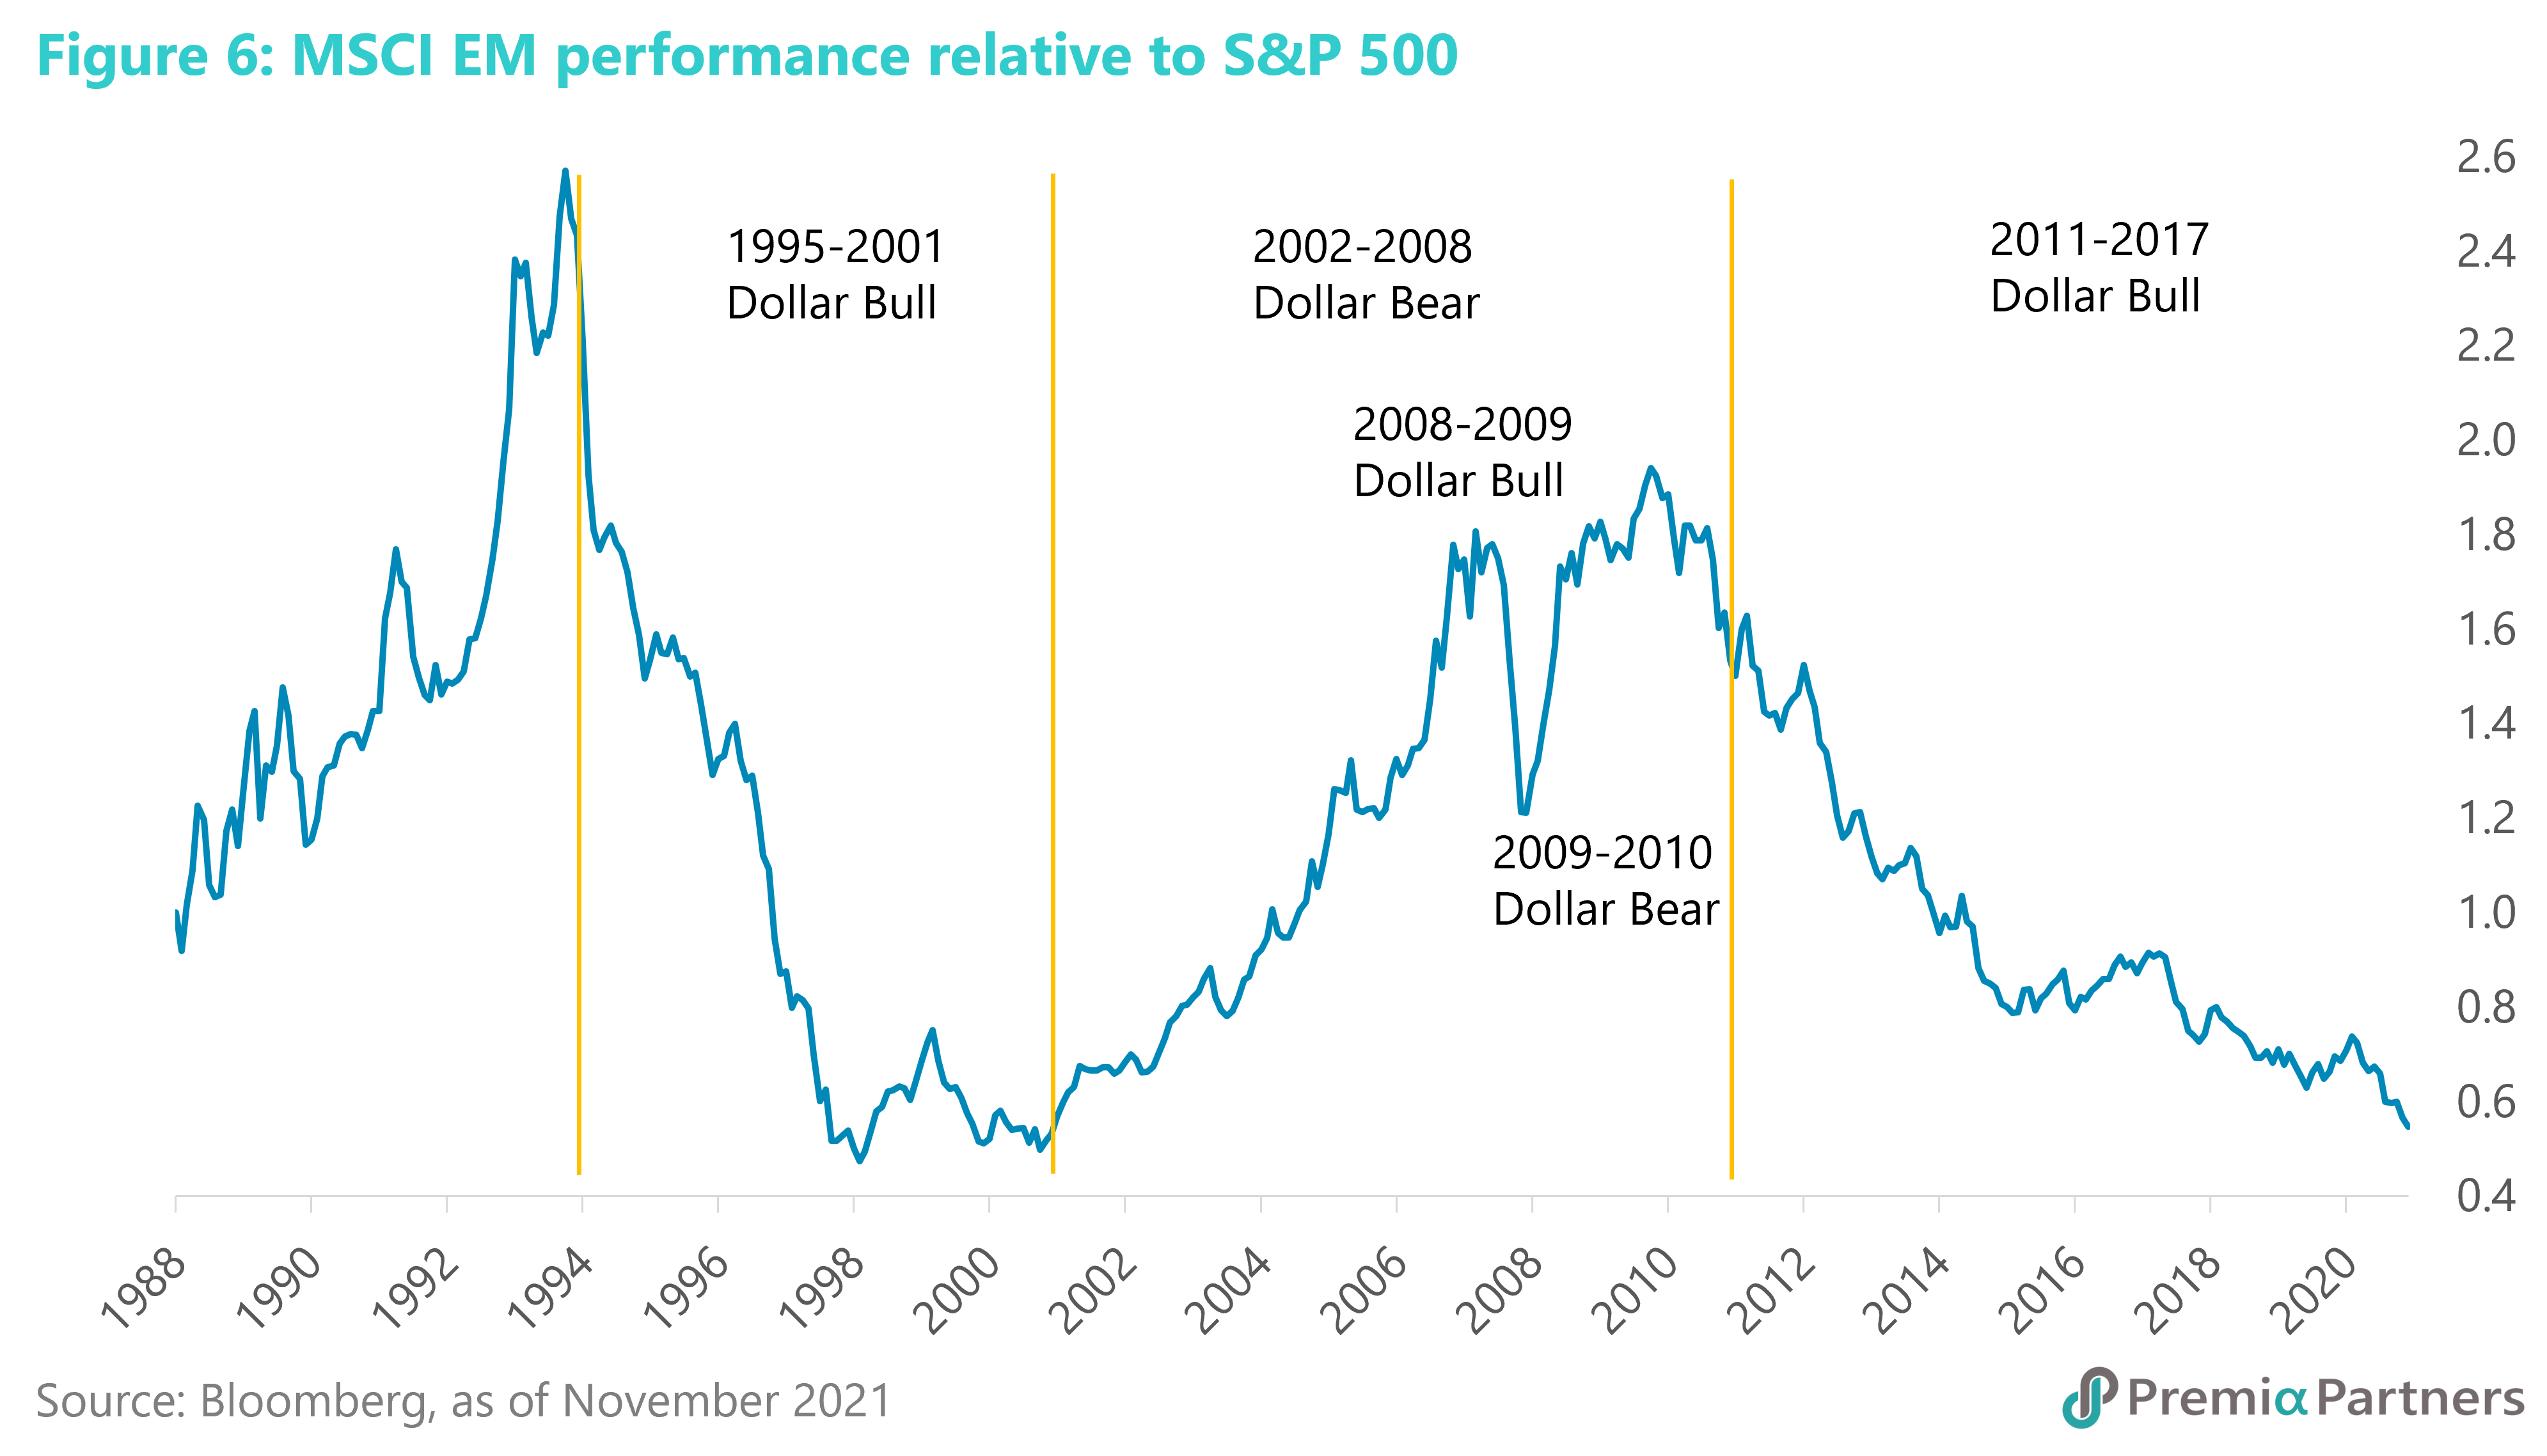
Underweight Emerging Markets ex-China, overweight Chinese equities. Our contrarian weak US Dollar call (see below) would normally have positive implications for Emerging Markets, given the historical tendency for a weak US Dollar to support outperformance by Emerging Markets vis-à-vis the S&P 500 (figure 6). But the unique circumstances of the pandemic complicate matters for EM. The relatively low vaccination rates in much of EM, high inflation, upward pressures on interest rates, and lack of government policy ammunition makes it unlikely that EM will outperform in 2022. Indeed, our weak Dollar call applies mostly to the so-called “major currencies”, not to EM currencies.
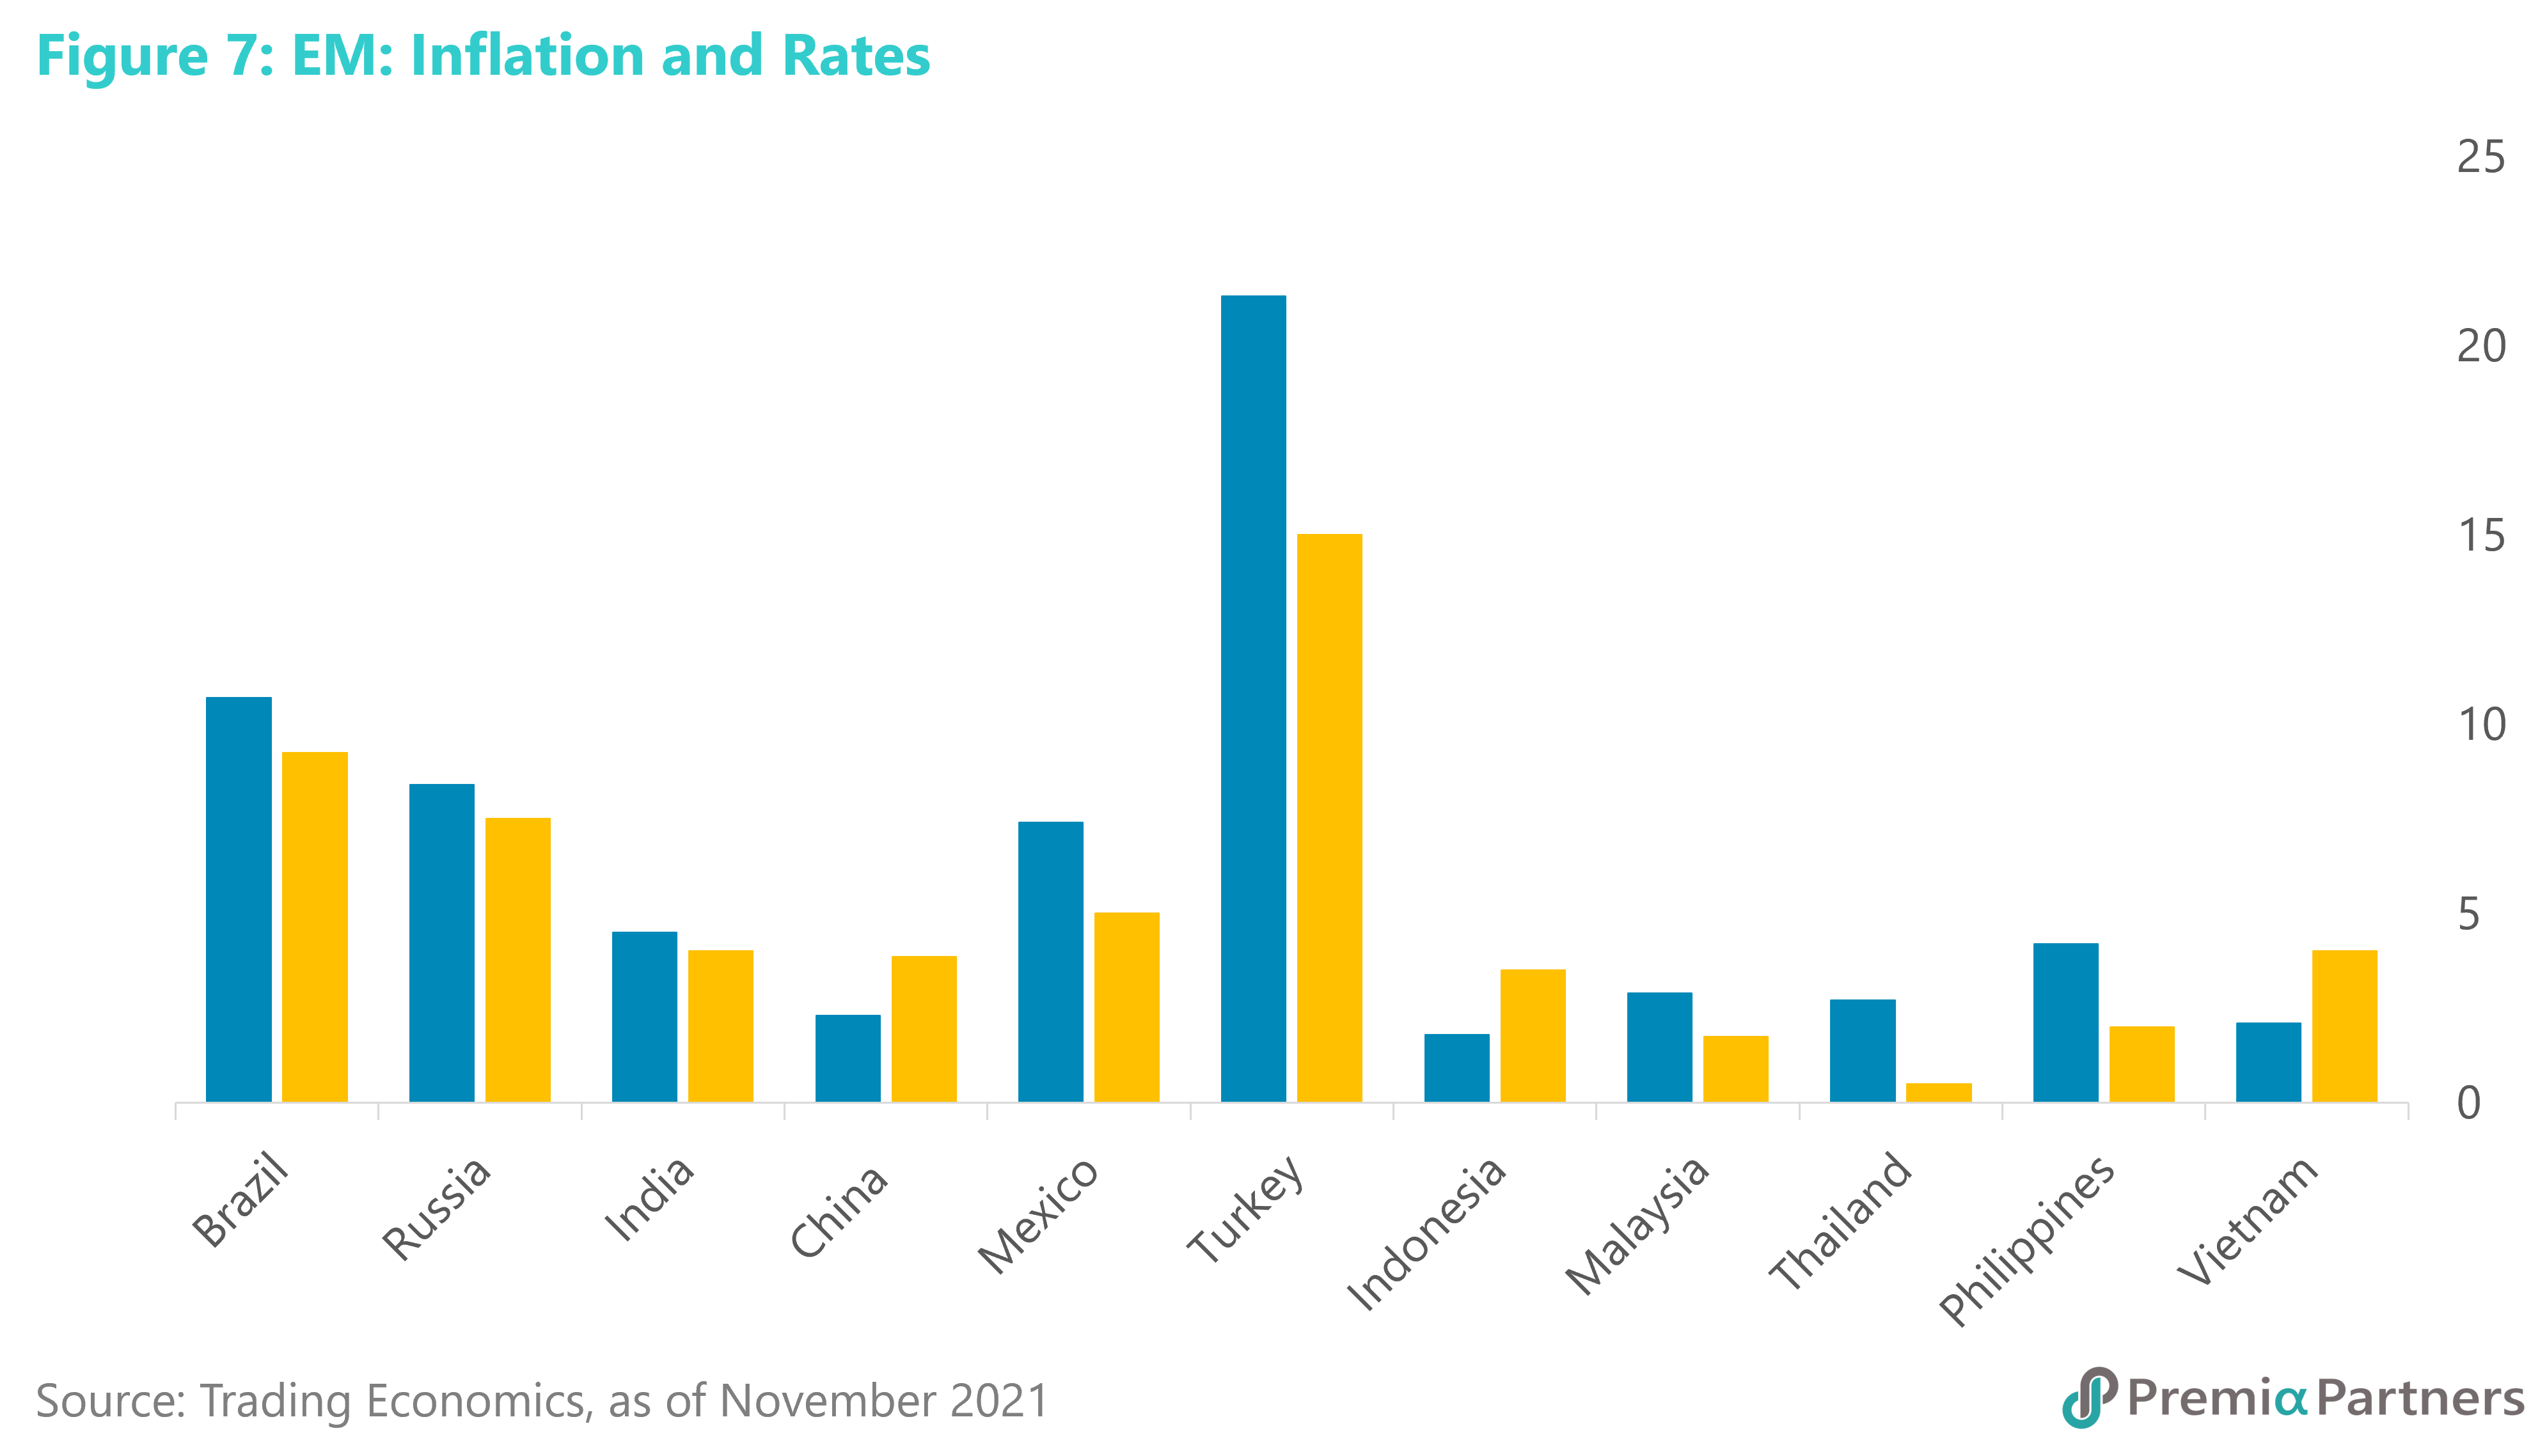
China is our preferred EM proxy play, given its hitherto effective management of the pandemic, relatively low inflation and interest rates (figure 7), and the turning of the policy cycle towards accommodation in 2022. China is already almost half of the weighting of the MSCI Emerging Market Index. For diversification within EM, we would prefer ASEAN, given lower inflation rates and relatively little upward pressure on rates at the moment.
India had been a favorite in 2021 for some EM managers. But with a forward PE of 22x, the MSCI India is at the top of its 25-year PE-band history. With 19% index earnings growth expected for 2022, it is fairly priced. At 12x PE, the MSCI China is at the lower end of its PE-band range. With 15% earnings growth expected, Chinese equities are looking much more attractive. The People’s Bank of China has already cut the RRR by 50 basis points. If this is followed by more easing measures – including the already signaled more accommodative approach towards the property sector – there is a reasonable prospect of analysts upgrading earnings growth forecasts, which were framed before the recent announcement.
After months of negative media and market selling, we may have passed peak China pessimism. Google Trends showed worldwide searches of the term “China crash” shot to unprecedented levels in May of this year. It has since fallen sharply. The last spike in November 2018 saw bottoming of the CSI 300 the following month and a 40% rally over the following four months. Before that, “China crash” searches peaked in July 2015. The CSI 300 (again) bottomed one month later, rallying 33% in four months. And before that, “China crash” searches peaked in March 2014. That marked the low of the CSI 300, which then rallied up to 78% over 10 months.
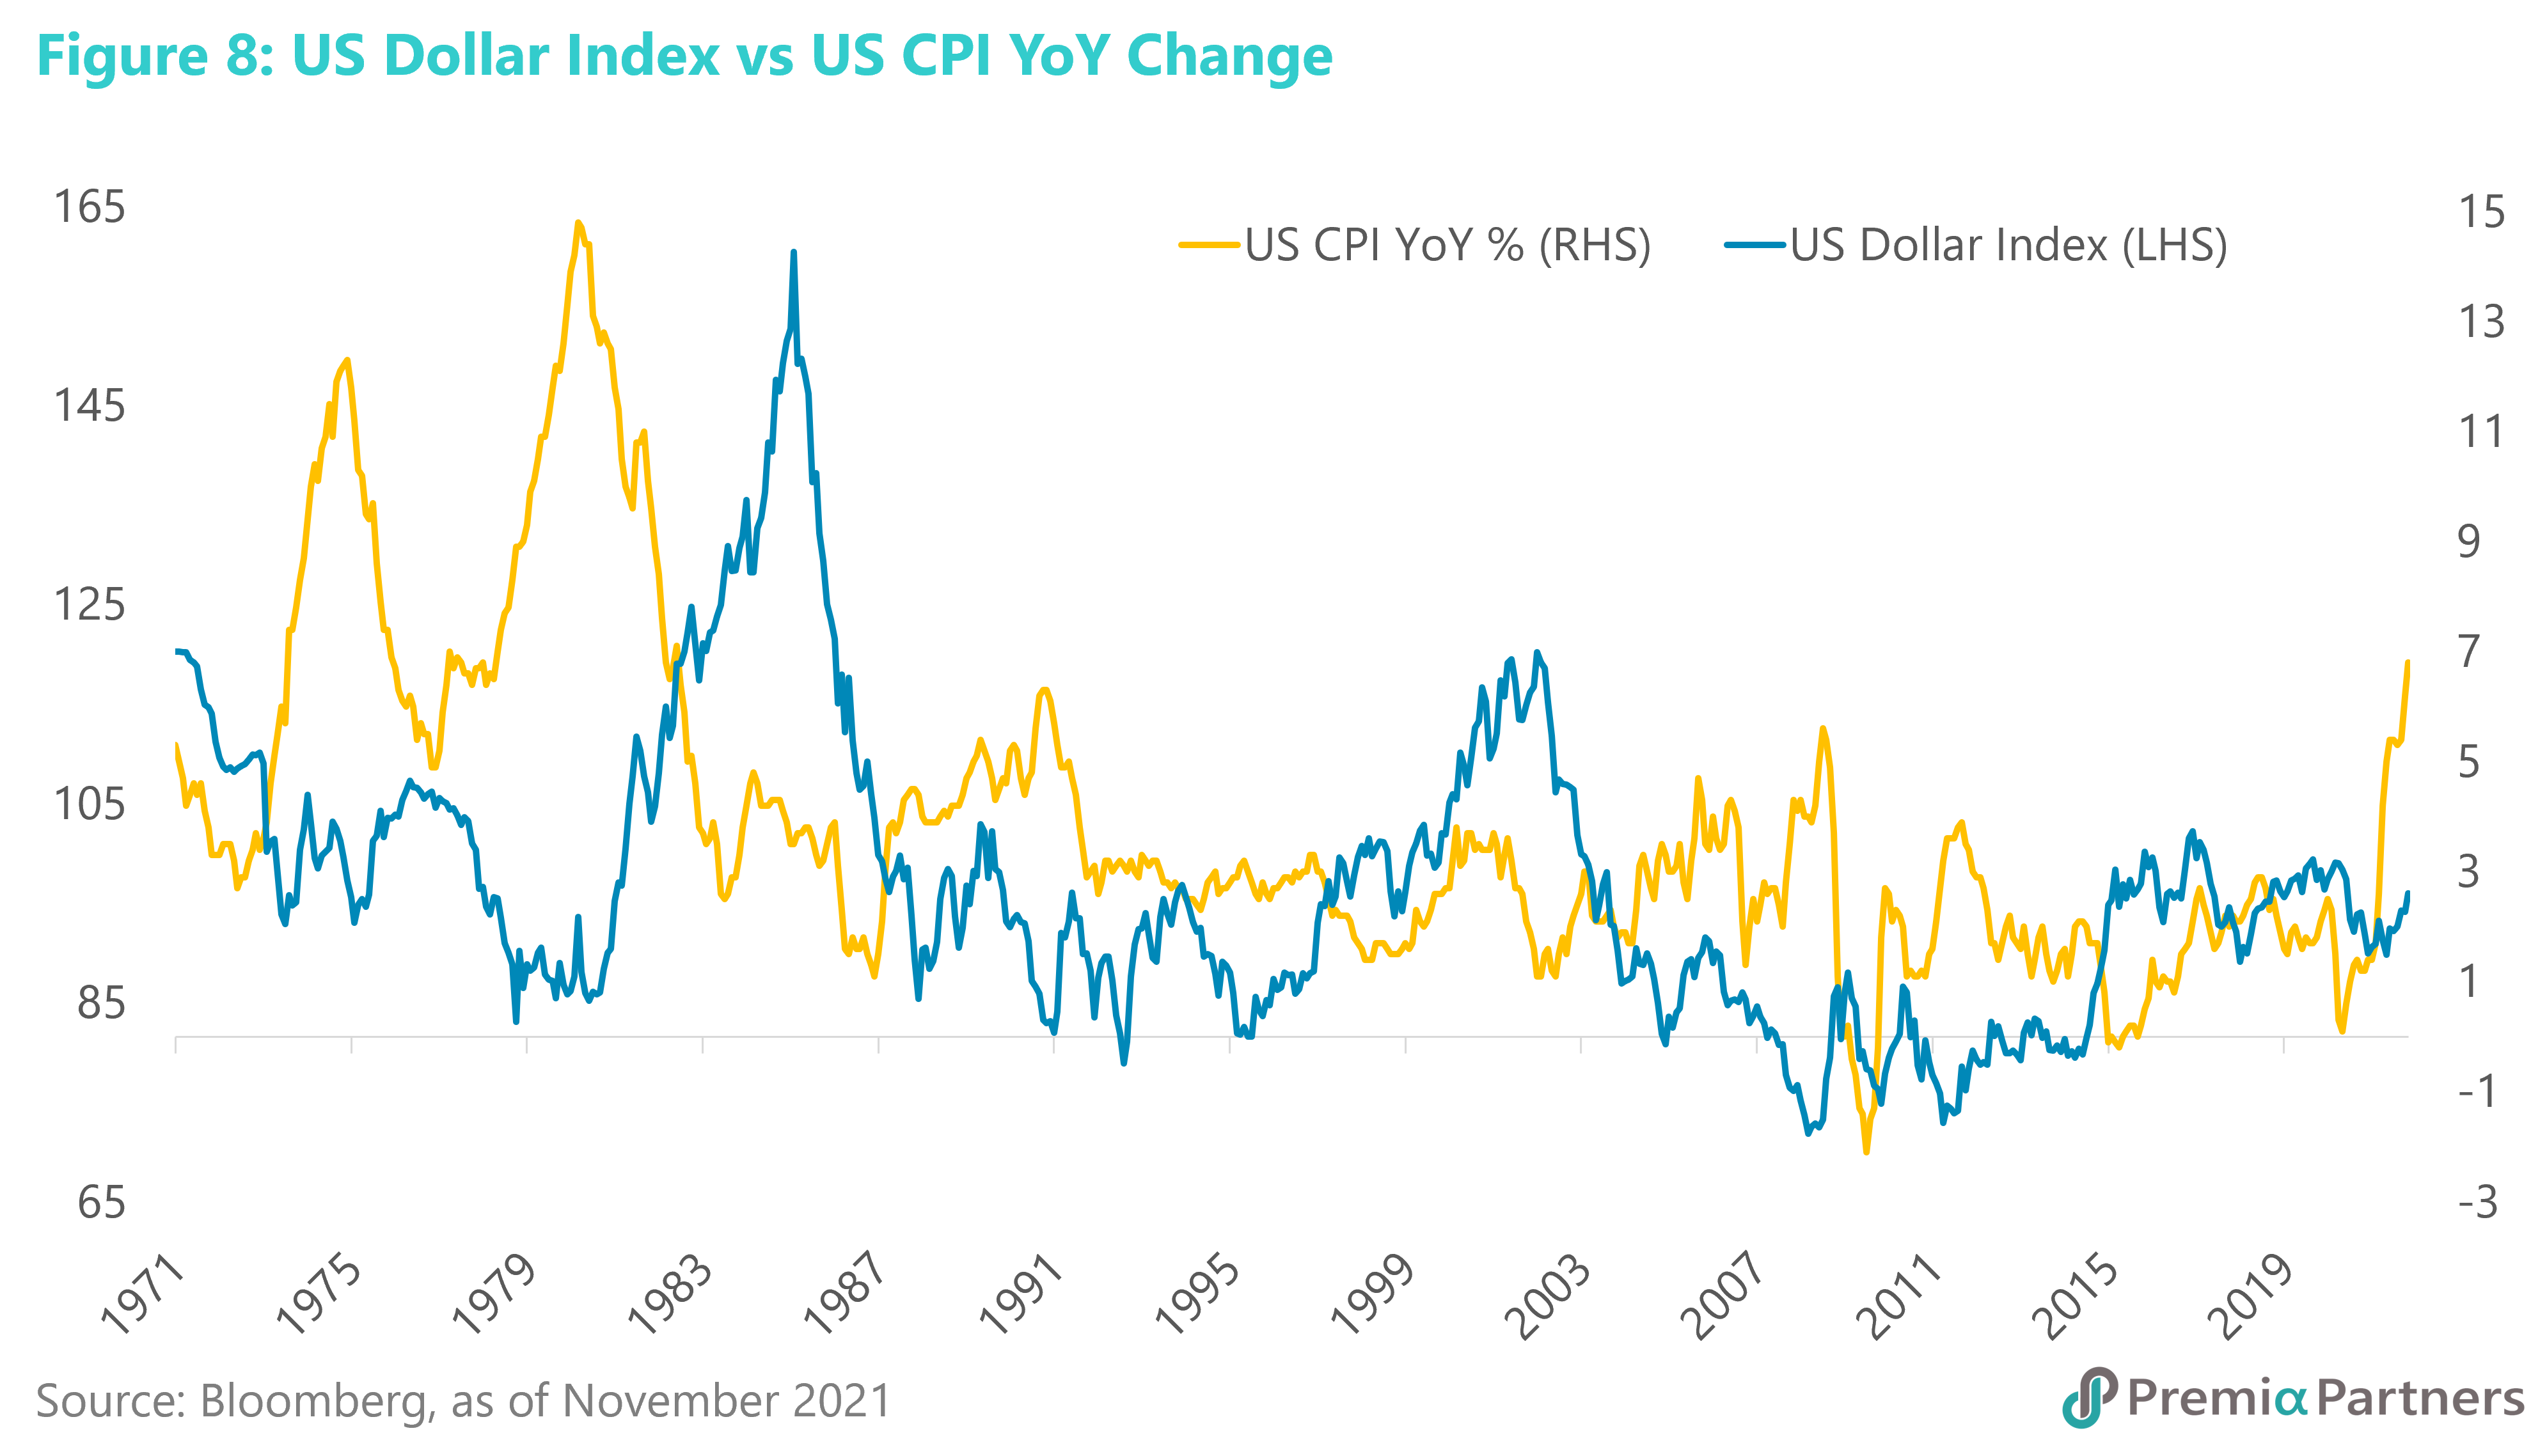
US Dollar – a contrarian, long term view of the Greenback and inflation. We recognize we are running against the market consensus on this. Speculative longs on the USD had by end-November hit the highest level since June 2019. The logic of that is not hard to see. With inflation rising and upward pressure on UST yields, the US Dollar should trade higher against other currencies, in line with higher yields at the shorter end of the UST curve, and that is observable over short periods of time. However, taking a longer-term view, periods of high inflation have coincided with a weaker not stronger Dollar. During the 1970s, high inflation saw the Dollar Index trade lower, bottoming between 1978 and 1980, coinciding with a peak in US inflation in March 1980. Paul Volcker’s crushing of US inflation from around 15% in March 1980 to around 2% by December 1986 saw the Dollar Index rally almost 90%. Since then, much smaller spikes in inflation have tended (not always) to coincide with US Dollar weakness – e.g. 1986-1990, 1994-95, 2004-2008, 2009-2011 (figure 8).
The risk for the Dollar this time is that inflation could outpace the ability of the Fed to lift rates and yields. So real yields for US assets fall, making US assets less attractive. We should remember that debt sustainability requires US borrowing costs to be below its nominal GDP growth rate. Put another way, the US needs to keep real government bond yields below the real GDP growth rate for it to have a chance of growing its way out of its government debts.
US Treasuries and corporate credits offer little value. With the spreads on corporate credits almost at 2007 lows – and with rate hikes imminent – it makes very little sense putting money into them. The term “picking up pennies in front of a steamroller” comes to mind. We all know what happened to corporate credits in 2008. And with corporate credits trading fairly correlated with the S&P 500 over the past six months, there is little diversification value either.
