
The Perpetual Put Vs Recession Threat
The great sideways struggle in global equities over the past year has developed into a battle between the Perpetual Put versus a possible recession.
The latest bounce in global equities, middle of week of 3rd June, was driven by expectations of a Fed rate cut. But most Fed rate cutting cycles going back to 1955 have been associated with US recessions and bear markets. This isn’t anything investors should be celebrating.
The Perpetual Put is wishful thinking. But the market is thinking – after the Greenspan Put, the Bernanke Put, the Yellen Put – we now have the Powell Put. And when you look back at the history of the market “tail” wagging the central bank “dog”, the market could be forgiven for assuming it has a “Perpetual Put”.
And if investors are faced with renewed interest rate cuts off historically (still) low levels, and in some parts of the world, continued or even renewed quantitative easing, they might be pressured to continue or resume investing out of yield hunger.
While this can make equities markets happier – for a time at least – it is unlikely to make the economy better.
Why more stimulus will fail. Quantitative easing (QE) and zero interest rate policy (ZIRP) did help financial markets out of crisis in 2009. But QE2 and QE3 and continued ZIRP delivered only a bit more than 2% average annual GDP growth in the US. That compares with previous recoveries from recessions going back to 1970, where the average was around 4%. Diminishing returns had long set in. QE and ZIRP were linked to stimulating borrowing – and that it did well. But the logic of borrowing – bringing forward spending from the future – simply digs bigger holes for the economy to fall into down the line.
US 1QGDP was “borrowed” from subsequent months. US 1Q GDP growth of 3.2% annualised appeared to have broken the growth downtrend from 2Q18. But it may prove transitory, with a possible resumption of slowing growth in 2Q19. The first quarter figure was boosted by volatile – and likely unsustainable – factors, such as a build-up in inventory, a decline in imports, and a spurt of state/local government spending. The inventory build-up will be an overhang on growth in subsequent month. And while lower imports may “goose” growth through the net exports factor, they speak of weakness not strength. More specifically, weakness of domestic demand. Stripping out government and volatile inventory and trade effects, the underlying final sales to private domestic purchasers grew at only 1.3%, the slowest since 2013.
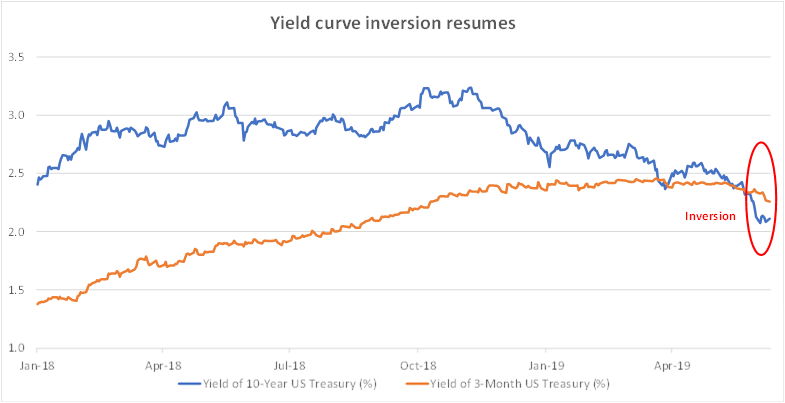
Why bonds are a more reliable indicator of trouble than stocks. The yield curve remains inverted, with the 10-year yield now at 23 basis points below the 3-month, highlighting the continued divergence between the bond market’s steadfastly bearish signals and the wild mood swings in equities. No market-based indicator is fail-proof. But the bond market is a far better predictor of recessions than the manic-depressive mood swings of equities’ “Mr. Market”. Bonds predict US recessions more accurately and earlier than stocks. The US equities market picks up recessions – where it does at all – with generally shorter lead times than the bond market.
And the US stock market has had some spectacular failures in picking recessions. During the Great Depression, the S&P 500 index was booming right until November 1929 when the Depression had already started – it walked right into a massive hole. In 1946, the S&P 500 started falling only after the recession of 1945 was over! It didn’t pick the 1953-1954 and 1957 recessions. In 1961, the S&P 500 (again) only started to fall after the recession of 1960-61 was over. In 1981, it finally fell right in the middle of the double recession of 1980-1982. And most recently, it warned of recession in late 2007, just two months before the recession started. So, it’s more often a coincident and even lagging, rather than a forward, indicator. On the other hand, inversion of the 3M-10Y curve, sustained over a quarter, has had a perfect track record of picking recessions over the past 40 years.
The yield curve today tells us one thing clearly – the US economy is in trouble again. That inversion has so far been an “on-off” affair. It inverted in late March, but popped back marginally positive in April, before inverting again from the last week of May. So, even by the standards of yield curve believers, a US recession is still not a done deal. And if the Fed does cut rates – as the market expects – that could change dynamics. But equally, it could end up being a race to the bottom between the 3-month and 10-year yields, with resultant recessions, as has happened often in the past. One can cite the examples of 1970, 1980, 1989, 2000, 2007, among others. So, while you can’t be sure there will be recession, you can be more certain the US economy is in the danger zone again. The US economy will likely slow through the rest of the year.
The rest of the world also faces slowing growth. Like the US, Japan also recorded a better than expected 1Q 2019 GDP growth figure of 2.1%, annualised. (And that figure could be revised upwards in coming days.) But in Japan as in the US, the headline figure masked underlying weakness. As in the US, it was boosted weakness in imports, which then translated into a bigger net export contribution to GDP. Note though it wasn’t because of stronger export growth. Exports declined. But imports declined even more – a sign of weak domestic demand. And exports will be critical over coming months. Where exports go, so will Japanese corporate earnings, capital expenditure, wages, and private consumption. By the way, Japanese private consumption growth went negative in 1Q2019. And while 1Q capital expenditure could be revised upwards in coming days, I wouldn’t bet on growth continuing if exports continue falling. Japan’s manufacturing PMI, potentially forewarning continued export weakness fell into contraction for May.
Euro Area real GDP growth accelerated in 1Q2019 to 0.4% q/q, up from 0.2% in 4Q2018. But as the European Central Bank pointed out, the risks going forward are tilted to the downside, with incoming data suggesting weaker growth in coming quarters, reflecting “weakness in international trade” amidst “global uncertainties”. The ECB was of course referring to the US-China trade dispute.
Amidst the trade dispute, the International Monetary Fund has downgraded marginally China’s GDP growth outlook for this year from 6.3% to 6.2%. It is expecting further easing in growth to 6% for 2020.
Forecasting GDP growth in China – more than for the developed market economies – is about predicting the course of the trade dispute with the US and Chinese government policy responses. The slowdown last year was engineered by the government, which suppressed growth in credit, total social financing, and infrastructure investment. Beijing will likely favour growth over deleveraging if a full-blown trade war is sustained.
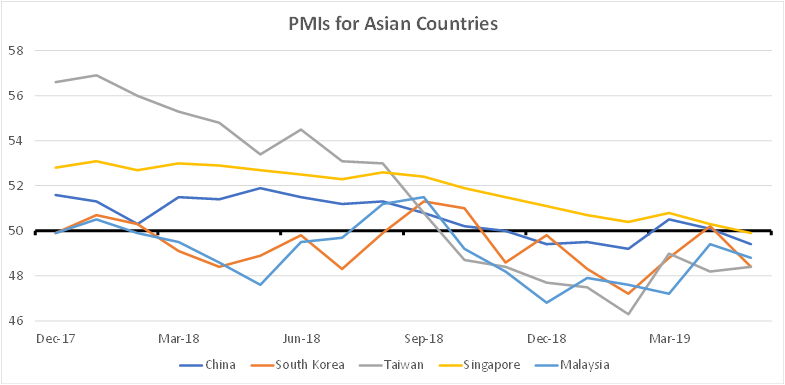
But the latest is that fresh signs of economic weakness are appearing again, despite recent policy stimulus stabilising growth in the early months of the year. China’s official Manufacturing Purchasing Managers Index (PMI)– which had been declining from the middle of last year – popped back above the breakeven 50-point level in March and April. But it fell back into contraction again in May. Running broadly in tandem, exports, which fell through 4Q2018, popped back into growth in January-March 2019, before falling into 8.3% y/y contraction in April.
Again, for China, as for the above major economies, the risks are clearly on the downside.
Reflecting the same darkening trade outlook, manufacturing PMIs are contracting in South Korea, Taiwan, Singapore and Malaysia.
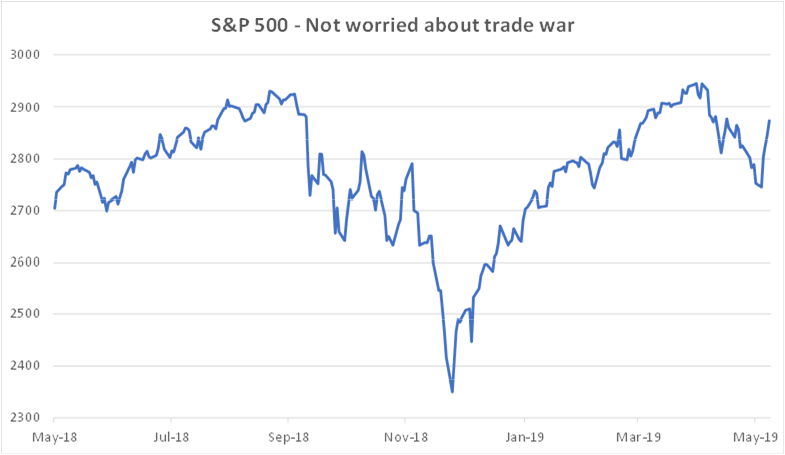
Trade war not yet in the price. The S&P 500 has traded sideways over the past year, retesting a few times 2940-2950 resistance. A big sell off in 4Q2018 was bought back to slightly above the prior high in 1H2019. This is not a fearful market.
The US Dollar Index DXY has been in a rising channel over the past 12 months, driven by the relative strength of the US economy and the Fed hiking cycle. But amidst tariff measures and counter-measures, the DXY (counter-intuitively) fell sharply from late May. And the driver there was most likely dovish signals from the Fed and the resultant drop in 10-year US Treasury yield. Again, hardly any sign of concern over a sustained trade war, which should have driven the Dollar higher, not least on likely Yuan depreciation.
So, the market is thinking this is Donald Trump doing his “fire and fury” act ala North Korea. Or to put it in Shakespearean language, “sound and fury, signifying nothing.”. In the end, the US President will do a deal the Chinese can accept and claim it a “great victory” for the United States, so the thinking goes. And that may still happen. But there are huge risks that, at best, both sides will agree only on another temporary truce, with the most contentious issues of China’s economic model – state subsidies and its currency regime – left for another time. You can read a detailed analysis of trade war dynamics here.
Meanwhile, uncertainties will overhang global capital expenditure, supply chains, and trade, eroding an already weakening global economy.
Stay defensive. Early April, I wrote that despite fundamental weaknesses, there was “considerable momentum” that could carry equities higher. And that was generally what happened in April. But markets gave back in May, only to start recovering losses early June. In summary, this is just “wheels spinning” in slush. All noise, no direction. I will repeat my strategy of staying defensive, switching weight from equities to investment grade fixed income, and within equities, preferring value vs growth.
All the above charts are sourced from Bloomberg, Jun 2019
Related Premia Partners tickers
High quality China A blue-chips: Premia CSI Caixin China Bedrock Economy ETF – 2803.HK
High quality China A new economy stocks: Premia CSI Caixin China New Economy ETF – 3173.HK
ASEAN as a trade war beneficiary: Premia DJ Emerging ASEAN Titans 100 ETF – 2810.HK / 3173.HK
