GDP growth – China outperformed the US in 1H2023 and matched the US economy’s best quarter in 3Q23. The US economy is written up in the media as “robust” while the Chinese economy is supposedly in trouble. The data however shows China has been beating or at least equalling the y/y growth performances in the US for the first three quarters of 2023.
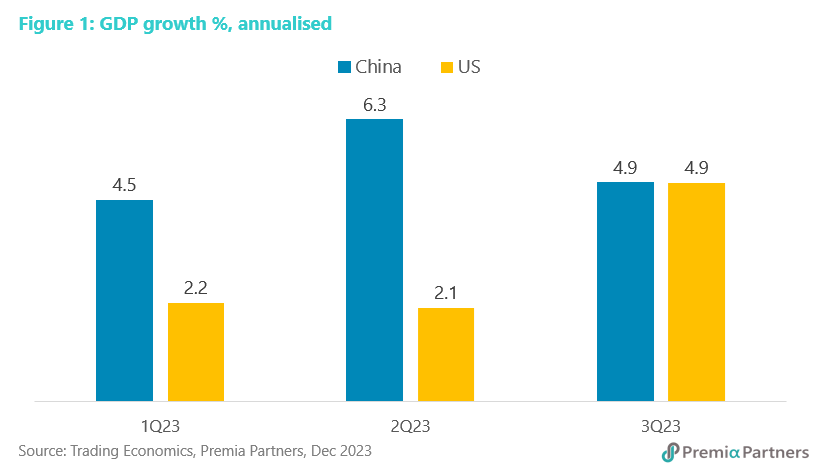
For the first three quarters of the year, China’s real GDP growth was 5.2% y/y. Meanwhile, on data up to 3Q23, we expect the US economy is likely to grow at only between 2.3%-2.5% in 2023.
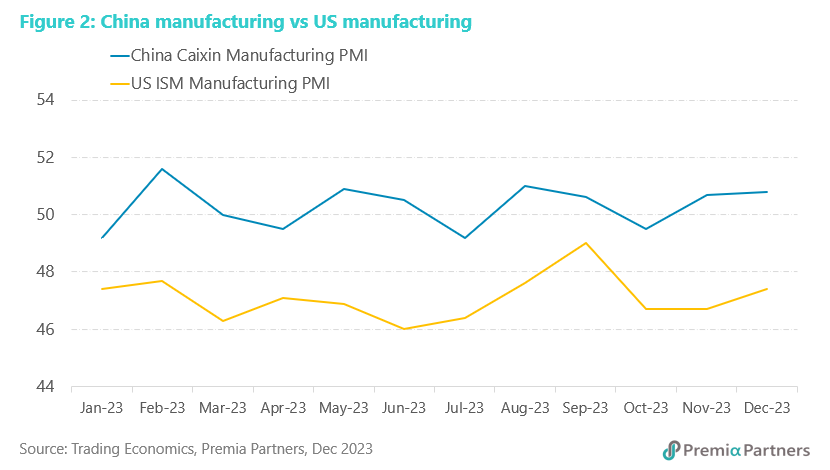
Manufacturing in China faced headwinds from weakness in major export markets but note that US manufacturing was in contraction for the whole of 2023. It has to be noted that the data is not directly comparable due to different methodologies and data standards. So, this is more indicative of the trends rather than a direct comparison – for example, for the Caixin Manufacturing PMI, 50 is the border between expansion and contraction. For the ISM Manufacturing PMI, the equivalent is 48.7 “over a period of time”. Notwithstanding the differences, the key takeaway here is that the Caixin Manufacturing PMI was in contraction in four out of 12 months in 2023. The ISM Manufacturing PMI was in contraction every month last year.
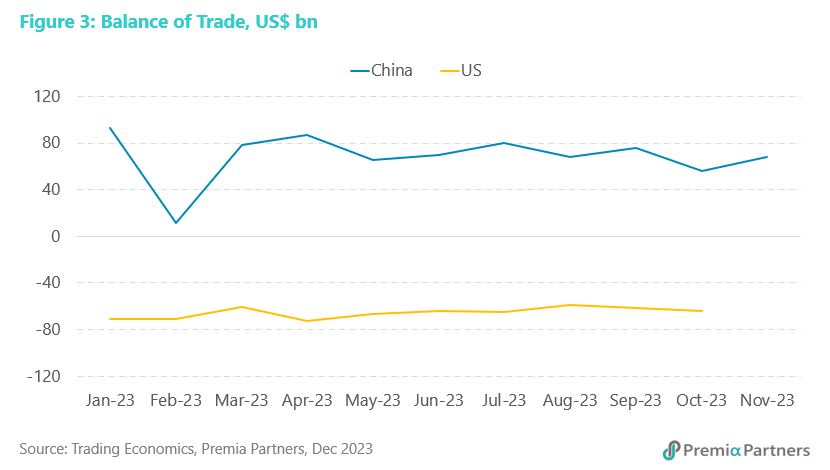
Despite export market weakness, China continued to run trade surpluses while the US ran trade deficits. The weakness in China’s export markets referred to above resulted in an overall 5.6% y/y decline in China’s exports for the 11 months to November. The US also recorded a decline in merchandise exports, but a smaller one of around 2.0% y/y, in the 10 months to October 2023. However, in terms of “paying their way in the world” and for contributions to GDP growth, China continued its tradition of sizeable trade surpluses in 2023 while the US maintained its tradition of sizeable trade deficits
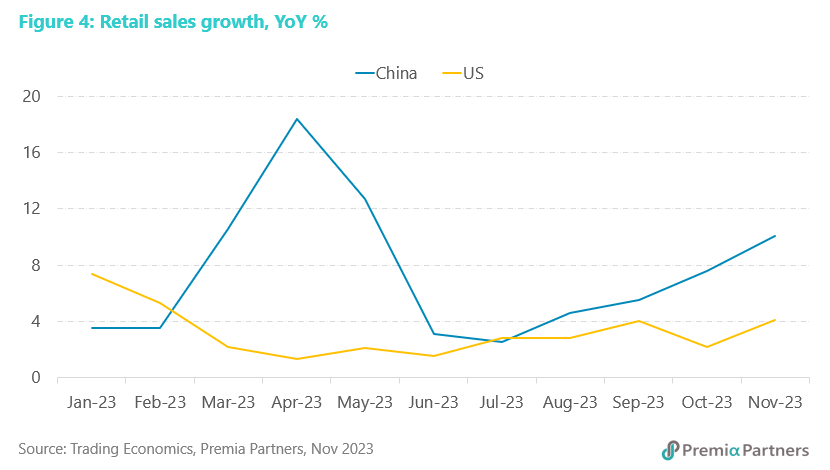
China’s retail growth was stronger than that in the US. China’s consumption expenditure is supposed to be languishing because of the problems in the property market, while the US consumer is held up as indefatigable. The data on retail spending growth however does not verify this. Indeed, while the retail sales growth for China has been much more volatile, the growth figures were stronger in China for eight out of the 11 months to November.
China’s overall fixed asset investment growth was not far behind the US and investment in infrastructure grew 5.9% in the first 10 months of 2023 and investment in manufacturing was up 6.2%. Again, the comparison is not a direct one, given differences in measurement standards, methodologies and time frames. Again, it is only indicative of trends. For the US, the data is capital formation y/y for the nine months to end-3Q23. For China, it is fixed asset investment y/y for the 11 months to end-November. For China, the y/y growth rate was 2.9%. For the US, gross capital formation in the first 9 months was 3.6% higher than the same period 2022.
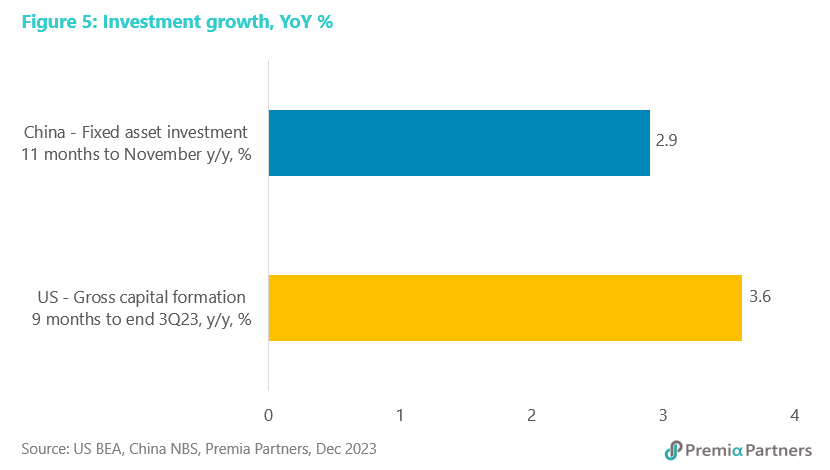
However, as pointed out by Professor Yan Liang of Williamette University, Oregon, stripping out the real estate sector, private investment grew 9.1% in the first 10 months of 2023. Investment in infrastructure grew 5.9% and investment in manufacturing was up 6.2%, offsetting a 9.3% contraction in real estate investment. That contraction in property investment was a “deliberate policy choice” to restructure a “highly leveraged and speculation fuelled” sector, Professor Liang noted recently in an article published by the East Asia Forum.
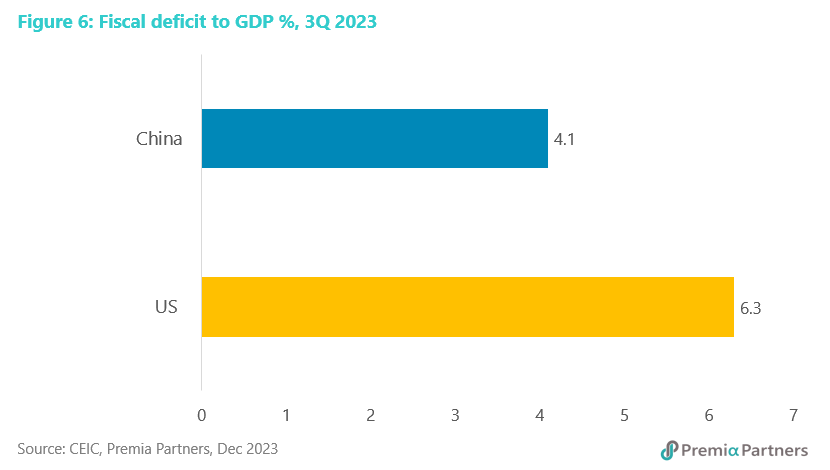
China depended less on deficit spending to “goose” growth than the US. One way of boosting growth is through government expenditure. As at 3Q23, China’s fiscal deficit was reported by CEIC at 4.1% of GDP, while the fiscal deficit for the US was 6.3% of GDP.
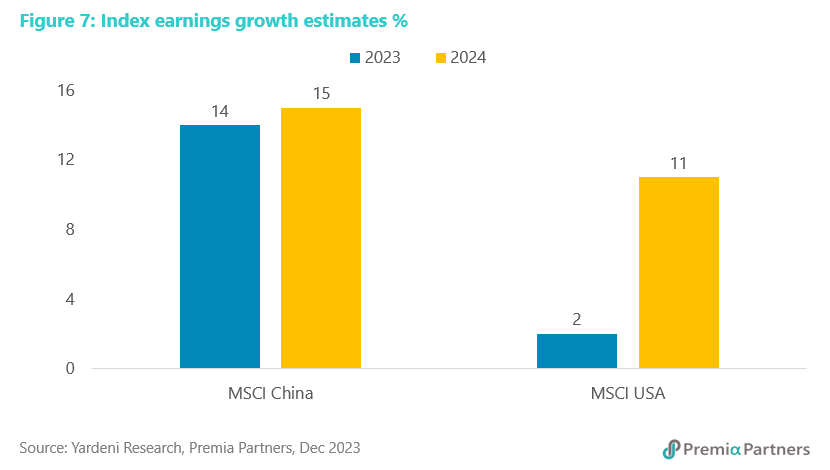
Despite all the pessimism on Chinese assets, earnings growth for Chinese equities are likely to be higher than in the US for 2023 and 2024. The analysts’ consensus estimate for MSCI China earnings growth for 2023 was recently reported at 14% and for 2024 at 15%. The earnings growth for MSCI USA was estimated at 2.0% for 2023 and 11% for 2024.